
Abstract
Background:
Time series analysis provides information on blood glucose dynamics that is unattainable with conventional glycemic variability (GV) indices. To date, no studies have been published on these parameters in pediatric patients with type 1 diabetes. Our aim is to evaluate the relationship between time series analysis and conventional GV indices, and glycosylated hemoglobin (HbA1c) levels.
Methods:
This is a transversal study of 41 children and adolescents with type 1 diabetes. Glucose monitoring was carried out continuously for 72 h to study the following GV indices: standard deviation (SD) of glucose levels (mg/dL), coefficient of variation (%), interquartile range (IQR; mg/dL), mean amplitude of the largest glycemic excursions (MAGE), and continuous overlapping net glycemic action (CONGA). The time series analysis was conducted by means of detrended fluctuation analysis (DFA) and Poincaré plot.
Results:
Time series parameters (DFA alpha coefficient and elements of the ellipse of the Poincaré plot) correlated well with the more conventional GV indices. Patients were grouped according to the terciles of these indices, to the terciles of eccentricity (1: 12.56–16.98, 2: 16.99–21.91, 3: 21.92–41.03), and to the value of the DFA alpha coefficient (> or ≤1.5). No differences were observed in the HbA1c of patients grouped by GV index criteria; however, significant differences were found in patients grouped by alpha coefficient and eccentricity, not only in terms of HbA1c, but also in SD glucose, IQR, and CONGA index.
Conclusions:
The loss of complexity in glycemic homeostasis is accompanied by an increase in variability.
Background
U
The loss of complexity in glycemic profiles is an early warning sign of dysfunction in glucoregulation and the progression toward diabetes. 3 The complexity of a glucose curve can be estimated by means of DFA through the alpha coefficient, which indicates the magnitude of the influence of a single point in a time series. As a general rule, the lower the coefficient, the greater the complexity, which in this case means the more stable the glycemic homeostasis. Recently, Crenier et al. conducted an evaluation of the complexity of glucose homeostasis measured with the aid of DFA and entropy in healthy subjects (including a small number of adolescents) and adults with type 1 diabetes. The parameters showed a good correlation, both with each other and with the indices evaluating insulin resistance, an association that went undetected when more conventional GV indices were used. This indicates that decreases in complexity are more sensitive and may serve as an earlier warning sign of glucoregulation impairment than conventional GV indices. 4
Another way of analyzing glycemic curves is with a Poincaré plot, a simple visual technique for analyzing dynamic systems and ascertaining the complexity of a given series. In one study, which was carried out on adults with type 1 diabetes and which validated the parameters associated with the plot, 5 the authors observed that these parameters correlated well with conventional GV indices.
To date, however, no studies have used time series analyses to evaluate glucose dynamics in children and adolescents with type 1 diabetes.
Study Goals
This study aims to evaluate the relationship between GV in children and adolescents with type 1 diabetes as measured with time series analyses (DFA and Poincaré plots) and as measured by means of conventional GV indices. In addition, the relationship between the parameters derived from the time series analyses and metabolic control in terms of HbA1c will be assessed.
Materials and Methods
Patients
This is a cross-sectional study carried out between October 2014, and June 2015, in the cohort of children and adolescents with type 1 diabetes who received medical care in the Diabetes and Outpatient Units in Healthcare Area number 4 (Sagunto Hospital) of the Autonomous Region of Valencia, Spain.
Inclusion criteria
Patients aged 6 years or older, with a minimum disease progression time of 1 year, receiving adequate follow-up (established as 4 clinical check-ups and analyses per year). Subjects who suffered from any prior kidney disease or concomitant pathologies at the time of the study were excluded. Subjects also had to agree to participate in the study via informed consent signed either by the subjects themselves (for patients over 12 years of age) or their legal guardians.
This study was approved by the Ethics Committee of the Sagunto Hospital (Spain).
Timeline
• Day 1: recording of anthropometric measures and Tanner stage, peripheral neuropathology study, programming of the fundus photograph, initiation of the glucose register through continuous interstitial glucose monitoring (CGM).
• Day 5: discontinuation of CGM; blood and urinalysis.
Clinical and metabolic parameters
• Biographical data and characterization of diabetes: age, sex, disease progression time, insulin regimen and dosage [UI/(kg·day)], family history of high blood pressure (HBP) and early onset cardiovascular disease, and intake of antihypertensive and lipid-lowering drugs.
• Anthropometrics: weight (kg), height (cm), body mass index (kg/m2), and waist circumference (cm). For each parameter, the percentile was identified according to the reference indices and the z score was calculated. 6 –8
• Sexual maturity according to Tanner stage.
• Fasting (12 h) venous blood values:
○ Lipid profile: triglycerides (TG), total cholesterol (TC) and high-density lipoprotein cholesterol (c-HDL), as determined with the enzymatic colorimetric method; apolipoprotein A1 (ApoA1) and apolipoprotein B (ApoB), as determined by means of immunoturbidimetry (COBAS-c-701 analyzer); and low-density lipoprotein cholesterol (c-LDL) determined with the aid of the Friedwald formula. All results are expressed as mg/dL.
○ Total blood HbA1c (%) anticoagulated with ethylenediaminetetraacetic triprotic acid (EDTA), as determined with the aid of high-resolution liquid chromatography standardized with DCCT criteria (ADAMS auto analyzer A1C HA-8180 V).
• Detection of microangiopathy with the aid of fundus photographs (retinopathy), vibratory sensation, and osteotendinous reflexes (peripheral neuropathy); albumin/creatinine ratio from an early morning urine sample (nephropathy). Determination of urinary albumin and urinary creatinine by means of immunoturbidimetry and the colorimetric kinetic method based on the Jaffé reaction (COBAS-C-701 analyzer), respectively. Microalbuminuria (and thus nephropathy) is defined as a ratio ≥30 mcg/mg.
Interstitial glucose register
CGM Dexcom G4-Platinum model. Calibrated with two daily capillary glycemia measurements. For the GV analysis (conventional indices and time series analyses), data from the three middle days of the study were used, from 12:00 am on day 2 to 11:59 pm on day 4. Data were processed with the Dexcom STUDIO program.
Glycemic variability
• Period in months: SD of HbA1c, of the disease as a whole, and in the previous year.
• Period in hours-days, based on CGM data. Two types of analyses were carried out: one with conventional indices and another time series analysis.
○ Conventional indices: SD (mg/dL); CV, expressed as a percentage (100 × SD/arithmetic mean); IQR in mg/dL; MAGE and CONGA (calculated for a 60 min time interval, i.e., CONGA-1). The latter two were calculated with the EasyGV program, available at
○ The time series analysis was carried out with DFA and a Poincaré plot, both calculated with a program designed by our group with the aid of Prof. F. Montes of the Department of Statistics and Operational Research at the University of Valencia, integrated into the R statistics package.
Detrended fluctuation analysis
To perform DFA, the time series had to first be integrated. Next, the integrated curve was divided into time segments of size m. A regression line was calculated for each segment, and the difference between the integrated curve and the different regression lines was computed to obtain F(m) (Fig. 1).

Formulas for detrended fluctuation analysis.
This operation was repeated for different values of m. The smaller the time scale (m), the better the fit of the regression lines to the integrated curve and the lower the value of F(m).
Finally, the relation between F(m) and the size of m was analyzed. A plot was drawn with logF(m) on the y-axis and logm on the x-axis. DFA was the slope of the regression line (α). The closer the α value is to 0.5, the more complex (and thus less predictable) the curve.
The Poincaré plot
This is a dispersion graph of the values of a series compared to those that immediately precede it. If we represent the values observed in the series as {x1, x2, …, xn}, the points on the graph will be the pairs (xt−1, xt), t = {1, 2, …, n − 1}. In our case, the graph was constructed for t increments of 5 min, which was the measurement interval for CGM.
To avoid subjectivity when deciding upon a graph, associated measurements were added. To this end, an ellipse was fitted to the clusters of points, taking as the principal axes the lines y = x, with the perpendicular line determined by the center of gravity of the dispersion graph (Fig. 2).
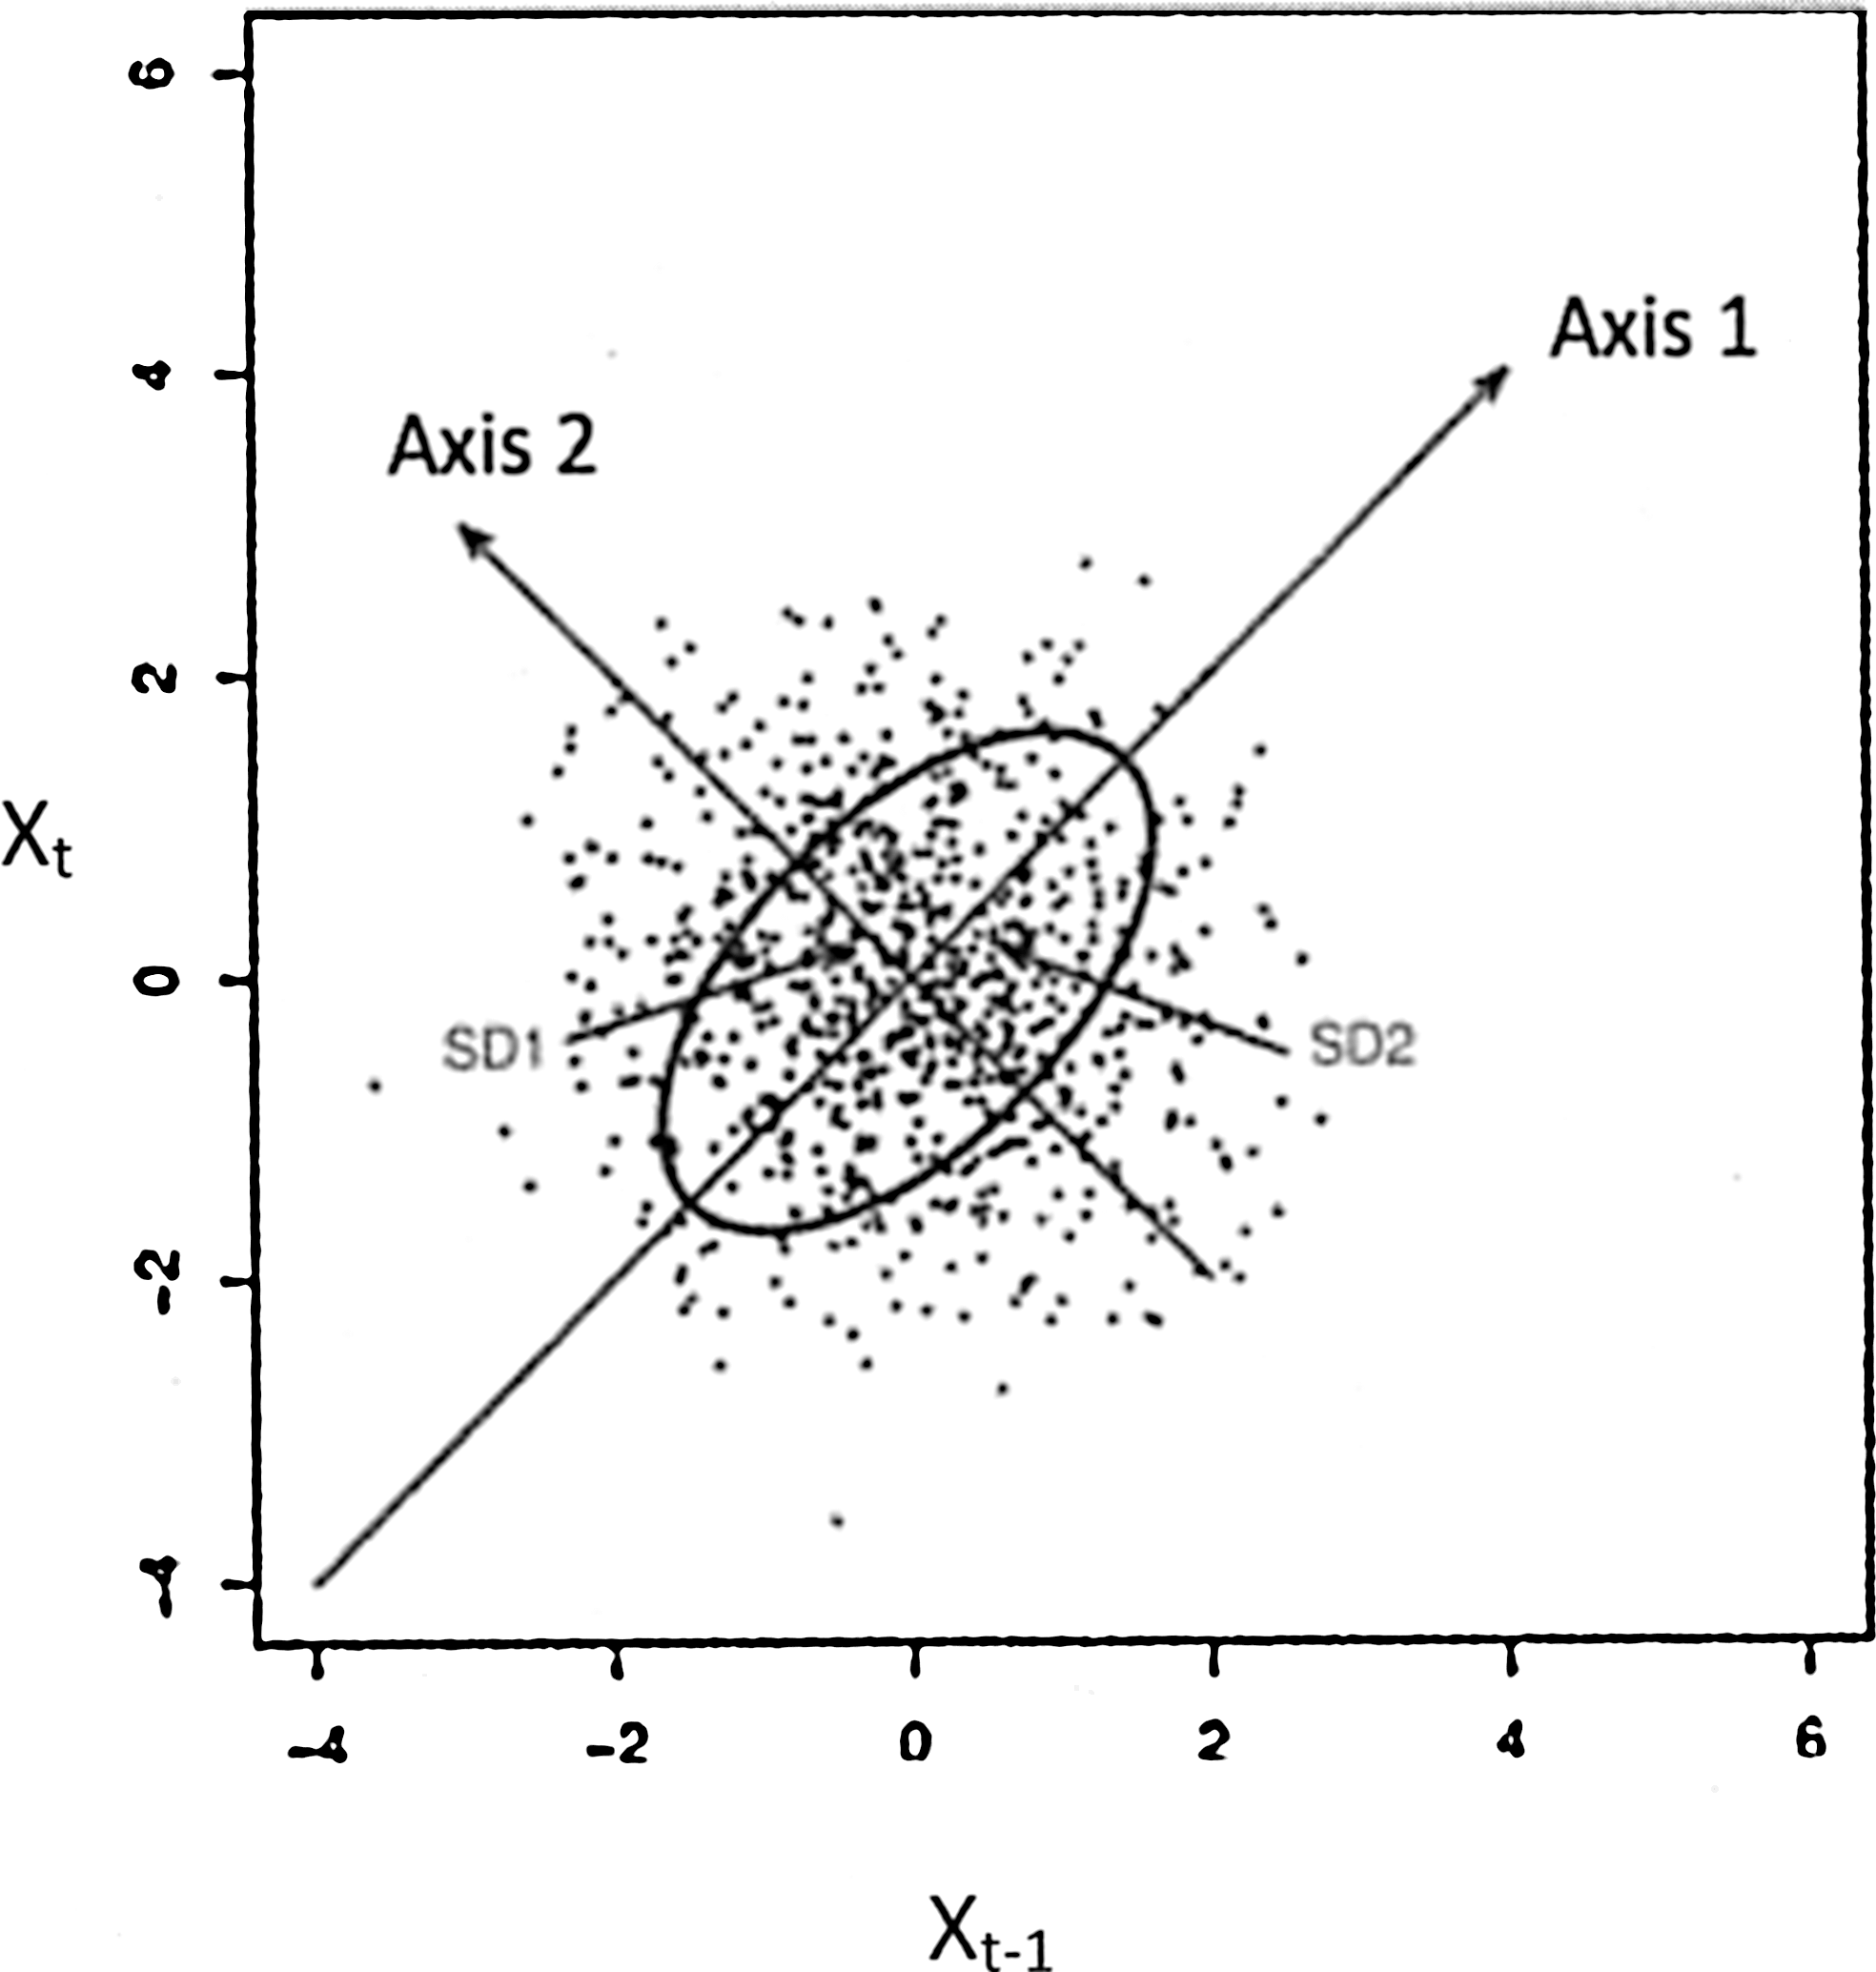
Ellipse fitted to the Poincaré plot.
The parameters associated with this ellipse are as follows (Fig. 3):
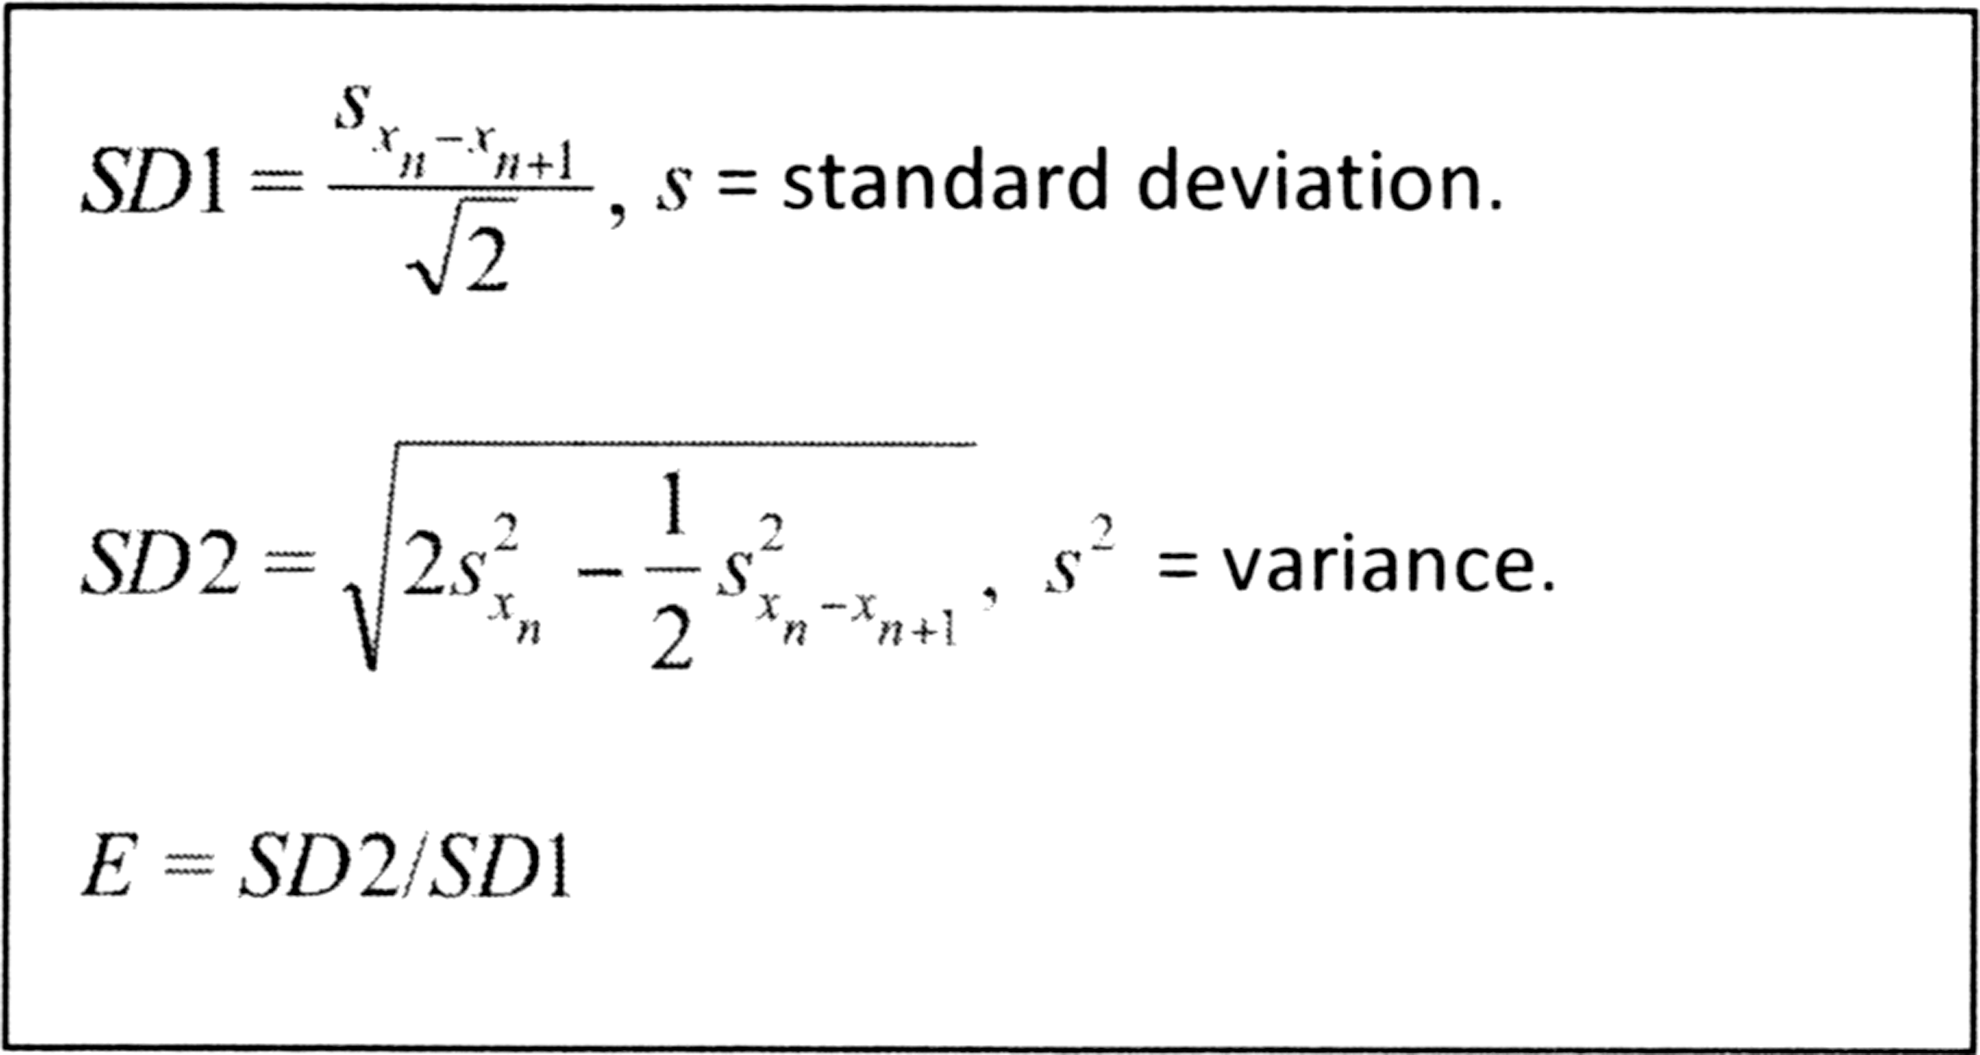
Formulas for parameters associated with the ellipse of Poincaré plot.
Minor axis/SD1: Describes short-term variability and is the typical deviation of the distances between the points and axis 1. In our case, the variability is every 5 min.
Major axis/SD2: Describes the long-term variability and expresses the typical deviation of the distances between the points and axis 2. In our case, this expresses the variability during the 72 h in which the blood glucose register was performed.
Eccentricity (E): Form parameter describing the predominant type of variability.
Statistical analysis
All analyses were carried out with the IBM® SPSS® Statistics program, version 22.0, under license from the University of Valencia.
Descriptive
The normality of the continuous variables was assessed with the aid of the Kolmogorov–Smirnov test. When the distribution was not normal, a logarithmic transformation was performed. Results were presented as mean and SD for normal distributions or as median and IQR between the 25th and 75th percentiles for abnormal distributions. Categorical variables were expressed as absolute frequencies and percentages.
Patients were grouped either by terciles of the conventional GV indices (SD, CONGA, MAGE), the value of the DFA alpha coefficient (> or ≤1.5), or glucose eccentricity.
Analysis
To compare the means between two groups, Student's t-test was used for normal variables. For variables that did not follow a normal distribution, the Mann–Whitney U test was used. To compare means between three or more groups, a one-factor ANOVA was employed, with the Bonferroni test used for multiple post hoc comparisons.
The degree of association was analyzed with either the Pearson or the Spearman correlation coefficient, for normal and abnormal distributions, respectively.
In all cases, the level of significance was established as P = 0.05.
Results
Descriptive study
The pediatric population presenting with type 1 diabetes who received medical attention in Healthcare Area number 4 consisted of 56 individuals. Thirteen did not meet the inclusion criteria and two refused to participate; thus, our total sample included 41 patients (29 males), 37% of whom were prepubescent. Of the total number of subjects, 39 were receiving treatment with a basal-bolus regimen of both fast and slow analogs, 1 patient was receiving a fast acting analog and NPH, and another used a continuous subcutaneous insulin infusion. A history of HBP and early-onset cardiovascular disease in first degree family members was noted in 20 and 5 cases, respectively. Of the latter, four also had a history of HBP. None of the patients presented with microangiopathy or were receiving antihypertensive or lipid-lowering medication. Biographical data along with anthropometric measurements and blood test results are summarized in Table 1.
Mean of glycated hemoglobin of the disease as a whole.
Mean of glycated hemoglobin of previous year.
Glycated hemoglobin at the start of the study.
ApoA1, apolipoprotein A1; ApoB, apolipoprotein B; BMI, body mass index; c-HDL, high-density lipoprotein cholesterol; c-LDL, low-density lipoprotein cholesterol; TC, total cholesterol; SD, standard deviation; TG, triglycerides.
The values for both the conventional GV indices and the time series analyses are given in Table 2. One patient was not included in the glucose time series analysis because the CGM register was interrupted for 24 h.
α, alpha coefficient; CONGA, continuous overlapping net glycemic action; CV, coefficient of variation; E, eccentricity; IQR, interquartile range; MAGE, mean amplitude of the largest glycemic excursions; SD1, minor axis; SD2, major axis.
All variables followed a normal distribution except for weight z score, waist circumference z score, TG, and the Apo1/ApoB ratio. The distribution of these variables could not be normalized even after a logarithmic transformation.
Analytical study
Both the alpha coefficient and SD2 showed a significant association with the conventional GV indices. SD1 and E were associated with SD and IQR, and, in a less consistent manner, with the rest of the indices. The degree of association (Pearson correlation) between the conventional GV indices and the parameters for the time series are given in Table 3.
No significant differences were observed with regard to age, disease progression time, insulin dosage, anthropometric measurements and Tanner stage, lipid profile, and HbA1c between subjects grouped by the different terciles for glucose SD, CONGA index, or MAGE index (data not shown). Likewise, no significant differences were observed between patients grouped by alpha coefficient or by eccentricity with regard to age, disease progression time, anthropomorphic measurements, Tanner stage, or lipid profile. Nevertheless, significant differences were noted in insulin dosage, which was higher in group 3 than in group 1 for eccentricity. There was also a significant difference in HbA1c values, which increased with eccentricity tercile and in those patients with an alpha coefficient >1.5. Tables 4 and 5 show the significant differences observed in patients grouped by alpha coefficient values and glucose eccentricity terciles.
Data are mean (SD).
Glycated hemoglobin at the start of the study.
Data are mean (SD).
Mean of glycated hemoglobin of the disease as a whole.
Group 1, eccentricity 12.56–16.98; group 2, eccentricity 16.99–21.91; group 3, eccentricity 21.92–41.03.
Discussion
According to the criteria set forth by the American Diabetes Association (ADA), 9 almost half of our sample presented very good metabolic control (under 7.5%) as measured by HbA1c. Likewise, the MAGE index in our series is clearly below that reported in other published studies of pediatric patients, 10 –12 indicating that our sample is probably “less varied.”
Certain studies have indicated that GV tends to increase throughout the progression of the disease along with HbA1c levels. 11 We did not observe this association when patients were grouped by conventional GV indices, perhaps due to the short evolution of the disease and the high level of metabolic control in our patients, along with the small sample size. Nevertheless, we did observe that HbA1c levels presented significant increases when patients were grouped according to time series analysis parameters (alpha coefficient and glucose eccentricity values). It is thus possible that this type of analysis provides information about glucoregulatory impairment at an earlier stage than conventional GV indices do.
To date, no published studies have dealt with glycemic DFA in pediatric patients. In our sample, the value of the alpha coefficient was 1.54, higher than that obtained by Crenier in adults with type 1 diabetes, although paradoxically, Crenier's subjects presented poorer metabolic control as measured by HbA1c and conventional GV indices. 4 Likewise, no data on the parameters of the Poincaré plot of glucose curves in children have been published and those from adult studies are not comparable due to the different time intervals used to construct the plot. 5 Although our sample provides data from only a small number of pediatric patients, it is the first study to do so.
In contrast to Churruca et al., 3 we observed no correlation between the alpha coefficient and the MAGE values; however, an association was found with the rest of the indices used to evaluate GV. The same was true for the eccentricity of the elliptic curve of the Poincaré plot. When patients were grouped by alpha coefficient values, we noted that those with worse glucose homeostasis levels (alpha coefficient >1.5) presented poorer metabolic control as measured by HbA1c along with higher GV values as estimated with conventional indices (glucose SD, range, CONGA) and by parameters associated with the elliptic curve of the Poincaré plot (SD2 and E). This indicates that poor treatment adherence may translate to less complexity in glycemic homeostasis, which, in turn, is accompanied by an increase in GV. The results were similar when subjects were grouped by glucose eccentricity terciles, with significant differences between the groups with the greatest and least amount of eccentricity, as determined by HbA1c, conventional GV indices, and alpha coefficient values. Furthermore, these same patients showed greater insulin resistance, indicated by the higher insulin doses needed to stabilize their condition.
The MAGE index, one of the most used indices in studies on GV, is not the index best associated with the time series parameters, nor were there any significant differences among patients grouped by these parameters. In fact, the SD of interstitial glucose levels was the index that showed the most homogenous behavior.
The main limitation of our study is its sample size, even though it encompassed almost the entire population of the study area (95% participation). Unfortunately, the small number of subjects did not allow for establishing comparisons between groups in different stages of puberty. Another limitation is that the CGM was not blinded, which may have conditioned the patients' decisions with regard to insulin dosage, eating habits, physical activity, and so on, although at the time of inclusion in the study, we insisted that treatment decisions should be based on the blood glucose levels obtained with the self-monitoring blood glucose meter.
Nonetheless, ours is the first study conducted on pediatric patients to offer data on the complexity of the glucoregulation system as determined with the aid of time series analysis of CGM curves. This type of mathematical analysis shows a good correlation with conventional GV indices; indeed, it may be able to provide information about glucoregulatory impairment in a more timely fashion.
Footnotes
Acknowledgments
The authors would like to thank Mrs. Rosa Ariño for her help in data collection, Dra. Carmen González for her help in data analyses, and Roche Diabetes Care for supplying the blood glucose meters.
Author Disclosure Statement
No competing financial interests exist.