
Abstract
Background:
We evaluated the effect of empagliflozin as adjunct to insulin on 24-h glucose exposure and variability in patients with type 1 diabetes.
Methods:
Patients (N = 75) with HbA1c ≥7.5% to ≤10.5% were randomized to receive empagliflozin 2.5 mg, empagliflozin 10 mg, empagliflozin 25 mg, or placebo once daily as adjunct to insulin for 4 weeks. Insulin dose was to be kept as stable as possible during week 1 of treatment and was freely adjustable thereafter. Markers of glucose exposure and variability were assessed from 7-day blinded continuous glucose monitoring intervals. This study is completed (
Results:
Empagliflozin reduced hourly mean glucose area under the median curve over 24 h versus placebo within week 1 (adjusted mean differences: −12.2 mg/dL·h [95% confidence interval −23.9 to −0.5], −30.2 mg/dL·h [−42.2 to −18.2], and −33.0 mg/dL·h [−44.8 to −21.1] with empagliflozin 2.5, 10, and 25 mg, respectively; all P < 0.05) and increased time in glucose target range (>70 to ≤180 mg/dL). Results were sustained to week 4 with empagliflozin 25 mg. All empagliflozin doses significantly reduced glucose variability (interquartile range and mean amplitude of glucose excursions) versus placebo at weeks 1 and 4. Except for small increases in hours per day with glucose ≤70 mg/dL during the stable insulin period, empagliflozin did not increase time in hypoglycemia compared with placebo.
Conclusions:
In patients with type 1 diabetes, empagliflozin as adjunct to insulin decreased glucose exposure and variability and increased time in glucose target range.
Introduction
E
Glucose variability in patients with type 1 diabetes is a predictor of hypoglycemia, 2 and has been linked to the development of microvascular complications in some studies. 3 –5 In prespecified analyses, we evaluated the effect of empagliflozin as adjunct to a basal/bolus insulin regimen on 24-h glucose exposure and variability using continuous glucose monitoring (CGM) in patients with type 1 diabetes from EASE-1.
Methods
Study design and participants
In this double-blind, placebo-controlled, parallel-group, randomized phase 2 study, patients were enrolled at one center in Germany and at another center in Austria. Inclusion and exclusion criteria have been described previously. 1 In brief, patients with type 1 diabetes were eligible for inclusion if they were aged ≥18 to ≤65 years with a body mass index (BMI) of 18.5–35.0 kg/m2, HbA1c of ≥7.5% to ≤10.5%, estimated glomerular filtration rate (eGFR, according to the Chronic Kidney Disease Epidemiology Collaboration formula) of ≥60 to ≤150 mL/min per 1.73 m2, and C-peptide <1.5 ng/mL at screening. Patients had to have received insulin for ≥12 months before screening and to have had multiple daily injections of insulin, consisting of basal insulin and ≥3 daily bolus injections. Total daily insulin requirement had to be ≤1.5 U/kg at screening, and the insulin administration algorithm had to have been stable for ≥12 weeks before screening.
The trial was registered with
Randomization and masking
After a 2-week, open-label placebo run-in, patients were randomized (1:1:1:1 ratio) to receive once daily empagliflozin 2.5 mg, empagliflozin 10 mg, empagliflozin 25 mg, or placebo as adjunct to insulin for 28 days (Figs. 1 and 2). Randomization was undertaken using a third-party interactive voice and web response system, and was stratified by site.
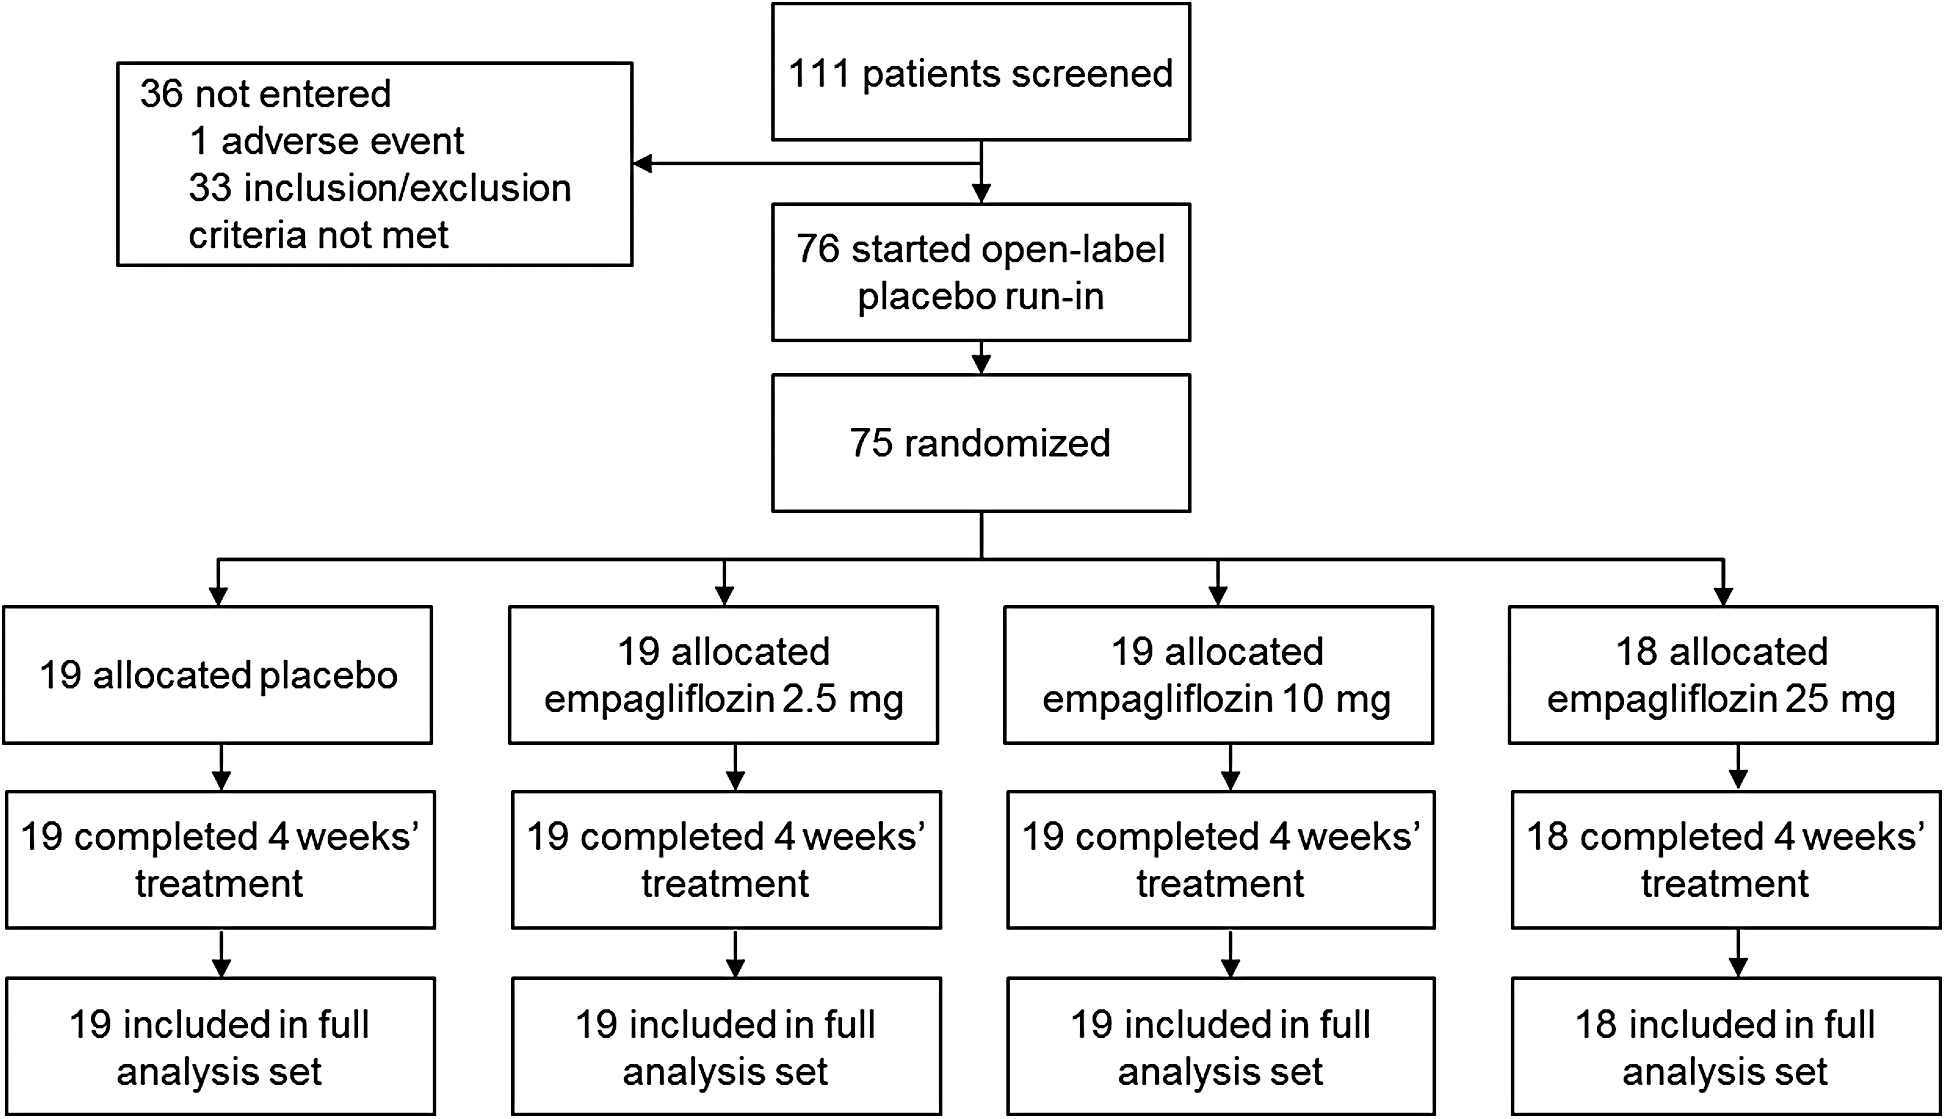
Trial profile.
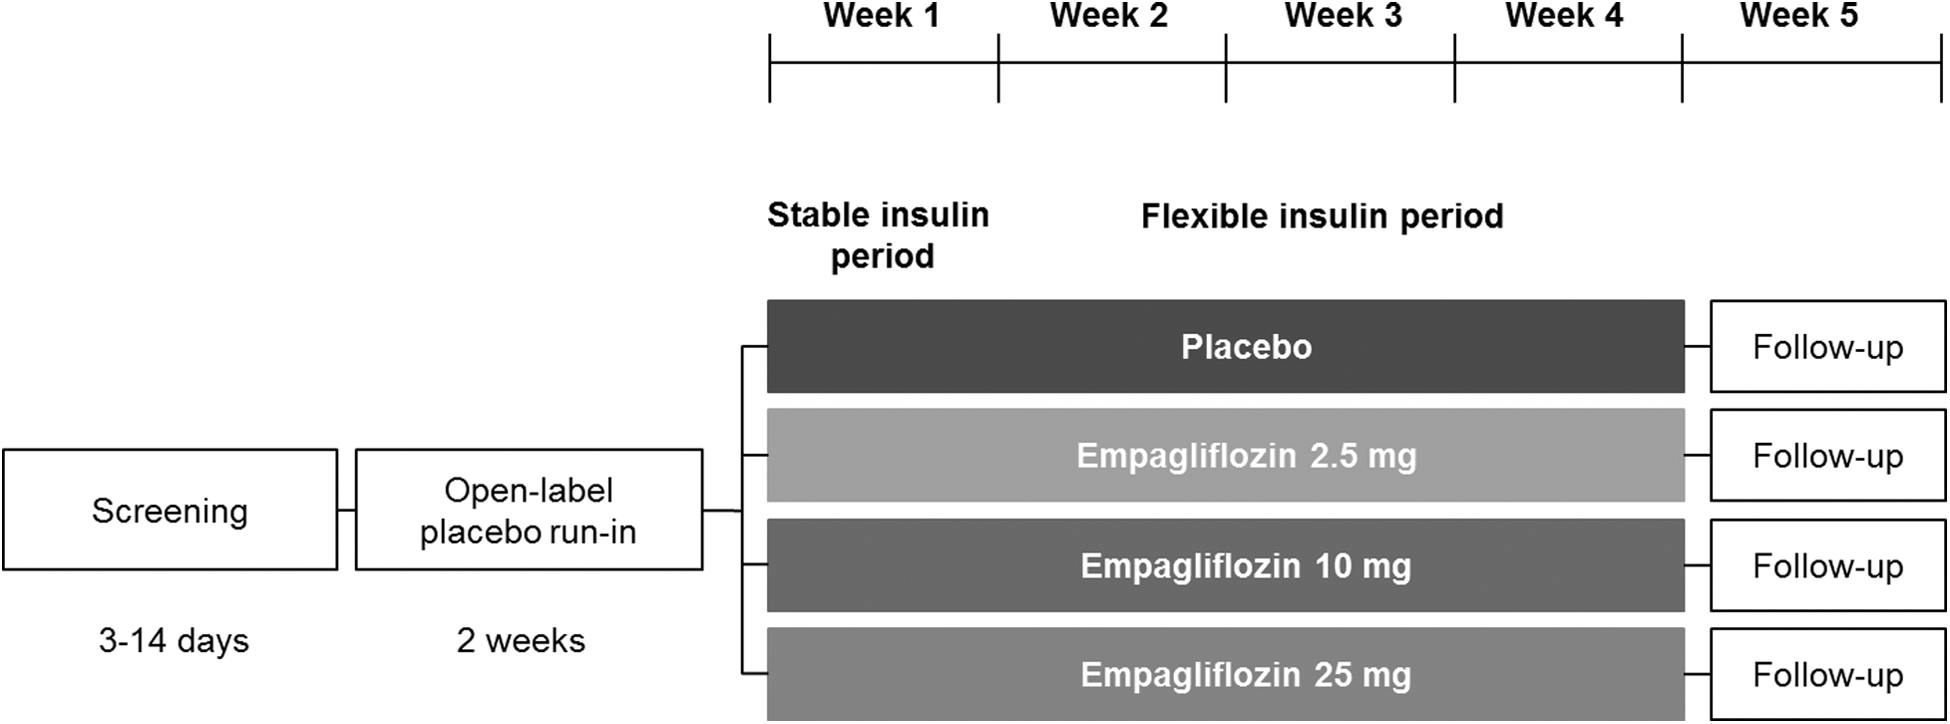
Study design. Stable insulin (inpatient) period: insulin regimen to be kept as stable as possible but could be adjusted for safety reasons if deemed necessary by the investigator. Flexible insulin (outpatient) period: insulin regimen freely adjustable according to the investigator's judgment to achieve optimal glycemic control.
The insulin regimen was to be kept stable (no change to basal insulin dose, insulin-to-carbohydrate ratio, or correction factor for bolus insulin) during the first week of treatment (stable insulin period), then was freely adjustable according to the investigator's judgment to achieve optimum glycemic control for the remaining 3 weeks of treatment (flexible insulin period). In cases of hypoglycemia during the stable insulin period, patients were to ingest carbohydrates; however, insulin could be adjusted for safety reasons at any time if deemed necessary by the investigator.
Patients were admitted to the study site from 2 days before drug administration to day 8 of drug administration. Patients were called by site personnel on day 9 to discuss insulin adjustments, and further telephone calls were agreed upon as needed. Patients returned for ambulatory visits on days 14, 21, and 27, and stayed at the study site overnight on day 28. Patients returned for a follow-up visit 7 days after the end of treatment.
Patients received diet and exercise counseling based on local recommendations at the start of the open-label placebo run-in period and were reminded to follow their usual diet and exercise plan at every study visit. All patients were instructed to keep their diet and daily carbohydrate intake as stable as possible throughout the trial. Patients were provided with a blood glucose and ketone self-monitoring device. Self-monitoring of blood glucose was performed before breakfast, lunch, dinner, and at bedtime, with additional tests as recommended by the investigator, or if a patient experienced signs or symptoms of hyper- or hypoglycemia. Patients were instructed to measure their blood ketone concentration if they experienced symptoms of ketoacidosis. Patients were asked to record their insulin dose, carbohydrate intake, blood glucose, and blood ketones in an electronic diary throughout the treatment and follow-up periods.
Blinded CGM
Blinded CGM was performed from the start of the placebo run-in (day -14) to the end of follow-up (week 5) using the Dexcom G4 CGM System (Dexcom, Inc., San Diego, CA), with a sensor change every 7 days. Seven-day ambulatory glucose profiles (AGP) were generated based on CGM data, which were collected over continuous 24-h periods (from 08:00 to 08:00). Data collected over 7 days were collapsed and plotted according to time (without regard to date) as if they occurred over 24 h, starting and ending at midnight, representing a modal day. Smoothed curves representing the median, interquartile range (IQR), and 10th and 90th frequency percentiles within hourly intervals define the 24-h AGP. Data acquisition, management, and transfer services were provided by SweetSpot Diabetes Care (Portland, OR). The CGM data were uploaded to SweetSpot in a blinded manner via a secure website. There was no visualization of glucose values for diabetes management purposes.
Outcomes
The exploratory primary endpoint of change from baseline in 24-h UGE on day 7 of treatment has been reported. 1 In this article, we present results for CGM endpoints. Glucose exposure measurements were changes from the baseline week to within weeks 1 and 4 of treatment in hourly mean area under the median glucose curve (AUC) over 24 h (AUC0–24), nocturnal (00:00–05:59) hourly mean glucose AUC, and hourly mean postprandial glucose AUC (0–4 h after a meal; AUC0–4h). Glucose variability measurements were changes from the baseline week to within weeks 1 and 4 of treatment in IQR of glucose and mean amplitude of glucose excursions (MAGE), and glucose measurement percentiles over time at week 4 of treatment (based on AGP). Endpoints related to time in glucose target range, hyperglycemia, and hypoglycemia were percentage of time with glucose >70 to ≤180 mg/dL, >180 mg/dL, and ≤70 mg/dL at baseline, week 1, and week 4 of treatment, change from baseline over 4 weeks of treatment in hours per day with glucose >70 to ≤180 mg/dL, and changes from the baseline week to within weeks 1 and 4 of treatment in hours per day with plasma glucose <54 mg/dL and hours per day with plasma glucose ≤70 mg/dL.
Statistical analyses
CGM analyses were based on observed cases. Missing data were not imputed. Changes from baseline in CGM endpoints were assessed using an analysis of covariance (ANCOVA) model, except for changes from baseline in postprandial glucose exposure, which were assessed using a mixed model repeated measures (MMRM) approach. ANCOVA models included the baseline of the endpoint in question as a linear covariate and treatment as a fixed effect. The MMRM assumed an unstructured covariance structure and included the baseline of the endpoint in question as a linear covariate, and treatment, visit, visit by treatment interaction, and baseline of the endpoint in question by treatment interaction as fixed effects. All statistical analyses were performed using the statistical package SAS (Version 9.2). Analyses were performed on the full analysis set, which included patients treated with ≥1 dose of study drug who had a 24-h UGE measurement at baseline, at day 1, and/or day 7 of treatment.
Role of the funding source
The sponsors of the study were involved in the study design, data collection, and data analysis. All authors had full access to the data and had final responsibility for the decision to submit for publication.
Results
Between November 25, 2013, and April 20, 2014, 75 patients were randomized and treated with placebo (n = 19), empagliflozin 2.5 mg (n = 19), empagliflozin 10 mg (n = 19), or empagliflozin 25 mg (n = 18), and comprised the full analysis set. No patients prematurely discontinued from the study. 1 Baseline characteristics were similar across treatment groups except for a higher mean BMI in the empagliflozin 10 mg group and different proportions of males and females in the empagliflozin 25 mg group (Table 1). 1
Data are n (%) or mean (SD).
CKD-EPI, Chronic Kidney Disease Epidemiology Collaboration formula; eGFR, estimated glomerular filtration rate; SD, standard deviation.
In each group, >94% of patients had 6 weeks of evaluable CGM data. The mean number of days per week with evaluable CGM data ranged from 5.7 to 6.6 in the placebo group, 5.7 to 6.7 in the empagliflozin 2.5 mg group, 5.5 to 6.7 in the empagliflozin 10 mg group, and 5.7 to 6.7 days in the empagliflozin 25 mg group. This translated to a mean coverage of >90% of the total observable time. All patients had evaluable (i.e., >1 evaluable 24-h interval within the week) CGM data within the baseline week, week 1, and week 4, except for one patient in the placebo group who did not have an evaluable 24-h interval within the baseline week.
Glucose exposure
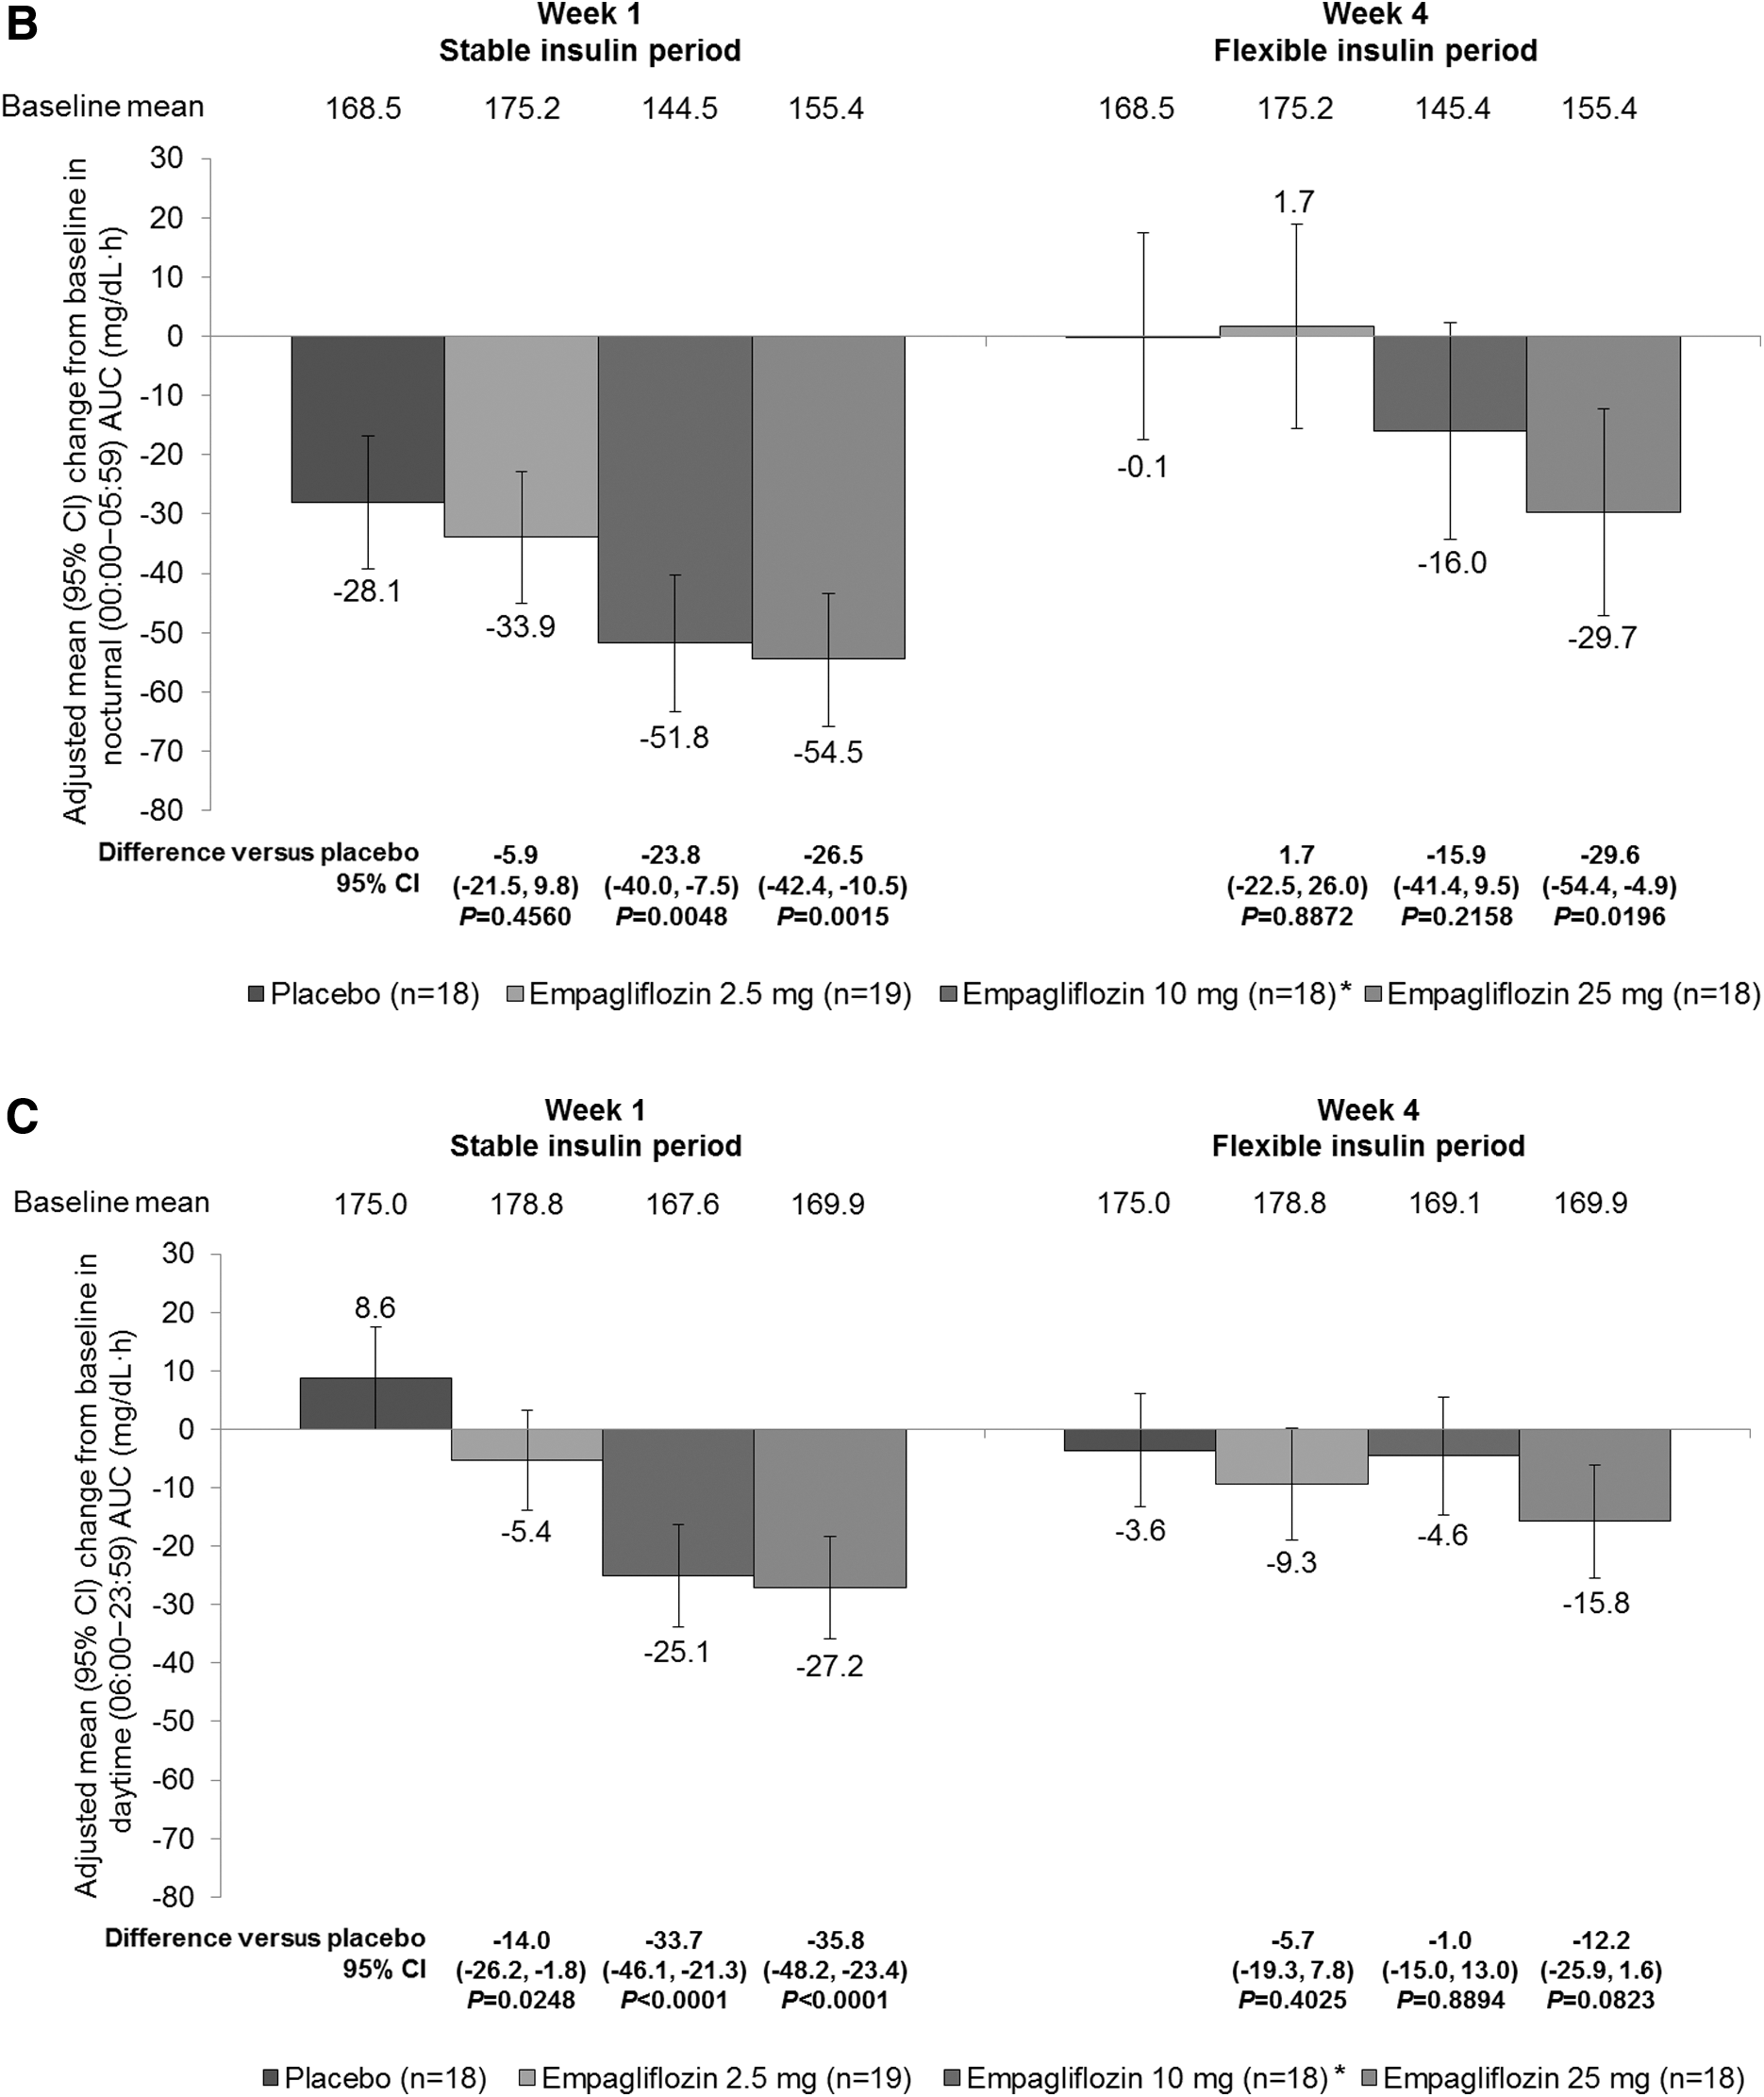
Empagliflozin led to significantly greater reductions from baseline in hourly mean glucose AUC0–24 compared with placebo at week 1 of treatment (Fig. 3A). Reductions from baseline with empagliflozin versus placebo at week 4 were smaller and only reached significance with empagliflozin 25 mg (Fig. 3A). A similar trend was observed for nocturnal hourly mean glucose AUC, but reductions from baseline with empagliflozin 2.5 mg at week 1 did not reach significance compared with placebo. Reductions from baseline in hourly mean glucose AUC with empagliflozin were generally more pronounced during nocturnal hours (0:00–05:59) than during daytime hours (Fig. 3B, C).
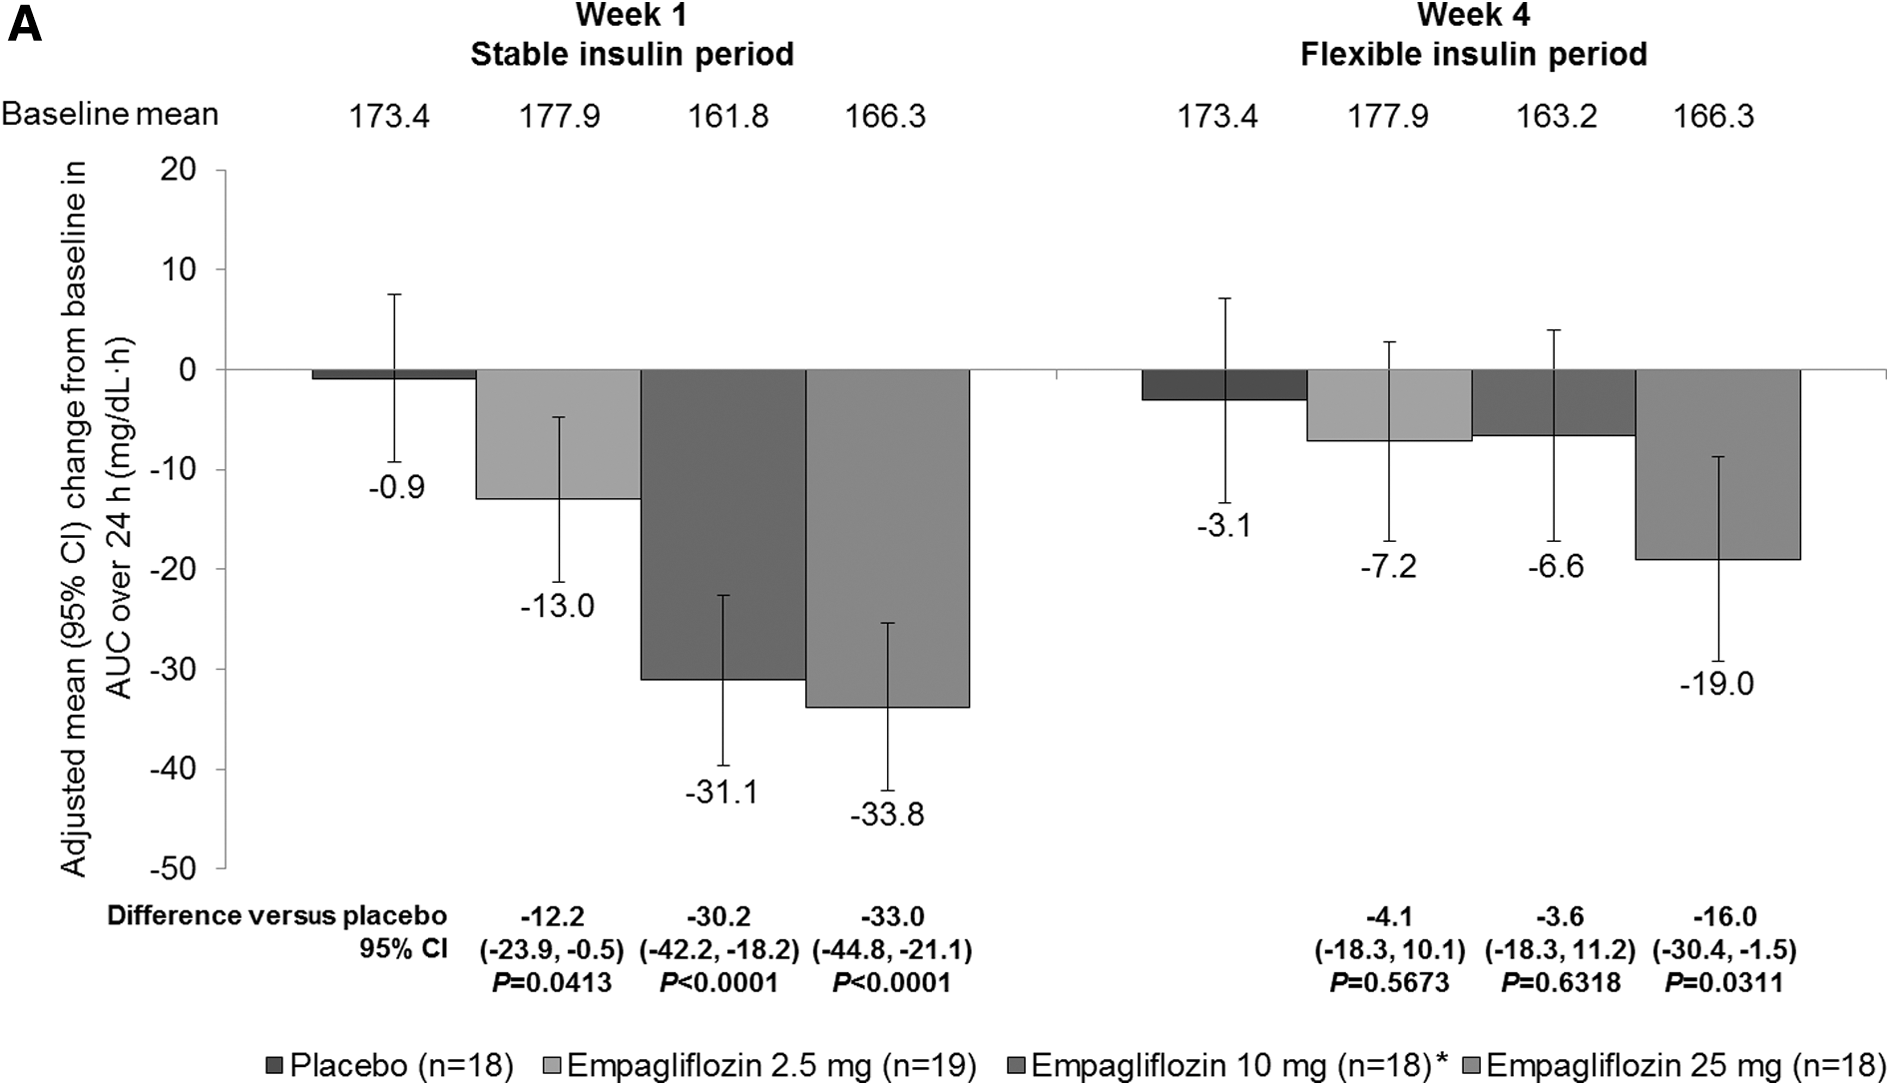
Changes in glucose exposure in the full analysis set. Error bars show 95% CIs.
Glucose variability
Empagliflozin reduced the IQR of glucose and MAGE at weeks 1 and 4, with smaller reductions at week 4 compared with week 1 (Fig. 4A, B). Differences compared with placebo in changes from baseline reached significance at both weeks (Fig. 4A, B). Smoothed glucose measurement percentiles over 24 h were similar across treatment groups at baseline (Supplementary Fig. S1A; Supplementary Data are available online at

Glucose variability in the full analysis set. Error bars show 95% CIs.

Time in glucose in target range, hyperglycemia, and hypoglycemia
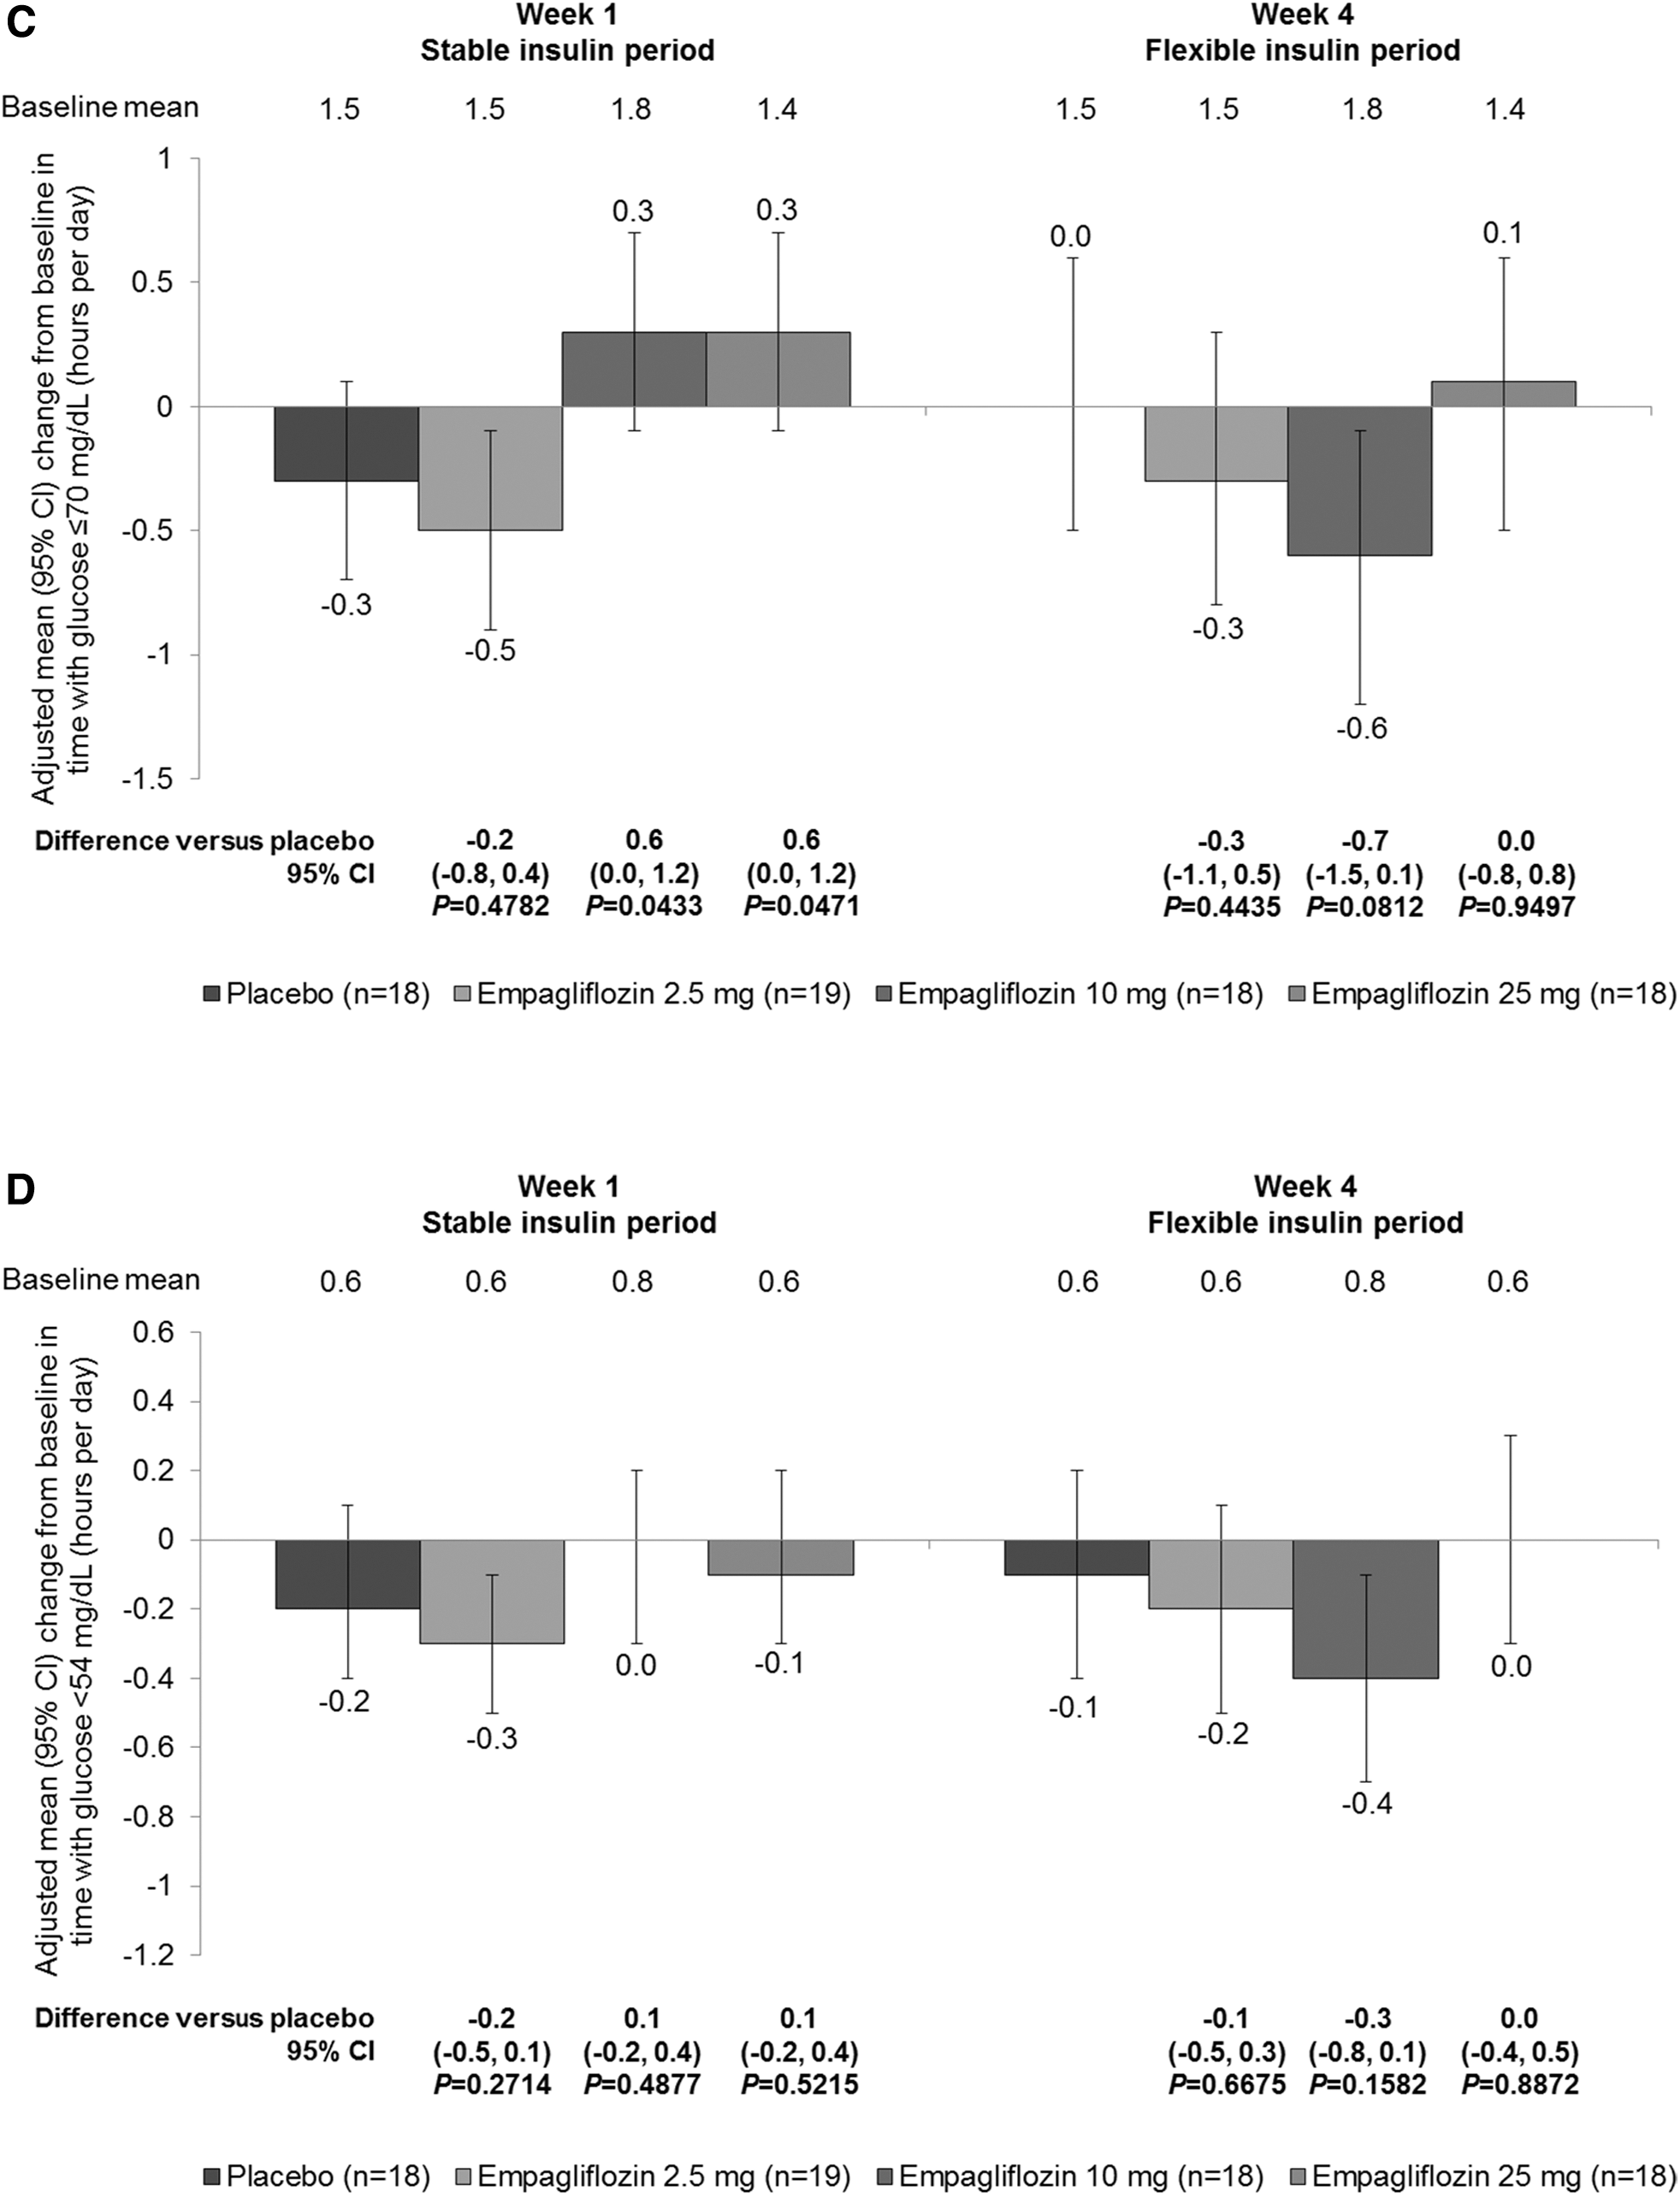
Empagliflozin increased the percentage of time spent in the glucose target range (>70 to ≤180 mg/dL) and reduced the percentage of time spent in hyperglycemia (≥180 mg/dL) from baseline to weeks 1 and 4, compared with no change in the placebo group (Fig. 5A). Time (hours per day) in glucose target range was significantly increased from baseline with all doses of empagliflozin compared with placebo within week 1, but increases from baseline only reached significance with empagliflozin 25 mg compared with placebo within week 4 (Supplementary Table S1). Time spent in hyperglycemia was significantly reduced from baseline with all doses of empagliflozin compared with placebo within week 1, but reductions from baseline only reached significance with empagliflozin 25 mg compared with placebo within week 4 (Supplementary Table S1). Increases in hours per day in glucose target range (>70 to ≤180 mg/dL) were greater during the stable insulin period than during the flexible insulin period (Fig. 5B). Except for a small increase with empagliflozin 10 mg and 25 mg at week 1 in time over 24 h with glucose ≤70 mg/dL, there were no significant differences in changes in time spent in hypoglycemia (glucose ≤70 or <54 mg/dL) between empagliflozin and placebo groups at weeks 1 or 4 over 24 h (Fig. 5A, C, D) or during nocturnal hours (Supplementary Table S2).
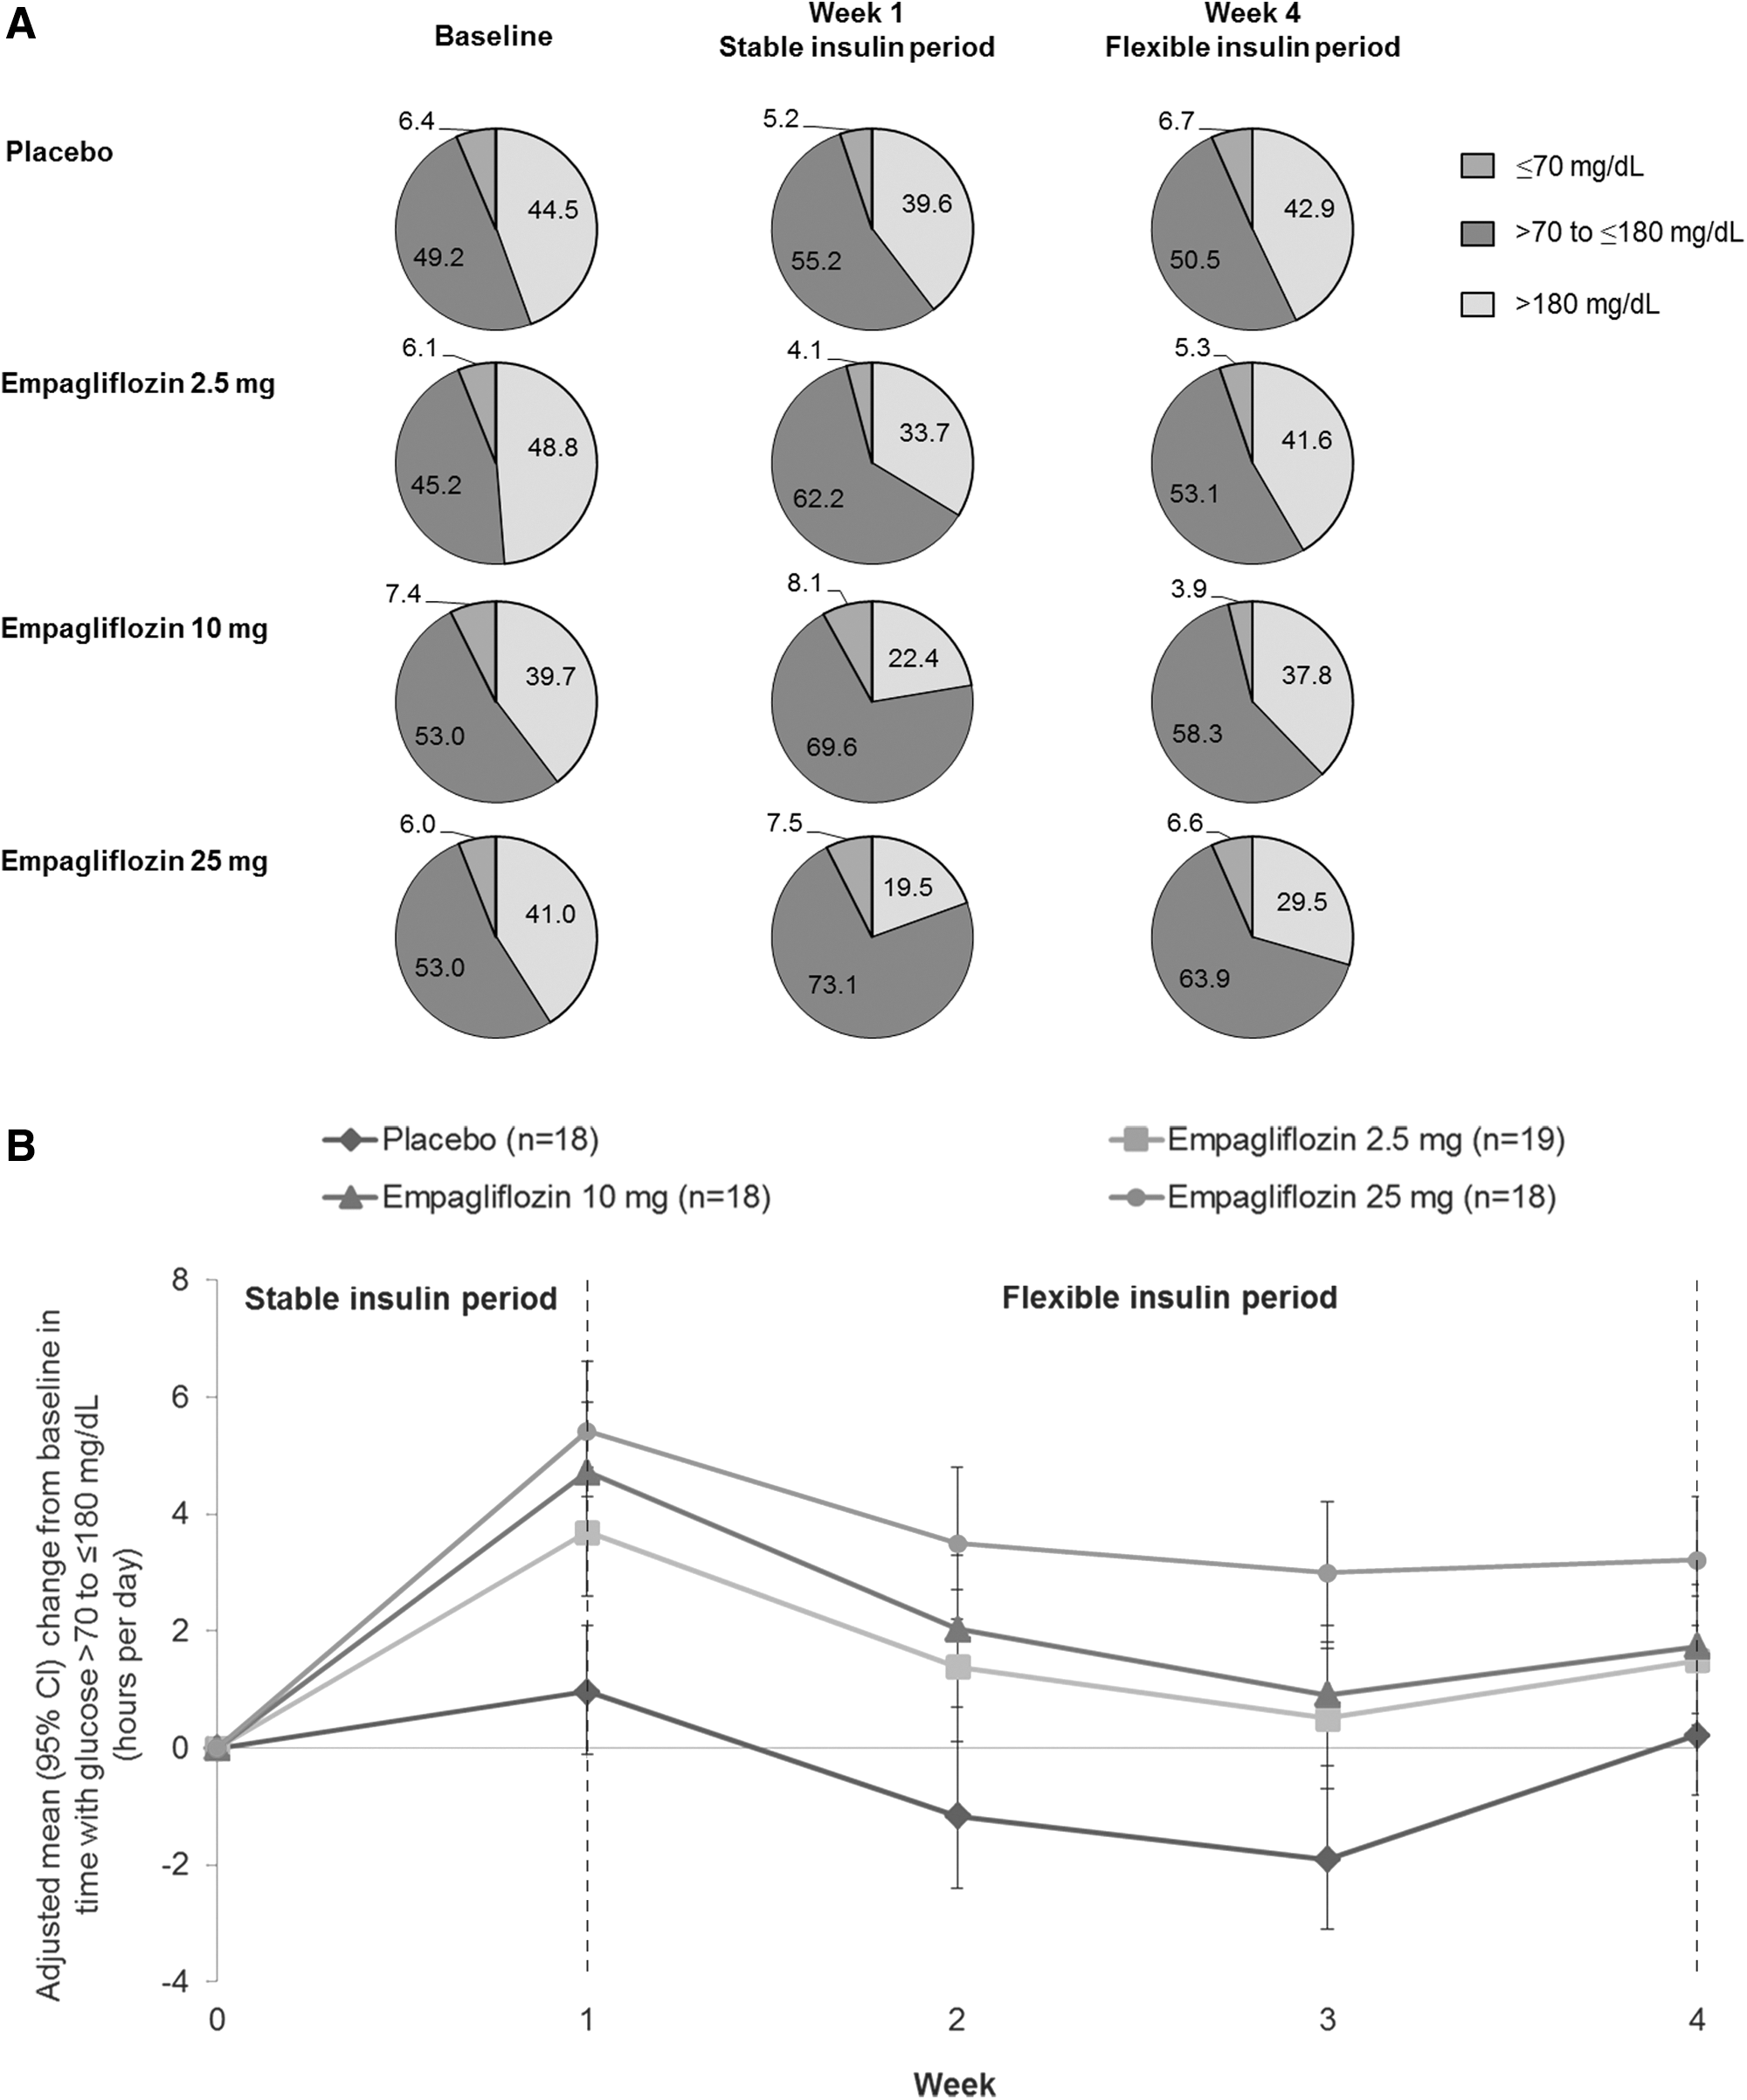
Glucose in target range, hyperglycemia, and hypoglycemia in the full analysis set. Error bars show 95% CIs.
Postprandial glucose exposure
Within week 1, all empagliflozin doses reduced glucose AUC0–4h (postprandial exposure) from baseline after each meal except for a small increase from baseline with empagliflozin 2.5 mg after dinner, and glucose AUC0–4h was increased from baseline with placebo (Supplementary Table S3). Reductions from baseline were significant with empagliflozin compared with placebo after each meal and changes were less marked with empagliflozin 2.5 mg than with other doses. Within week 4, all empagliflozin doses reduced glucose AUC0–4h (postprandial exposure) from baseline after each meal except for a small increase from baseline with empagliflozin 10 mg after lunch (Supplementary Table S3). In the placebo group, glucose AUC0–4h was increased from baseline after breakfast but decreased from baseline after lunch and dinner. Compared with placebo, all empagliflozin doses increased glucose AUC0–4h after lunch but reduced glucose AUC0–4h after breakfast and after dinner, AUC0–4h was reduced with empagliflozin 25 mg but increased with other doses; however, differences versus placebo did not reach significance (Supplementary Table S3).
Discussion
Using CGM, we evaluated the effect of empagliflozin as adjunct to a basal/bolus insulin regimen on 24-h glucose exposure and variability in patients with type 1 diabetes from EASE-1. Our results show that empagliflozin 2.5, 10, and 25 mg as adjunct to insulin therapy decreased total glucose exposure and glucose variability compared with placebo over 4 weeks in patients with type 1 diabetes.
The use of CGM in this study afforded a unique opportunity to explore diurnal glucose patterns. The improvement in glycemic control with empagliflozin appeared to be due to reductions in nocturnal glycemia, when patients were primarily asleep and fasted and when the effect of basal rather than prandial insulin was dominant. This is in line with studies that demonstrate substantial reductions in fasting plasma glucose with empagliflozin in patients with type 2 diabetes 6 –9 and with other SGLT2 inhibitors in patients with type 1 or type 2 diabetes. 10 –15 The lower glucose exposure observed with the highest empagliflozin dose at week 4 is anticipated to translate into substantial long-term HbA1c reductions; however, this will require confirmation from longer clinical trials of empagliflozin in patients with type 1 diabetes.
A key finding is that all empagliflozin doses significantly reduced glucose variability, as measured by IQR of glucose and MAGE, compared with placebo at weeks 1 and 4. This was particularly pronounced during nocturnal and early morning hours (02:00–08:00). All doses of empagliflozin increased time spent in the glucose target range compared with placebo. This may explain the overall reductions in HbA1c with empagliflozin observed in this trial. 1 The time spent in hypoglycemia as measured by CGM was not increased. This is consistent with the reported rates of moderate hypoglycemic adverse events (symptomatic hypoglycemia with plasma glucose <54 mg/dL, not requiring assistance), which were generally lower with empagliflozin than with placebo, and that no hypoglycemic episodes requiring assistance occurred with empagliflozin. 1
Changes in glucose parameters with empagliflozin were smaller at week 4 than at week 1. This might be related to the effects of the concomitant decrease in total insulin dose of 12%–14% within week 4. 1 In addition, food intake and lifestyle may have been more variable during the outpatient period. Assessment of glycemic status during the first days of treatment with an SGLT2 inhibitor may be warranted by patients or care providers to adjust the insulin regimen based on individual requirements.
Comparable patterns of reduced nocturnal glycemia and improved glycemic variability were reported with empagliflozin in an 8-week single-arm, open-label, pilot study in patients with type 1 diabetes and, consistent with the results of our trial, the trend toward improvement in glycemic exposure was primarily explained by reductions observed during nocturnal hours. 16 In a study evaluating the dual SGLT1 and SGLT2 inhibitor sotagliflozin for 29 days in 33 patients with type 1 diabetes, sotagliflozin as an adjunctive treatment to insulin demonstrated improvements in measures of glycemic variability, including glucose standard deviation, IQR, and MAGE, based on 24-h CGM, and patients in the sotagliflozin group spent a greater percentage of time in the target glycemic range (70–180 mg/dL) compared with placebo. 17 In addition, CGM parameters in a 2-week trial of the SGLT2 inhibitor dapagliflozin in 70 patients with type 1 diabetes showed a trend toward improved glucose variability in the high-dose arms. 18
Within week 1, all empagliflozin doses reduced postprandial exposure compared with placebo after each meal, although differences did not reach significance with empagliflozin 2.5 mg after breakfast or with any dose after lunch. Within week 4, all empagliflozin doses reduced glucose exposure compared with placebo after breakfast, but all doses increased glucose exposure after lunch and empagliflozin 2.5 mg and empagliflozin 10 mg increased glucose exposure after dinner, although no differences reached significance. This may have been related to the (bolus) insulin reductions at week 4. In addition, there was a substantial reduction in glucose exposure in the placebo group after lunch at week 4, which may have contributed to the observed increases with empagliflozin compared with placebo. The reason for this substantial reduction in the placebo group is not known. It should also be noted that there was a slight imbalance in mean postprandial exposure between the groups at baseline and that there were fewer patients with evaluable postbreakfast data at week 4 than at other times, owing to scheduled sensor exchange.
Patients with type 1 diabetes are at risk of diabetic ketoacidosis, 19 and this risk may be increased if insulin dose is reduced inappropriately. There is some concern that diabetic ketoacidosis risk may be increased with the use of SGLT2 inhibitors, 20 but no adverse events of diabetic ketoacidosis were reported in this study. 1 High fasting beta-hydroxybutyrate levels were observed in one patient on empagliflozin 2.5 mg and one patient on empagliflozin 25 mg during routine safety laboratory monitoring at week 4, 1 but these patients were asymptomatic. At baseline, these patients had elevated pretreatment β-hydroxybutyrate levels of 1.1 and 0.4 mmol/L, respectively, and at week 4, total daily insulin doses had been reduced by 51% and 31% in these patients, respectively. 1
The benefit of CGM is that it allows the characterization of diurnal and nocturnal glucose exposure. CGM coverage in this study was thorough considering the time needed for sensor changes and calibration; >90% of the total observation time was covered by CGM. Limitations of CGM are that blood glucose readings may be less sensitive in the hypoglycemic range 21 and that measurements taken from interstitial fluid do not reflect the actual glucose concentrations in capillary blood. Despite this, CGM devices accurately record the trend in patient glucose exposure 22 and the CGM results in this trial were consistent with patient-reported data on hypoglycemic adverse events and mean daily glucose. 1
In conclusion, CGM data show that empagliflozin 2.5, 10, and 25 mg as adjunct to multiple daily injections of insulin decreased total glucose exposure and nocturnal glucose exposure compared with placebo over 4 weeks in patients with type 1 diabetes. Empagliflozin significantly reduced glucose variability and increased time spent in the glucose target range without increasing time spent in hypoglycemia.
Footnotes
Acknowledgments
This study was sponsored by the Boehringer Ingelheim & Eli Lilly and Company Diabetes Alliance. Medical writing assistance, supported financially by Boehringer Ingelheim, was provided by Melanie Stephens of Fleishman-Hillard Group Ltd., during the preparation of this article. The authors were fully responsible for all content and editorial decisions, were involved at all stages of manuscript development, and have approved the final version.
Authors' Contributions
S.F. and T.R.P. contributed to the acquisition and interpretation of data and writing of the manuscript. J.E., D.N., N.S., H.J.W., U.C.B., and S.K. contributed to the study design, interpretation of data, and writing of the manuscript. T.R.P. is the guarantor of this work and, as such, had full access to all the data in the study and takes responsibility for the integrity of the data and the accuracy of the data analysis.
Author Disclosure Statement
J.E., D.N., N.S., H.J.W., U.C.B., and S.K. are employees of Boehringer Ingelheim. S.F. declares that no competing financial interests exist. T.R.P. has served on advisory boards or received speaker honoraria from Novo Nordisk, Eli Lilly, AstraZeneca, Roche Diagnostics, and Bristol Meyer Squibb.
References
Supplementary Material
Please find the following supplemental material available below.
For Open Access articles published under a Creative Commons License, all supplemental material carries the same license as the article it is associated with.
For non-Open Access articles published, all supplemental material carries a non-exclusive license, and permission requests for re-use of supplemental material or any part of supplemental material shall be sent directly to the copyright owner as specified in the copyright notice associated with the article.