




Abstract
Background:
Stress-induced hyperglycemia is a common feature of intensive care unit (ICU) patients. Besides mean blood glucose (BG) level, glucose variability and hypoglycemia have been highlighted as independent predictors of ICU and hospital mortality. Recent ICU recommendations suggest using insulin infusion protocols that can minimize glucose variability and hypoglycemic risk. Our aim was to assess the efficacy, safety, and acceptance by nurses of a paper-based simple dynamic insulin protocol compared with those by nurses of a paper-based static protocol.
Methods:
This is a 1 year stepped-wedge study that compared a static sliding scale protocol (SP - static protocol) with a validated dynamic paper-based intravenous insulin infusion protocol (DP - dynamic protocol) in medical ICU patients of a single university hospital. Patients with stress-induced hyperglycemia >9.9 mmol/L and ≥48 h intravenous insulin infusion were included in this trial.
Results:
One hundred thirty-one patients were included and received continuous intravenous insulin infusion managed with SP (n = 65) or DP (n = 66). Glucose variability was significantly higher in the SP group than in the DP group (mean average glucose excursion index: 0.90 [0.00–1.91] mmol/L vs. 0.00 [0.00–0.90] mmol/L, respectively; P = 0.001). The percentage of time spent in the target range (7.7–9.9 mmol/L) was lower in the SP group than in the DP group (42.5% [28.8%–54.2%] vs. 47.5% [36.6%–57.1%]; P = 0.037). Low BG (<4.4 mmol/L) and hypoglycemia (<3.3 mmol/L) were more frequent in the SP group than in the DP group. According to a satisfaction survey, this protocol was well accepted by nurses.
Conclusions:
Our simple and feasible paper-based, dynamic insulin infusion protocol reduced glycemic variability and hypoglycemic risk in a medical ICU.
Introduction
I
In addition to the mean BG level, glucose variability has recently been emphasized as an independent predictor of ICU and hospital mortality. 7 This concept has been described in a wide variety of medical, surgical, and trauma ICU patients, especially in patients without previously known diabetes. 7 –9 Notably, all of these data have been observational, and interventional trials remain lacking to assess the impact of glycemic variability (GV) reduction on ICU mortality and thus to demonstrate causality. However, GV was considered sufficiently important to be mentioned in recent international guidelines for the management of hyperglycemia in critically ill patients. 10,11 In these publications, beside avoidance of hyperglycemia, experts emphasized the importance of minimizing hypoglycemia and GV.
To achieve these goals, computer-based insulin infusion protocols have demonstrated their superiority to paper-based protocols. 12,13 Glucose concentrations, variation per unit of time between the last and current glucose measurements, insulin dosage, and carbohydrate intake were the main input variables used in these different computerized algorithms. However, such protocols are not widely available because commercial systems have licensing fees and academic protocols do not always go beyond the pilot phase. 14
To improve glucose metrics in ICU patients, especially to reduce glucose variability and hypoglycemia exposure, using a simple tool, we adapted a previously validated, paper-based, dynamic protocol (DP) to an actual recommended glycemic target range. Our aim was to assess the efficacy, safety, feasibility, and acceptance by nurses of this dynamic insulin protocol compared with a paper-based sliding scale static protocol (SP).
Materials and Methods
Study design
This prospective trial involved adult patients who were admitted to the medical intensive care department of a French university hospital to compare the effects of two continuous intravenous insulin infusion (CIII) protocols on GV and hypoglycemia. According to the local protocol, patients with two consecutive capillary blood glucose (CBG) measurements greater than 180 mg/dL (9.9 mmol/L), 1 h apart, were considered to require CIII and were included in the trial. All of the patients or their family members received written information about the trial. The protocol was approved by the local ethics committee (CPP NO3–N°A13-D17-VOL.16). Patients who received CIII for less than 48 h, who were admitted for an acute metabolic event (ketoacidosis or hyperosmolarity), or who received insulin/dextrose infusion for hyperkalemia treatment were not included.
The inclusion period ranged from February 1, 2013 to January 31, 2014. During this period, units A and B were randomly assigned to manage CIII with the usual static insulin infusion protocol from February 1, 2013 to May 30, 2013/September 30, 2013 and with the new dynamic insulin infusion protocol from June 1, 2013/October 1, 2013 to January 31, 2014, respectively (Fig. 1).
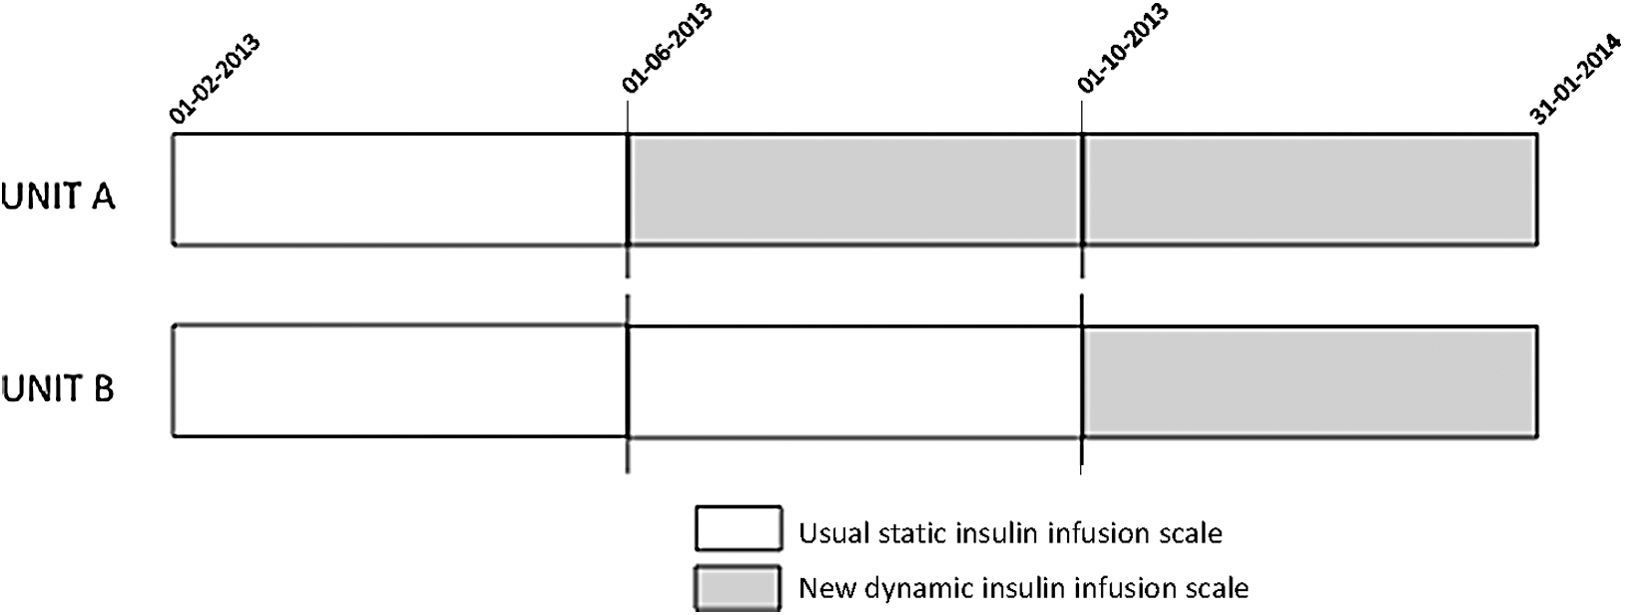
Stepped wedge design of the trial indicating the periods of use of the CIII protocols in the two units
The primary objective was to evaluate the effect of the new dynamic insulin infusion protocol compared with the usual static insulin infusion protocol, on GV evaluated by the MAGE (mean average glucose excursion) index. Given the study was conducted as a part of improving our practice, we did not calculate a sample size to test our hypothesis.
Insulin protocols
A CIII DP was compared with a SP. Aspart insulin (NovoNordisk, Copenhagen, Denmark) was used in both the DP and SP groups.
The DP was a new paper-based, dynamic, sliding scale insulin protocol, designed for this trial and adapted from the validated Yale protocol,
15
with a customized BG target (140–180 mg/dL to 7.7–9.9 mmol/L) following French national guidelines.
10
In this protocol, CBG was measured hourly to adapt the insulin infusion rate according to three parameters: current CBG value, delta from the previous CBG value, and current insulin infusion rate (Supplementary Fig. S1; Supplementary Data are available at
The SP was the local, historical, paper-based, static, sliding scale insulin protocol: CBG was measured every 2 h to adapt the insulin infusion rate according to the sole current CBG value (Supplementary Fig. S2).
Data collection
CBG was measured with calibrated Accu-chek Performa glucometers (Roche Diagnostics, Grenoble, France). CBG and insulin infusion rates were prospectively collected, as were quantitative (calorie) and qualitative (carbohydrates) intake data about enteral or parenteral nutrition. This data collection was discontinued on day 5 after admission or earlier at discharge from the ICU. The simplified acute physiology score II was calculated at baseline. 16 The Sepsis-related organ failure assessment (SOFA) score was calculated at baseline and on day 5 after admission, and the evolution of this score was expressed as the outcome of SOFA score at day 5 or at ICU discharge minus SOFA score at baseline. 17
Other clinical data, such as hospital-acquired infections (especially ventilator-associated pneumonia, catheter-related infections, and urinary infections), were collected retrospectively from medical records.
Glucose metrics
The GV indices were calculated using Hill's EasyGV®. 18
Our primary endpoint was the MAGE index:
where Δ is amplitude of glycemic excursion, SD is standard deviation of glycemia, and n is number of glycemic excursions. The MAGE index was also calculated daily.
Our secondary endpoints were the other GV indices classified as time dependent:
where MAG is the mean absolute glucose change, ΔBG is difference between two consecutive blood glucose measurements, and Δt is duration of BG observation.
where LI is the lability index, BG is blood glucose measurement, and h is time or time independent.
where SD is standard deviation of glycemia, xi
is blood glucose,
where CV is coefficient of variation of glycemia, SD is standard deviation of glycemia, and
where LBGI is low BG index, rl(BG) = r(BG) if BG <6.25 mmol/L and 0 otherwise,
BG is blood glucose.
where HBGI is high BG index, rh(BG) = r(BG) if BG >6.25 mmol/L and 0 otherwise,
where BG is blood glucose.
where GRADE is the glycemic risk assessment diabetes equation and BG is blood glucose (mmol/L).
where BGi is BG measurement (mmol/L), BGmax is maximal BG, BGmin is minimal BG, k is number of glucose measurements, and IGV is ideal glycemic value of 160 mg/dL (8.8 mmol/L).
We also analyzed the mean BG (mmol/L), time spent in the target range (140–180 mg/dL to 7.7–9.9 mmol/L) (%), time spent at greater and less than the target range (%), and time before the first glucose value in the target range (h). Low BG episodes (<80–4.4 mmol/L), hypoglycemia (<60 mg/dL–3.3 mmol/L), and severe hypoglycemia (<40 mg/dL–2.2 mmol/L) were expressed as number of episodes per patient (entire cohort), percentage of patients with at least one episode and number of episodes per patient who experienced at least one episode.
Feasibility
To assess the feasibility of the DP compared with the SP, 20 sets of CBG data were randomly and retrospectively reviewed to assess the consistency of insulin rate adaptation to the protocol. In addition, a satisfaction survey was submitted to ICU nurses to collect their opinions about the convenience and accuracy of each protocol (Supplementary Fig. S3).
Statistical analysis
Quantitative data are expressed as the mean ± SD or median [interquartile range] for normally and not normally distributed values. Qualitative data are expressed as the number and percentage of patients. A subanalysis was also performed to compare the effect of SP and DP in the two subpopulations of patients with or without previous known diabetes. We performed comparisons between the groups using parametric or nonparametric tests when appropriate, with P < 0.05 considered significant for all of the analyses. SAS software, version 12.0 (SAS Institute, Inc., Cary, NC), was used to perform the statistical analysis.
Results
During the inclusion period, 724 patients were admitted to the medical intensive care department (Fig. 2). Among these patients, 587 had normal BG or received CIII for less than 48 h, but 137 (18.9%) received CIII for 48 h or more. Secondarily, six patients were excluded because they received insulin/dextrose infusion for hyperkalemia treatment (n = 4) or were hospitalized for hyperosmolarity (n = 2). Finally, 131 patients were included and received CIII management with the SP (n = 65) or the DP (n = 66). CBG profiles were analyzed for all of these patients, but three patients from the SP group were excluded from the morbidity–mortality analysis because the protocol switch occurred during their hospitalization (i.e., these three patients received CIII according to the SP for at least the first 5 days of hospitalization but according to the DP later during their hospital stays).
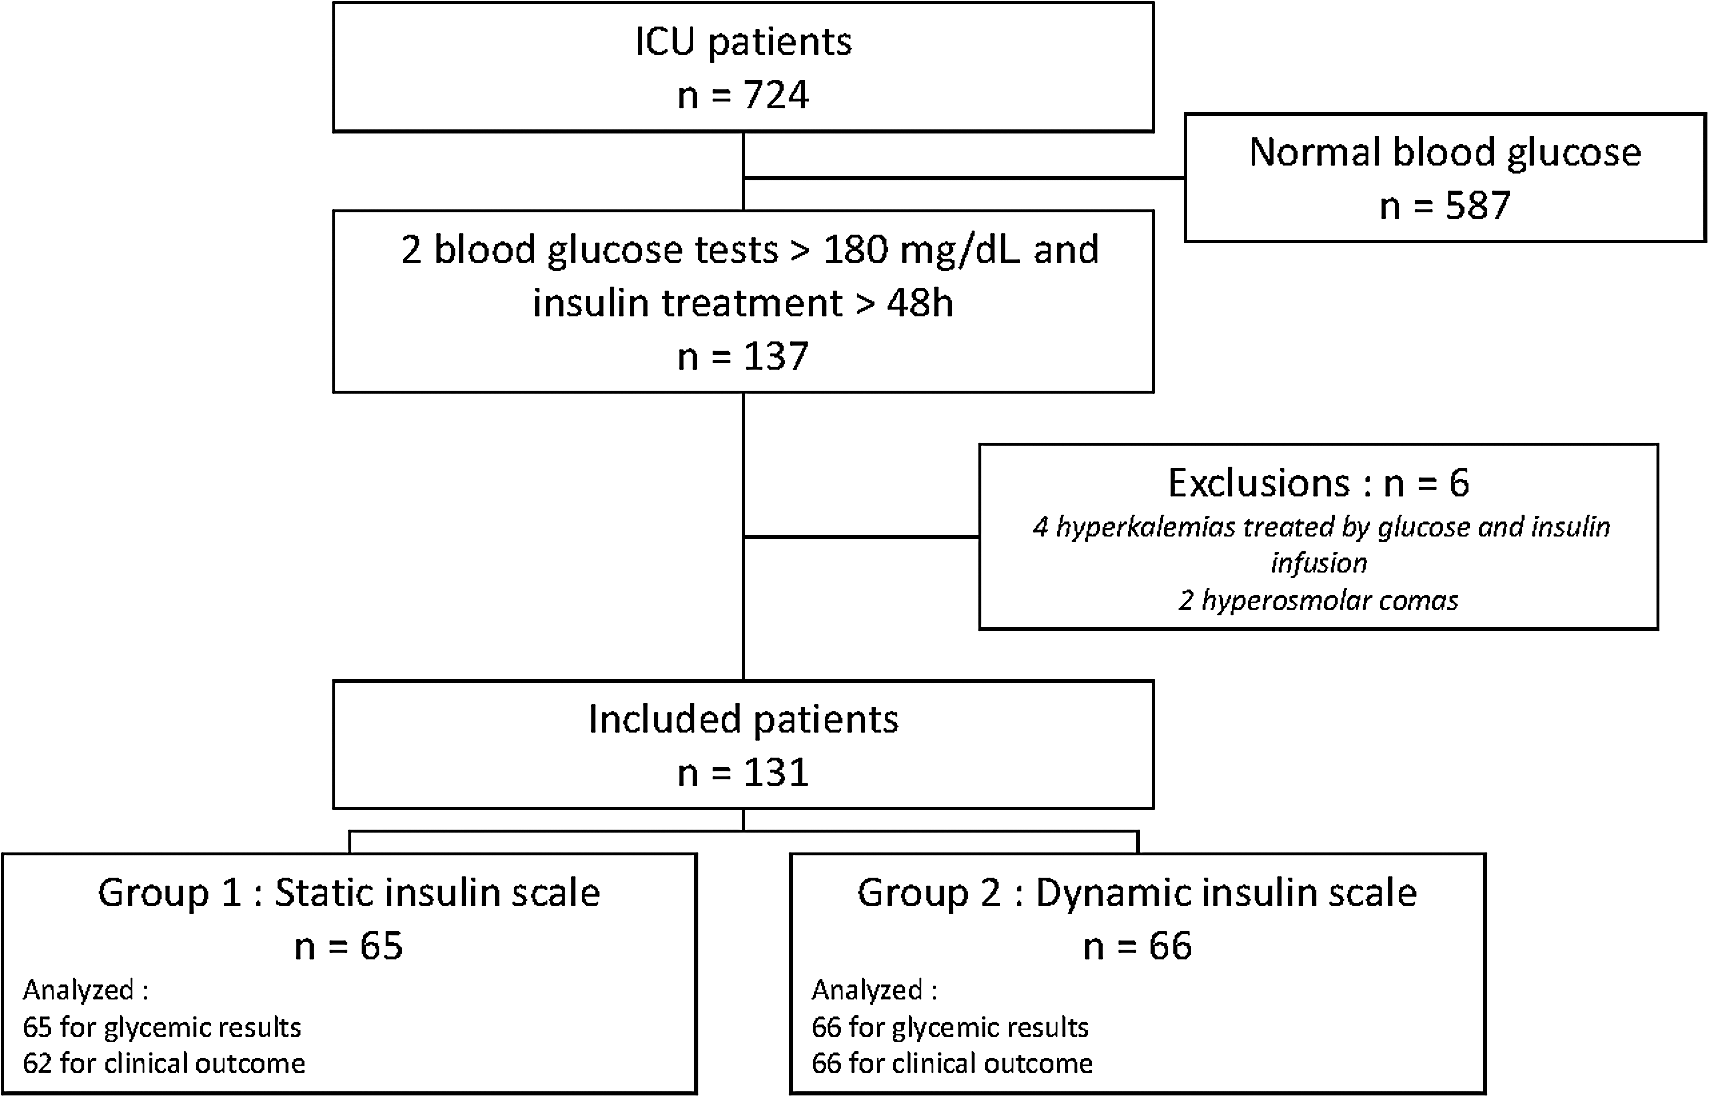
Flow chart of the study. ICU, intensive care unit.
The baseline characteristics of the patients were not different between the SP and DP groups except for glucocorticoid treatment, which was less frequently used in the SP group than in the DP group (Table 1). Notably, age, body mass index, previous diabetes status and insulin treatment, severity score, artificial ventilation, artificial nutrition, and carbohydrate/caloric intake were similar between the SP and DP groups (Table 1). CBG per day was performed at 11.7 ± 0.8 and 12.9 ± 1.9 in the SP and DP groups, respectively (P < 0.0001), whereas the recommendations were 12 and 24 per day, respectively.
Data are the mean ± SD (if not otherwise specified).
BMI, body mass index; ICU, intensive care unit; SAPSII, simplified acute physiology score II; SD, standard deviation; SOFA, Sepsis-related organ failure assessment.
The overall results are presented in Table 2. Our primary endpoint, the MAGE index, was significantly higher in the SP group than in the DP group. Other time-dependent GV indices were also significantly higher in the SP group than in the DP group. Daily MAGE demonstrated lower values for the DP group beginning on day 1 (P < 0.05) (Fig. 3). Among time-independent GV indices, the SDs were similar between the groups, but LBGI and M-VALUE were higher in the SP group than in the DP group, whereas the opposite was observed for HBGI and GRADE (Table 2).
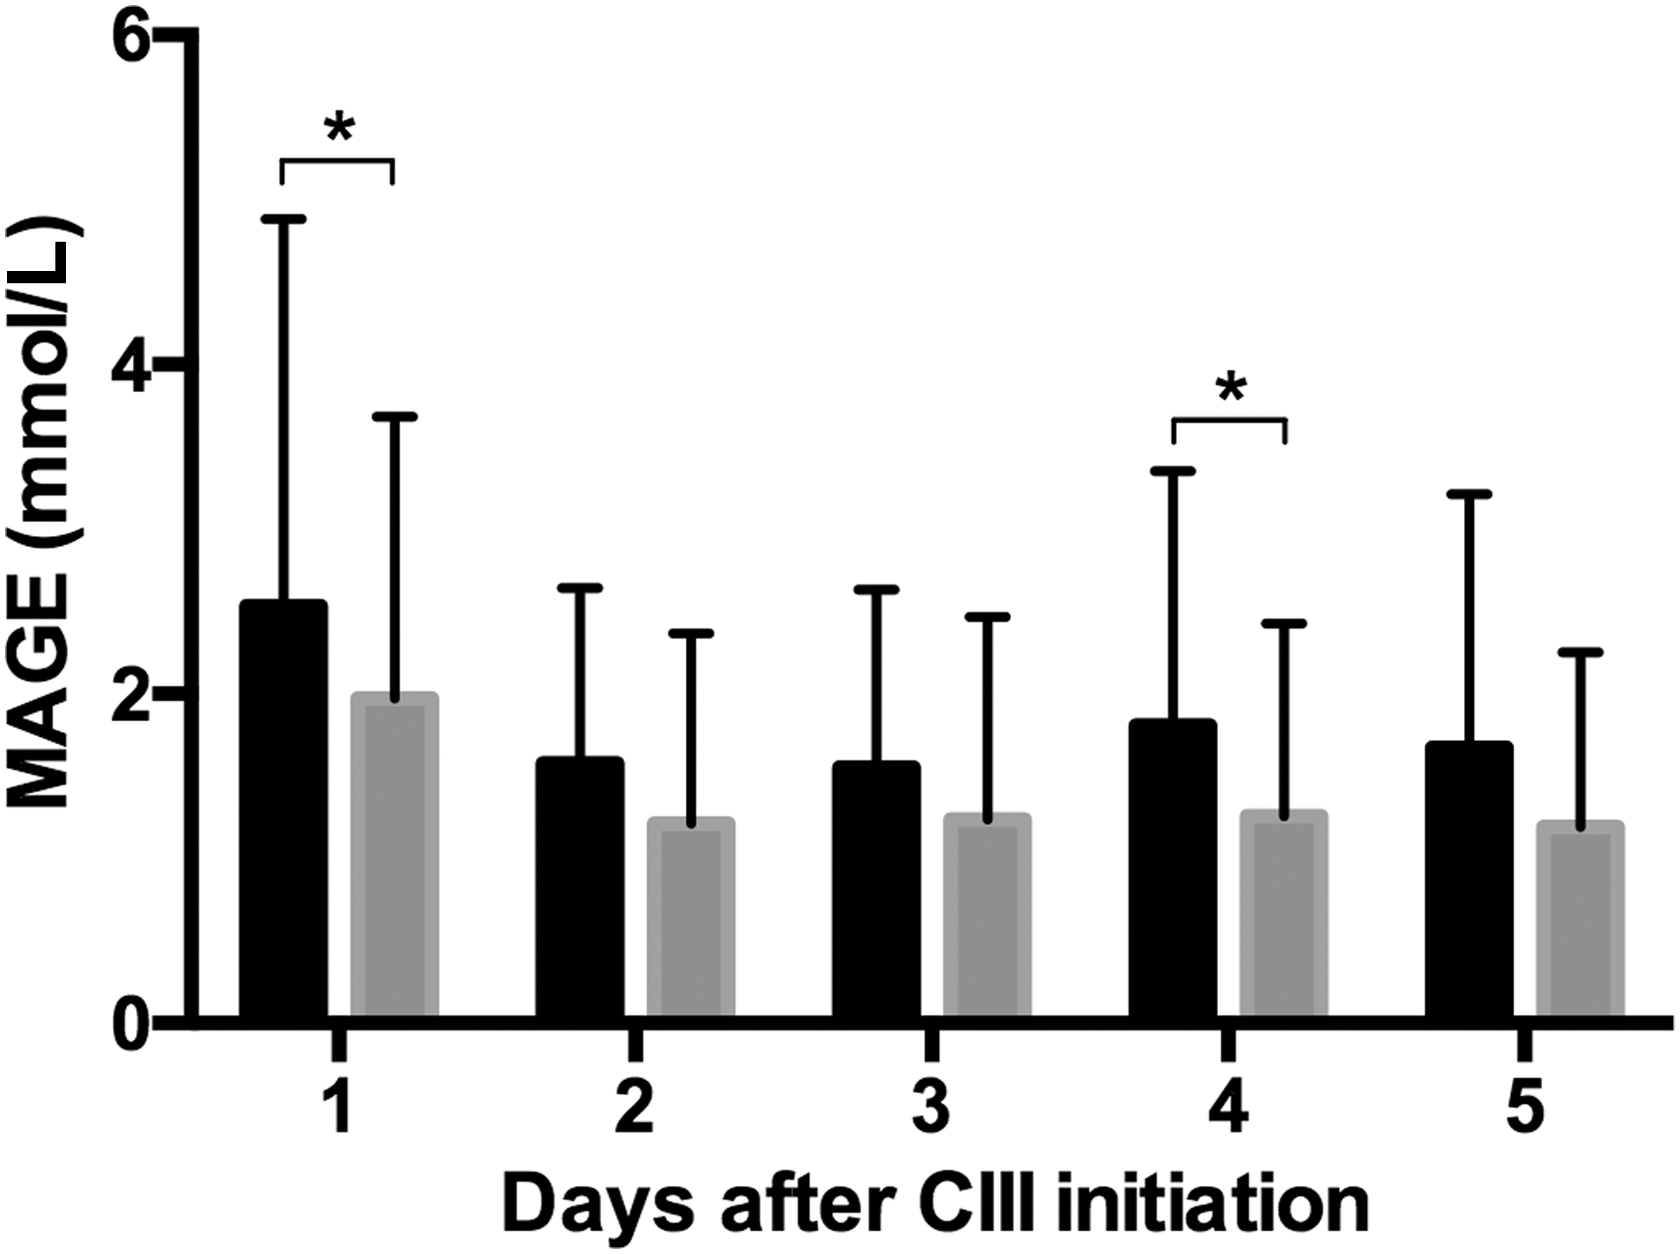
Daily mean average glucose excursion (mean ± standard deviation) calculated for the 5 days after the initiation of CIII in patients from SP (black columns) and DP (gray columns) groups. *P < 0.05.
Data are the mean ± SD or median (interquartile range) (if not otherwise indicated).
CV, coefficient of variation; GRADE, glycemic risk assessment diabetes equation; GV, glycemic variability; HBGI, high blood glucose index; LBGI, low blood glucose index; LI, lability index; MAG, mean absolute glucose change; MAGE, mean average glucose excursion.
Mean BG was lower in the SP group than in the DP group, but this value was closer to the recommended BG target (8.8 mmol/L) in the DP group. The percentage of time spent in the target range (7.7–9.9 mmol/L) was lower in the SP group than in the DP group. Conversely, the percentage of time spent at less than the target (<7.7 mmol/L) was higher in the SP group than in the DP group. Low BG (<4.4 mmol/L) and hypoglycemia (<3.3 mmol/L) were more frequent in the SP group than in the DP group (Table 2). In cases of hypoglycemia, direct intravenous dextrose infusion triggered by low glucose values less than 3.3 and 4.1 mmol/L, respectively, occurred more frequently in the SP group than in the DP group (0.17 ± 0.49 and 0.03 ± 0.17 dextrose injection per patient, respectively; P = 0.03).
Total insulin dose used over the 5-day period was higher in the SP group than in the DP group (Table 2). In addition, the insulin rate was more variable in the SP group than in the DP group (Fig. 4). The time before first CBG in the target range after CIII initiation was similar in both groups (Table 2). Regarding clinical outcomes, we found a nonsignificant trend toward increased ICU and in-hospital mortality in the DP group compared with the SP group. However, infectious complications during ICU stays were more frequent in patients from the SP group than in those from the DP group (Table 2). The subanalysis comparing glucose metrics with SP or DP in patients with or without previously known diabetes showed that the benefits of DP were more consistent in the subgroup of patients without previously known diabetes (Supplementary Table S1).
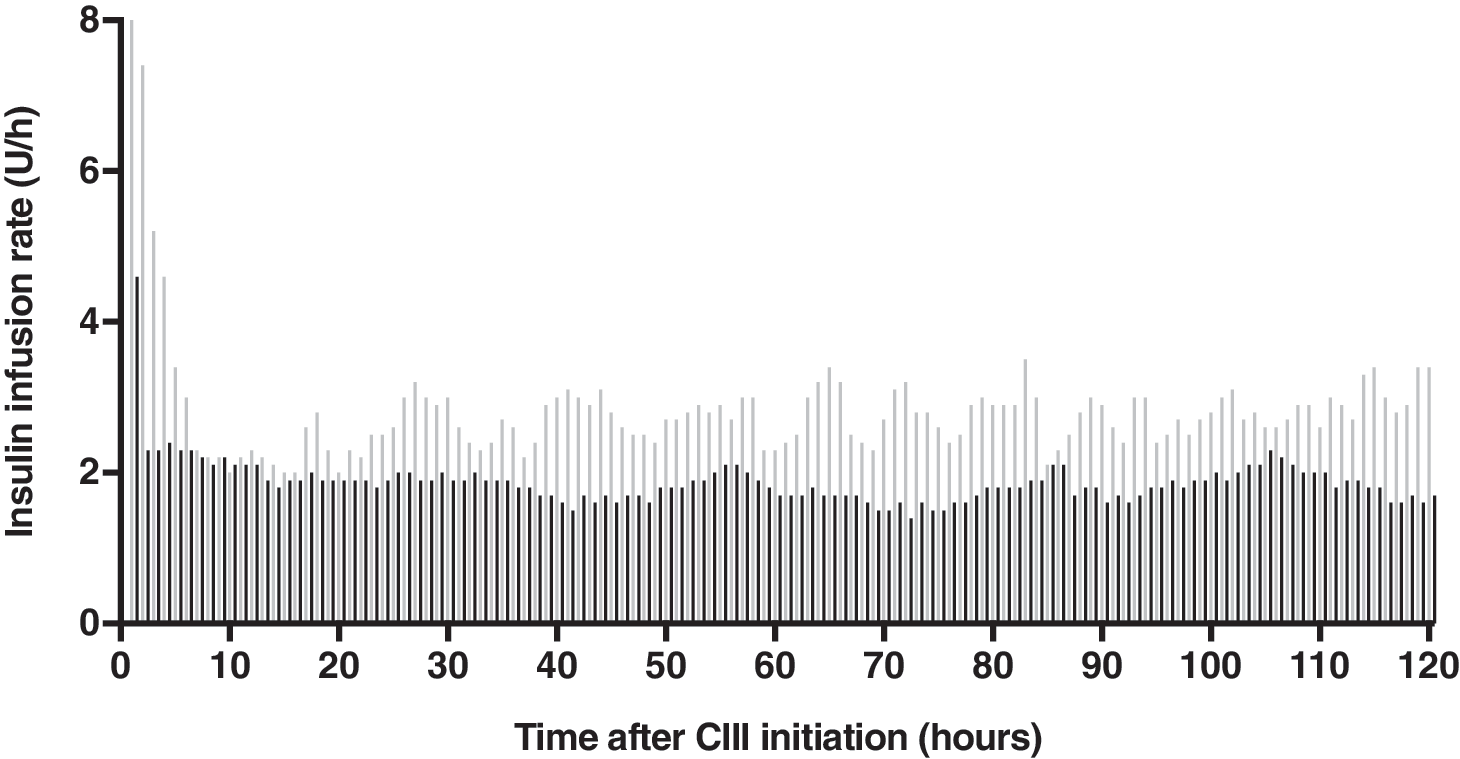
Mean hourly insulin infusion rate after CIII initiation in patients from the SP (gray columns) and DP (black columns) groups.
Among the 10 patients randomly analyzed in each group to assess feasibility, insulin infusion rate adaptations were consistent with protocol recommendations in 83.8% and 77.8% of cases for the SP and DP groups, respectively (nonsignificant).
The satisfaction survey about the protocols was completed by 32 (65%) nurses of the ICU department. Only 28% of the nurses felt that the SP was suitable for ICU patients, compared with the 66% of the nurses who declared that the DP was more suitable in this situation (P < 0.01). On a scale from −5 to +5, they considered the DP to be more complex (+1.7) and more time consuming (+2.1) because of the higher frequency of CBG measurements and higher complexity of insulin rate adjustments. However, they acknowledged that the DP resulted in higher accuracy (+2.0) and greater BG stability (+1.7) than did the SP (Supplementary Fig. S4).
Discussion
In this study, we found that a paper-based dynamic insulin infusion protocol, compared with a static protocol, was associated with lower GV, lower hypoglycemic risk, and increased length of time in the target range.
Variability reduction was clearly observed with time-dependent indices (MAGE, MAG, and LI), which better reflect glycemic lability and are well correlated with mortality. 19 For time-independent indices, the results were less consistent, and this finding deserves some comment. First, the SD tended to be higher in the DP group. The SD is a well-validated parameter to assess GV in the ICU setting, but its value is correlated with mean BG. The increase in SD in the DP group was indeed expected because mean BG was significantly increased in this group.
In contrast, CV, which is adjusted according to mean BG, was not different between the SP and DP groups. HBGI and GRADE were also higher in the DP group, but the calculation of these indices was based on glycemic thresholds of 6.25 and 3.85–7.7 mmol/L, respectively, which were unsuited to ICU targets. However, M-VALUE, a variability index with a method of calculation similar to that of HBGI and GRADE but with a relevant IGV of 8.8 mmol/L was not different between the SP and DP groups.
The discrepancy observed among these three latter variability indices emphasized the paramount importance of the thresholds chosen for their calculation. Considering all of these insights, the SD is probably not the most relevant metric to be used in ICU patients, and at least CV or MAGE and MAG should be preferred to assess GV more accurately.
Associations of glucose variability and oxidative stress, proinflammatory cytokine concentrations, and endothelial dysfunction were previously demonstrated with experimental in vitro and in vivo animals and in human studies. 20 –25 In these different settings, GV was more deleterious than permanent hyperglycemia. In the ICU context, a positive correlation between GV and mortality has been found in many observational studies, including large number of patients, at least for nondiabetic patients. 7 –9 Interestingly, we found that the benefits of our dynamic insulin protocol on glucose variability reduction were particularly consistent in this specific population of ICU patients without previously known diabetes. However, this result should be moderated because of the small sample size of the subgroups of this subanalysis.
All the data regarding the correlation between ICU mortality and glucose variability have prompted experts to consider this glucose metric as an important parameter in this setting and to include it as part of their recommendations. 10,11,26,27 However, to date, no prospective intervention trials have proved that the reduction in GV could reduce mortality in ICU patients. Such studies would be difficult to achieve because other glucose metrics might represent confusing factors. Indeed, mean BG and hypoglycemia should be difficult to control independently of glucose variability.
Our study was not specifically designed to assess the effects of variability reduction on clinical outcomes, and the population size was too small to draw robust conclusions. Indeed, the modest changes in GV noted between the two protocols are not a plausible explanation for the nonsignificant trend toward higher mortality and for the lower infectious complications in the DP group, especially as in this group, mean BG was significantly higher, knowing that it was previously proven that hyperglycemia is associated with increased risk of infection.
Our study was the first prospective trial, to our knowledge, to show the reduction of GV by using a dynamic, paper-based insulin infusion protocol instead of a static protocol. The choice of a dynamic insulin infusion protocol was driven by the need for an efficient protocol to control both hyperglycemia and hypoglycemia, as well as BG variability, as recommended by experts. 10,11 Indeed, although they are still widely used in many ICUs, static insulin infusion protocols are not recommended because they were previously demonstrated to provide less control of these parameters. 28
As previously stated, computer-based dynamic insulin infusion protocols are considered the gold standard protocols because they have demonstrated better efficacy with regard to hyperglycemic and hypoglycemic risks. 12 –14,28 At least one software program (GlucoStabilizer™) is available on the U.S. market to supply advice regarding insulin dosing, using a dynamic protocol. This software has been evaluated in a large retrospective analysis that showed a very low hypoglycemia incidence rate when this software was adequately used, with particular attention to timely measurement and adjustment of insulin doses. 29
However, because of feasibility and availability concerns, computer-based protocols are rarely applied in clinical practice, especially across Europe. The main barriers are the financial costs of implementation (computers and software), the need to train caregivers, and the complexity of use. To combine efficiency and feasibility, we chose a dynamic, paper-based insulin infusion protocol that has been previously validated in ICUs 15 and that we considered easy to use in a “real life” setting.
In addition, our dynamic protocol was highly efficient for hypoglycemia avoidance with a consistent reduction of the time spent at less than the target and of hypoglycemic episodes <4.4 and 3.3 mmol/L. This reduction of hypoglycemic episodes represents, per se, an important outcome because previous studies have demonstrated the negative impact of hypoglycemia on ICU patients' mortality and neurological prognosis. 11,30 The rare low BG episodes observed with our dynamic insulin protocol occurred after the sudden stopping of artificial nutrition, a situation that was not anticipated in either insulin protocol. An important reduction of insulin infusion rate (by 50%, for example) should have been considered in this situation.
Retrospective analysis of insulin rate adaptation showed a compliance of nearly 80% for both protocols, suggesting good feasibility either for the SP or for the DP. This result was consistent with previous studies in the field, reporting compliance with insulin protocols ranging from 53% to 90%. 31 However, it is important to note that, in our trial, hourly CBG measurements were not always timely performed, as reflected by the mean daily CBG frequency (∼12 CBG measurements per day in both groups).
The nurses judged the dynamic protocol to be more complex and time consuming, but they acknowledged its accuracy and ability to maintain stable BG. The acceptance of such a protocol by the nurses is of paramount importance for proper utilization. In our case, acceptance was probably encouraged by adequate training initiated from the beginning of the study and a referent expert nurse, as recommended by French experts. 10 Other parameters should be considered when implementing a new insulin protocol in the ICU, especially the nurses' workload. Indeed, in a 2013 French audit of ICUs, a ratio of more than 1 nurse for 2.5 patients was associated with better compliance with insulin infusion protocols than lower nurse/patients ratios. 32
Our study had several limitations. First, the study population was small and the trial was conducted in only one center. Second, it should be noticed that our BG target range (7.7–9.9 mmol/L) was higher that those used in gold standard computer-based protocols.
In addition, we acknowledge that the overall performance of both protocols of our study was rather low. Time in target for our dynamic and static protocols was 47.6% versus 41.9%, respectively, values clearly lower compared with gold standard computer-based protocols, reaching about 80% of time in target. 33,34 The static protocol used as a control was particularly basic and was far from the ideal type of protocol recommended by experts. Thus, the weakness of this control protocol might have magnified the results of our paper-based dynamic protocol. This point might have been counterbalanced by the greater proportion of patients from the dynamic protocol group receiving glucocorticoids and thus displaying a theoretically more challenging type of hyperglycemia to control.
Third, some of the data were collected retrospectively from medical records, with the potential bias of such design. Fourth, we acknowledge that capillary blood samples and the use of glucometers are not gold standards to assess glucose patterns in the ICU setting. We should have preferably used laboratory measurements of arterial or venous samples using hexokinase. 35,36,10 Deviations of glucometers using other enzymes (glucose oxidase or dehydrogenase) are theoretically <0.82 mmol/L or 20% for higher values (standard ISO15197 in Europe). 37 However, it was previously shown that in ICU patients, deviations more than 20% occur in 15% of glucometer measurements, because of low blood flow rate, peripheral vasoconstriction, state of shock, ischemia, and/or edema. 38
However, this study was, to our knowledge, the first to demonstrate that a simple, paper-based, dynamic insulin infusion protocol could reduce GV. The prospective, stepped-wedge, randomized design led to nearly comparable study groups of patients and theoretically avoided seasonality bias. The calculation of many GV indices allowed for a comprehensive comparison among them and provided for a broad range of glycemic control analyses. Finally, from a clinical practice point of view, our dynamic protocol was easy to implement, was positively evaluated by users, and could be easily transposed elsewhere for routine care in the ICU.
Conclusions
Compared with a static protocol, our simple, paper-based, dynamic insulin infusion protocol reduced GV and hypoglycemic risk in a medical ICU. Such a dynamic protocol is in agreement with current recommendations and seems to represent an effective, feasible, well-accepted, and easy-to-implement alternative to the gold standard computerized protocols. Use of accurate and efficient insulin protocols and the future use of closed-loop systems with the powerful ability to avoid hypoglycemia may lead to reassessments of lower glycemic targets in ICUs.
Footnotes
Acknowledgments
The authors thank all of the nurses and physicians of the ICU for the patients' care and contributions to the data collection.
Author Disclosure Statement
No competing financial interests exist.
References
Supplementary Material
Please find the following supplemental material available below.
For Open Access articles published under a Creative Commons License, all supplemental material carries the same license as the article it is associated with.
For non-Open Access articles published, all supplemental material carries a non-exclusive license, and permission requests for re-use of supplemental material or any part of supplemental material shall be sent directly to the copyright owner as specified in the copyright notice associated with the article.
