
Abstract
Background:
A learning-type artificial pancreas has been proposed to exploit the repetitive nature in the blood glucose dynamics. We clinically evaluated the efficacy of the learning-type artificial pancreas.
Methods:
We conducted a pilot clinical study in 10 participants of mean age 36.1 years (standard deviation [SD] 12.7; range 16–58) with type 1 diabetes. Each trial was conducted for eight consecutive mornings. The first two mornings were open-loop to obtain the individualized parameters. Then, the following six mornings were closed-loop, during which a learning-type model predictive control algorithm was employed to calculate the insulin infusion rate. To evaluate the algorithm's robustness, each participant took exercise or consumed alcohol on the fourth or sixth closed-loop day and the order was determined randomly. The primary outcome was the percentage of time spent in the target glucose range of 3.9–8.0 mmol/L between 0900 and 1200 h.
Results:
The percentage of time with glucose spent in target range was significantly improved from 51.6% on day 1 to 71.6% on day 3 (mean difference between groups 17.9%, confidence interval [95% CI] 3.6–32.1; P = 0.020). There were no hypoglycemic episodes developed on day 3 compared with two episodes on day 1. There was no difference in the percentage of time with glucose spent in target range between exercise day versus day 5 and alcohol day versus day 5.
Conclusions:
The learning-type artificial pancreas system achieved good glycemic regulation and provided increased effectiveness over time. It showed a satisfactory performance even when the blood glucose was challenged by exercise or alcohol.
Introduction
T
Closed-loop blood glucose control needs subcutaneous insulin pump technology, continuous glucose monitoring, and a closed-loop control algorithm. 5 A continuous glucose monitoring system (CGMS) provides an opportunity to meet the demands of intensive diabetes management through frequent measurements of blood glucose concentrations. An artificial pancreas (AP) can automate an insulin pump to achieve and maintain blood glucose concentration within a near-normal range by exploiting a closed-loop controller that computes an effective insulin dose on the basis of the CGMS readings.
Different control algorithms were introduced for closed-loop control of AP. The earliest AP systems used the proportional-integral-derivative control algorithm. 6 Then, AP systems using fuzzy logic control 7 –10 and the multimodular control algorithm 11,12 were developed. AP systems using a model predictive control (MPC) algorithm 13 –16 are now widely used in simulations and clinical trials, because MPC not only reacts to the past blood glucose concentrations but also takes the predicted future blood glucose values into consideration, so it can compute the optimal insulin delivery rate.
It is evident that there exist repetitive cycles in glucose-meal-insulin dynamics, for example, dietary habit and circadian variation of hormone levels. 17 To exploit the repetitive nature of glucose-meal-insulin dynamics, a novel combination of iterative learning control (ILC) and MPC, referred to as learning-type MPC (L-MPC), was recently proposed for closed-loop control of an AP by the authors. 18,19 Preliminary in silico results conducted in the UVa/Padova simulator 20 show that L-MPC can learn from an individual's lifestyle, inducing the glucose control performance to improve from day to day. Under L-MPC, the closed-loop system is named as learning-type AP. In the present study, we performed a clinical evaluation of the learning-type AP.
There exists repetitiveness in glucose-meal-insulin dynamics, but no clinical trial considers the possibility of learning from one day to another. To the authors' best knowledge, this is the first clinical study verifying the learning capability.
Methods
Study design
We conducted this open-label study to evaluate the safety and efficacy of the learning-type AP in patients with type 1 diabetes. The study is registered with ChiCTR, number OPC-14005355.
Study participants
From May 29, 2013 to January 15, 2014, 10 patients were recruited at the Endocrine Metabolic Disease Center of China-Japan Friendship Hospital, Beijing, China. The participants were older than 16 years of age, diagnosed with type 1 diabetes for at least 1 year, and wore an insulin pump for >3 months. We excluded the patients with poor glycemic control (
Study procedures
The study procedures were approved by China-Japan Friendship Hospital Ethics Committee.
On enrollment, the physician reviewed every participant's medical history and performed a physical examination. Weight, height, blood pressure, heart rate, and temperature were measured. Electrocardiogram information was obtained. Blood was drawn for a routine blood panel, and an intravenous blood sample was taken for A1c determination. Liver function, C-peptide, kidney function, total cholesterol, triglyceride, high density lipoprotein, and low-density lipoprotein levels were assayed. The insulin pump model, type of insulin used, and the year the participant started using the pump were noted. Participants were supplied with an identical new blood glucose meter.
On the first 2 days of admission, to stabilize the sensor, a MiniMed Paradigm 722 insulin pump (Medtronic MiniMed, Northridge, CA) was applied to each participant. The first generation of Enlite sensor was used to measure the interstitial fluid glucose level every 5 min. Insulin aspart (Novorapid, Novo Nordisk, Denmark) was delivered into the abdomen by using the infusion pump. The minimum basal insulin infusion rate of the infusion pump was 0.05 U/h.
After the glucose sensor was stabilized, the clinical trial started. Figure 1 shows the trial design. The 8-day clinical trial, including a 2-day open-loop trial and a 6-day closed-loop trial, started each day at 0800 h and finished at 1200 h. The glucose sensor was calibrated by the physician with the finger-stick glucose concentration measurement at 0600 h before the start of the interventions.

Trial design.
The aim of the 2-day open-loop trial was to acquire the key algorithm parameters for the participant (Control Algorithm for Insulin Administration and Individualized Controller Based on the Expected Insulin Calibration Mode sections in Supplementary Data). During these 2 days, the basal insulin rate was set appropriately by the physician. On the first day, participants were sedentary and consumed a meal containing 50 g of carbohydrates at 0830 h, and a specific bolus decided by the physician was delivered to participants when their blood glucose concentrations arrived to the top of the excursion. These measurement data can be used to identify the control model in Equation (1), and this step is also called system identification, as shown in Figure 1. On the second day, participants were sedentary and had an identical meal as the first day at 0900 h, and a specific bolus decided by the attending physician was delivered. In this way, the algorithm for different participants was individualized on the basis of the total insulin doses and meal–glucose–insulin dynamics (Individualized Controller Based on the Expected Insulin Calibration Mode section in Supplementary Data).
During the 6-day closed-loop trial, participants were sedentary except during the exercise day. They consumed the same meal as in the previous 2 days containing 50 g of carbohydrates at 0900 h without a premeal bolus. Participants' basal insulin rate was suspended and replaced by the temporary basal rate that was computed by the L-MPC algorithm using the previous glucose sensor readings (Control Algorithm for Insulin Administration section in Supplementary Data). The algorithm was initialized with six glucose sensor readings collected from 0735 to 0800 h. Real-time glucose sensor readings were imported by one investigator every 15 min into a computer with the algorithm so that the new infusion rate was computed, and then the investigator adjusted the infusion pump with the suggested infusion rate so that the designed dose of insulin was delivered to the participants. From 0800 h onward, venous blood samples were collected every 30 min for reference glucose measurement. Blood glucose was measured with the Biosen C_line Clinic (EKF diagnostic, Germany).
All too often, the designed set-point is set to be the target blood glucose concentration itself, but in the situation of a meal disturbance, the blood glucose concentration would not remain stable if the set-point is fixed at the same target level. In general, the lifestyle of a person, especially of someone with type 1 diabetes, remains similar day by day with regard to, for instance, the timing of meals, the amount of carbohydrates consumed, and the timing and intensity of exercise. Thus, the meal–glucose–insulin dynamics of the individuals with type 1 diabetes can be regarded as a 24-h repetitive process. Therefore, an ILC strategy was introduced to update the set-point in the cost function of the MPC algorithm. On the first day of the closed-loop trial, the set-point was set to be 6.1 mmol/L for simplicity. From the second day onward, the set-point was updated by using ILC every day, and the learning gain in ILC was chosen as L = 0.5 [see Eq. (7) in the Control Algorithm for Insulin Administration section in Supplementary Data]; hence, the set-point could be time-varying within-day.
On the fourth or sixth day, each participant participated in 20 min of moderate-intensity physical activity started from 0930 h, during which they rode a stationary bicycle on a professional exercise equipment (MOTOmed viva2, Reck, Germany), with the resistance set to be 5 Nm (from a range of 0–20 Nm). At 0930 h on a different day, each participant drank 50 mL of beer with an alcohol content of 4%. If a participant performed exercise on the fourth day, then she/he drank beer on the sixth day, and vice versa.
Apart from the meal provided, the participants were not allowed to consume extra carbohydrates. Hypoglycemic episodes were defined as when the continuous glucose monitoring readings fell below 3.3 mmol/L for 15 min or when any venous glucose concentration fell below 3.3 mmol/L, irrespective of the continuous glucose monitoring readings. If a hypoglycemic episode was observed, the venous blood sampling interval required to be switched to 10 min. If the venous blood glucose concentration remained below 3.3 mmol/L after 10 min or if the participants were symptomatic, 10 g oral carbohydrates were given for the rapid treatment of hypoglycemia.
Outcomes
The primary outcome was the percentage of time spent with glucose concentrations in target range (3.9–8.0 mmol/L) between 0900 and 1200 h, as recorded by the glucose sensor. Secondary outcomes included mean glucose concentrations, the percentage of time spent below the target range, time spent above the target, low blood glucose index (LBGI), the number of participants who developed hypoglycemic episodes, and control-variability grid analysis. Secondary outcomes were calculated from 0900 to 1200 h with glucose sensor readings.
Randomization and masking
The order of consuming alcohol and doing exercise was determined randomly. The randomization method is as follows: A random variable, which obeys the Bernoulli distribution and takes values on 0 or 1 with the same possibilities, was obtained for each subject. If the variable value is 0, then this subject takes the exercise test first; otherwise, he/she takes the alcohol test first. Participants and investigators were not masked to the assignment. Participants were masked to the blood glucose concentrations recorded by the CGMS. Investigators were not masked to the glucose concentrations for safety reasons.
Statistical analysis
We anticipated that the adjusted AP on day 3 would increase the percentage of time when blood glucose was between 3.9 and 8.0 mmol/L by a mean of 12% (standard deviation [SD] 10) compared with the AP on day 1. Hence, we did a power analysis by using the paired t-test and calculated that 10 participants would provide 80% power at the 5% significance level to detect difference between the interventions.
Analyses were done on an intention-to-treat basis. We compared the data with the paired t-test. All the values are mean (SD) or median (IQR), unless otherwise indicated. All P-values are two-tailed, and a P-value that was <0.05 was regarded as significant. Analyses were done with SPSS (version 20).
Results
From May 29, 2013 to January 15, 2014, 10 qualified participants were enrolled in this study. All participants completed the 6-day closed-loop trials. The analyses of data of participant 1 on the exercise day were excluded, because this participant should have taken the exercise on the last day but he discontinued participation in the last day's trial due to family reasons.
Figure 2 shows the trial profile. Table 1 shows the baseline characteristics of the 10 participants.
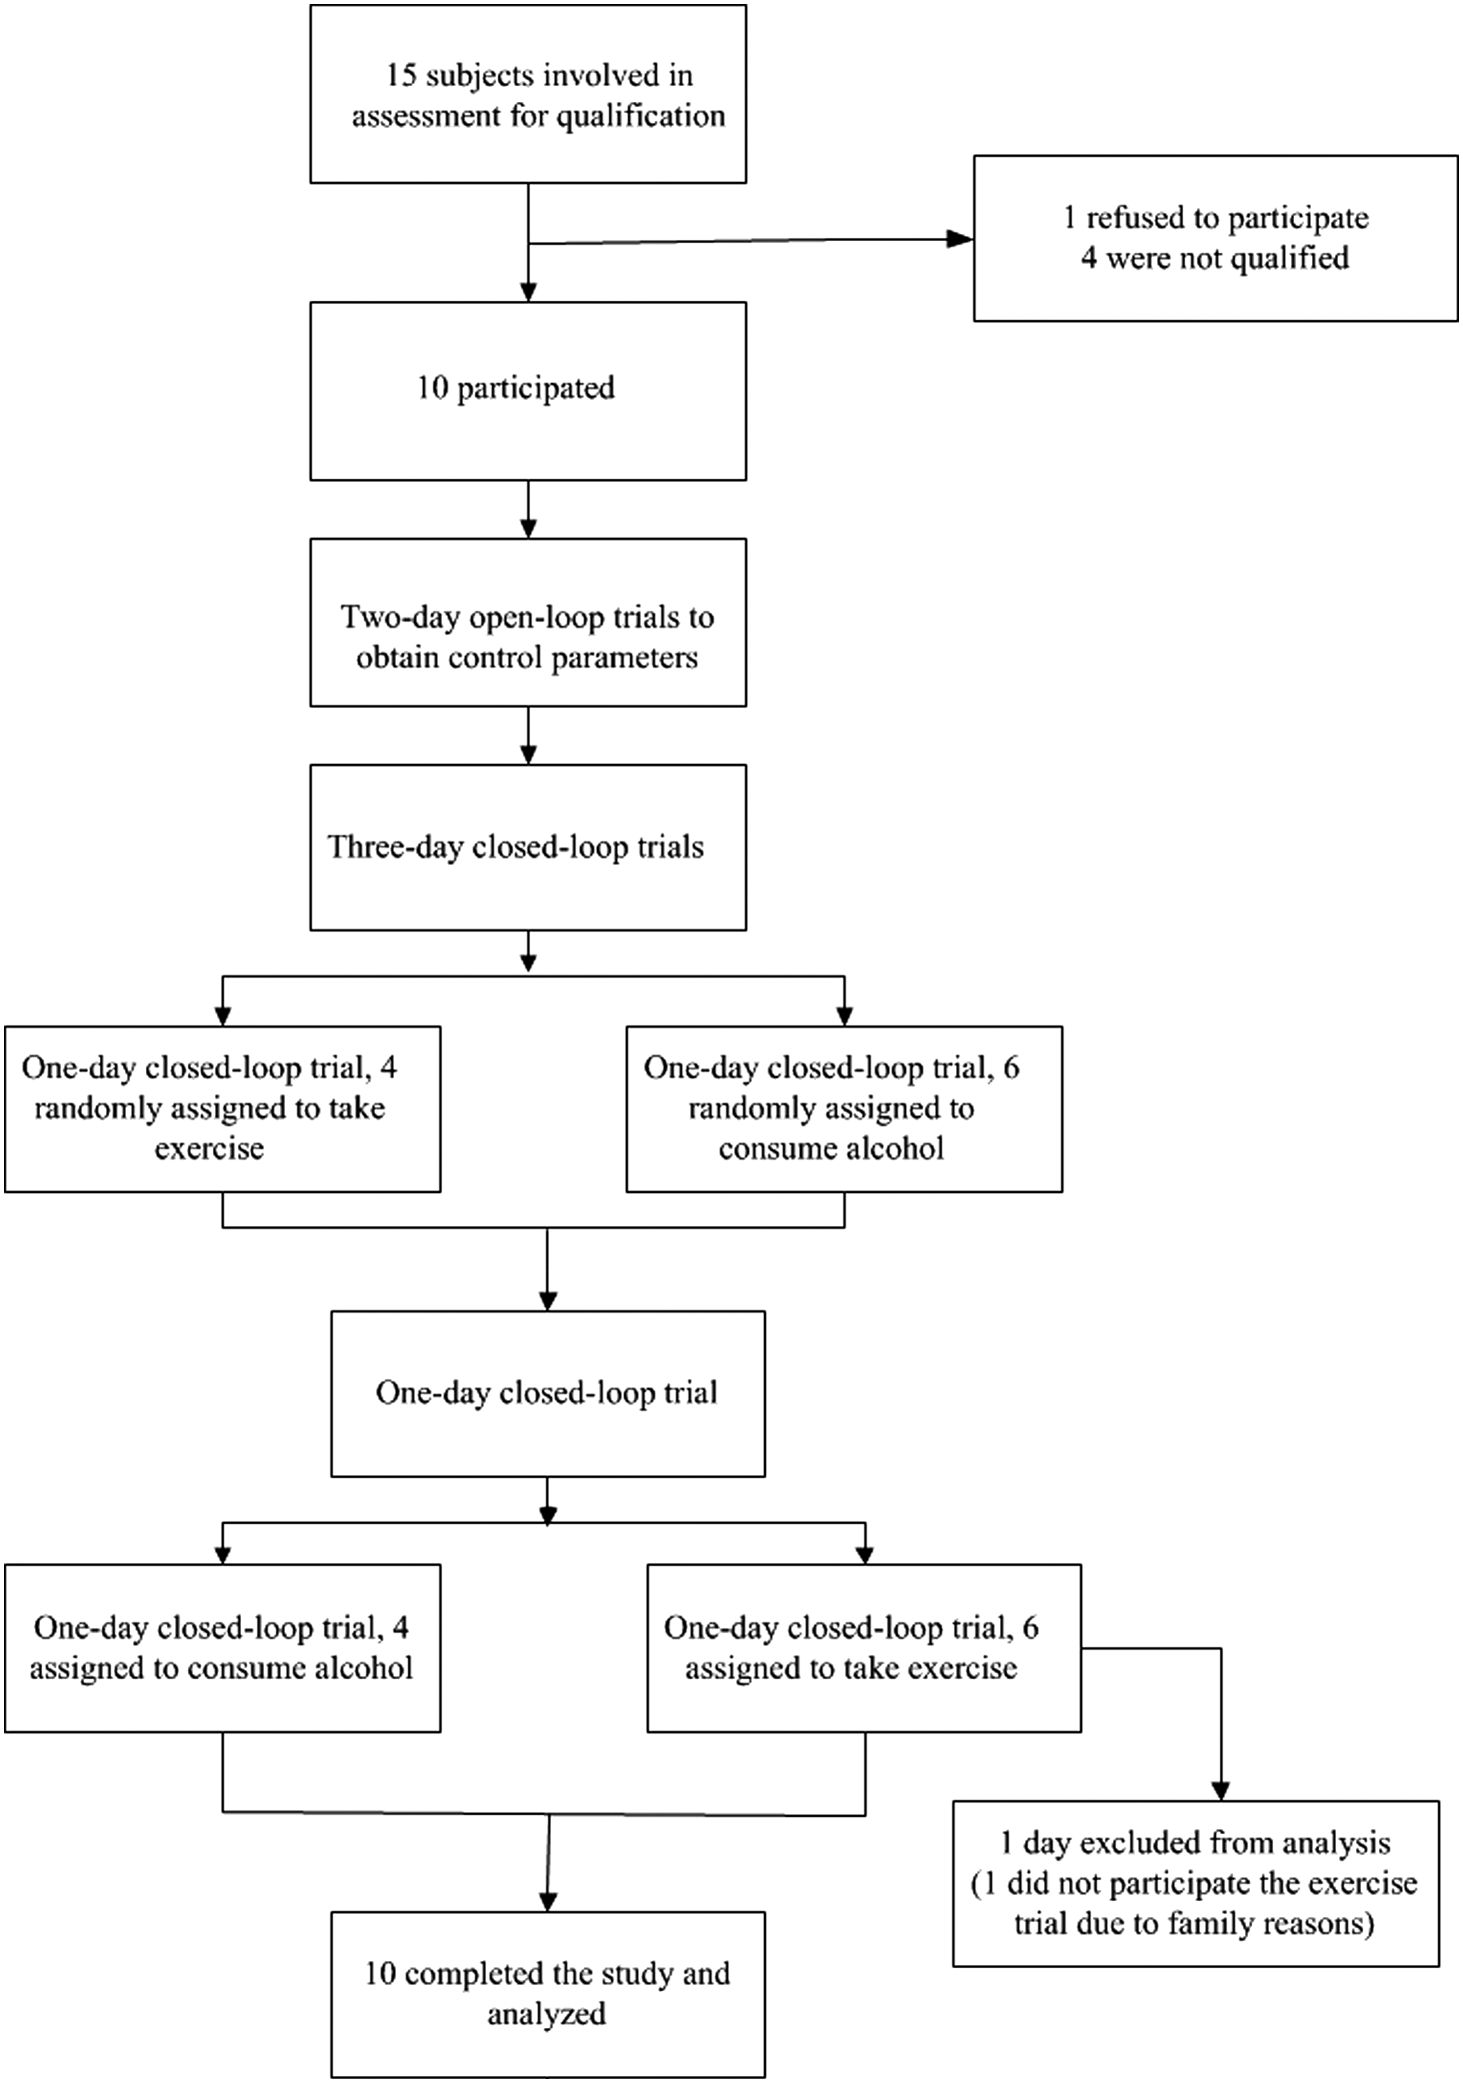
Trial profile.
Data are n (%) or mean (SD; range), unless otherwise indicated.
BMI, body mass index; SD, standard deviation.
Table 2 summarizes results of the primary and secondary analyses. The mean percentage of time for which the sensor glucose was in the target range was significantly higher on day 3 (71.6% [SD 29.8]) than on day 1 (51.6% [SD 17.2]); paired difference for day 3 versus day 1 was 20.0% (confidence interval [95% CI] 3.4–36.6; P = 0.024). The mean time that sensor glucose spent with the target range was 63.4% (26.6) on exercise day, 55.7% (21.6) on alcohol, and 58.4% (32.1) on day 5 (P = 0.891 for exercise day vs. day 5, and P = 0.666 for alcohol day vs. day 5). The mean percentage of time between 3.9 and 10 mmol/L increased on day 3 (83.8% [SD 24.2]) compared with day 1 (76.5% [SD 23.6]); paired difference for day 3 versus day 1 was 7.3% (95% CI −0.2 to 14.8; P = 0.048). The mean time spent between 3.9 and 10.0 mmol/L was 87.4% (20.4) on exercise day, 74.9% (18.6) on alcohol day, and 78.9% (23.8) on day 5 (P = 0.669 for exercise day vs. day 5, and P = 0.325 for alcohol day vs. day 5). An increase of time spent in the target range resulted in a significant reduction of mean time spent with sensor glucose higher than 8.0 mmol/L on day 3 compared with on day 1 (from 47.8% on day 1 to 28.1%) by 19.7% (95% CI 2.8–36.7; P = 0.027). There were no differences between exercise day (36.6% [26.6]) and day 5 (41.6% [32.1]), alcohol day (44.3% [21.6]), and day 5 in mean time spent with sensor glucose higher than 8.0 mmol/L (P = 0.891, P = 0.666, respectively). The mean time spent with sensor glucose higher than 10.0 mmol/L reduced from 22.9% on day 1 to 13.8% on day 3. Although the difference between the mean time spent higher than 10.0 mmol/L between day 3 and 1 maybe clinically significant, a comparison between the two did not reach statistical significance (9.2%, 95% CI −0.3 to 18.7; P = 0.057). There were no differences between exercise day (12.6% [20.4]) and day 5 (21.1% [23.8]), alcohol day (25.1% [18.6]) and day 5 in mean time spent with sensor glucose higher than 10.0 mmol/L (P = 0.669, P = 0.325, respectively). The median, first, and third quartile times spent with sensor glucose lower than 3.9 and 3.5 mmol/L were 0 for all interventions. It should be noticed that the exercise day could be day 4 or 6 for various subjects, and it is similar for the alcohol day.
Data are mean (SD) or median (IQR).
BG, blood glucose; LBGI, low blood glucose index.
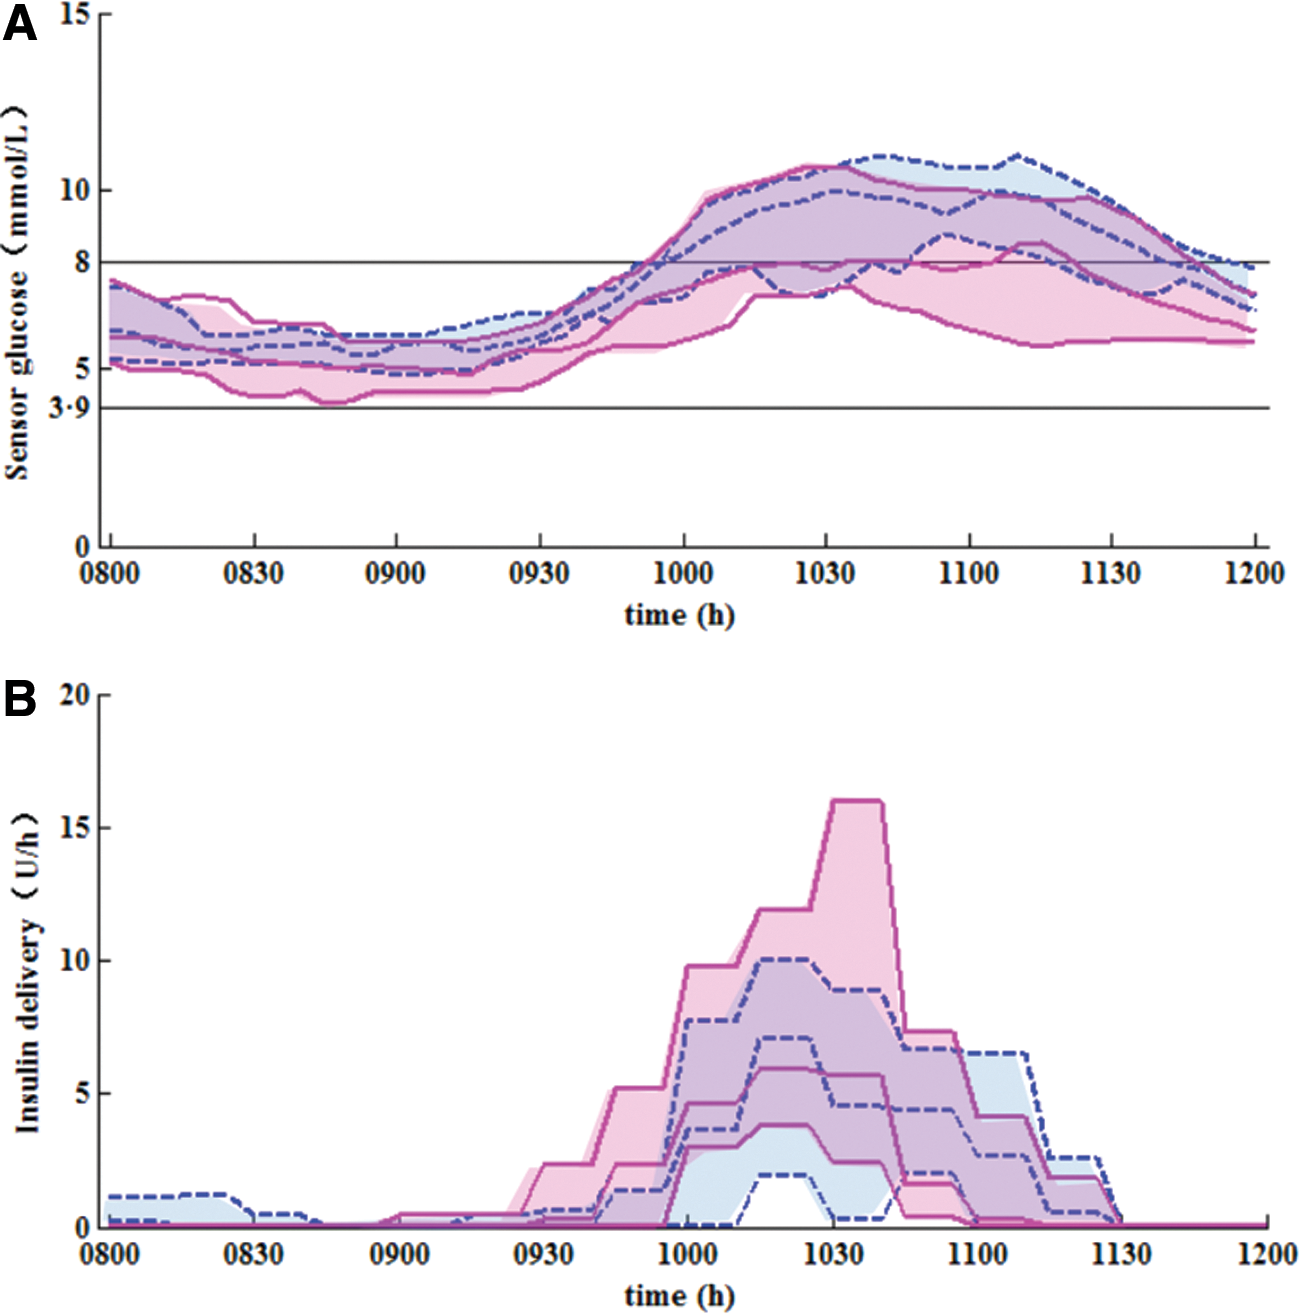
Figure 3 shows sensor glucose profiles. Mean sensor glucose was significantly decreased on day 3 compared with that on day 1 (from 8.3 mmol/L [SD 1.8] to 7.4 mmol/L [SD 1.8]) by 1.0 mmol/L (95% CI 0.1–1.8; P = 0.026). There were no differences between exercise day (7.4 mmol/L [SD 1.5]) and day 5 (8.1 mmol/L [SD 1.4]), alcohol day (8.2 mmol/L [SD 1.1]) and day 5 at mean sensor glucose levels (P = 0.567, P = 0.733, respectively).
Median (IQR) of sensor glucose
LBGI 21 was low but similar on day 3 (1.74 [SD 1.62]) and day 1 (1.00 [SD 0.92]). LBGI were 0.96 (1.00), 1.01 (1.08), and 0.62 (0.54) on exercise day, alcohol day, and day 5, respectively.
The amount of total insulin delivery was similar between day 3 (2.0 [SD 1.5]) and day 1 (1.6 [SD 0.8]). Total insulin delivery was 2.0 (1.2), 2.2 (1.0), and 2.5 (1.5) on exercise day, alcohol day, and day 5, respectively.
Although the median times spent with sensor glucose lower than 3.9 and 3.5 mmol/L were 0, we observed some hypoglycemic episodes with the measurements of venous blood glucose. Table 3 summarized the hypoglycemic episodes. On day 1, two participants developed two hypoglycemic events that required extra carbohydrates compared with no events on day 3. There were one and two hypoglycemic events on exercise day and alcohol day, respectively, whereas no hypoglycemia was observed on day 5.
Data are n or n (%).
Control-variability grid analysis is a method for visualizing the extreme glucose excursions generated by the control algorithm during a given observation period, with each participant being expressed by one data point. The results for the first and third closed-loop day are shown in Figure 4.

CVGA results for closed-loop days 1 and 3. Black circular dots and white hollow square dots denote the glucose concentrations of different participants on days 1 and 3, respectively.
The dots in A-zone on day 3 increased from 0 to 2 compared with day 1, which indicated a better glucose control. It is worth noting that there is no dot in the D-zone, which indicates low risk of hypoglycemic or hyperglycemic episodes using the proposed control algorithm.
Discussion
Through a learning process, the percentage time when the CGMS readings within the target range increased significantly on day 3 compared with day 1. Glucose concentrations were lower on day 3 compared with day 1. The percentage time spent in the target range was not significantly reduced on comparing exercise day with day 5, so was alcohol day and day 5.
Meal consumption had a big impact on the blood glucose excursion of patients with type 1 diabetes. Some studies had involved giving the participant an insulin bolus at the start of the meals to regulate the postprandial blood glucose concentration within the target range. In our study, the learning strategy assigned the glucose set-point to a different value during a different time, which resulted in a more effective insulin infusion strategy. The timing when an infusion rate started to increase or decrease was earlier on day 3 compared with day 1 (Fig. 3). In this way, the insulin amount on day 3 was similar with that on day 1, but a smaller magnitude of postprandial blood glucose excursion was achieved without giving a premeal bolus (Table 2 and Fig. 3).
Studies have reported that physical activity 22,23 and alcohol consumption 24 can decrease the mean glucose concentration and increase the risk of hypoglycemia. There were no differences between exercise day and day 5, alcohol day and day 5 in mean glucose concentrations or LBGI (Table 2 and Figure 5), which indicated the robustness of the learning-type AP.
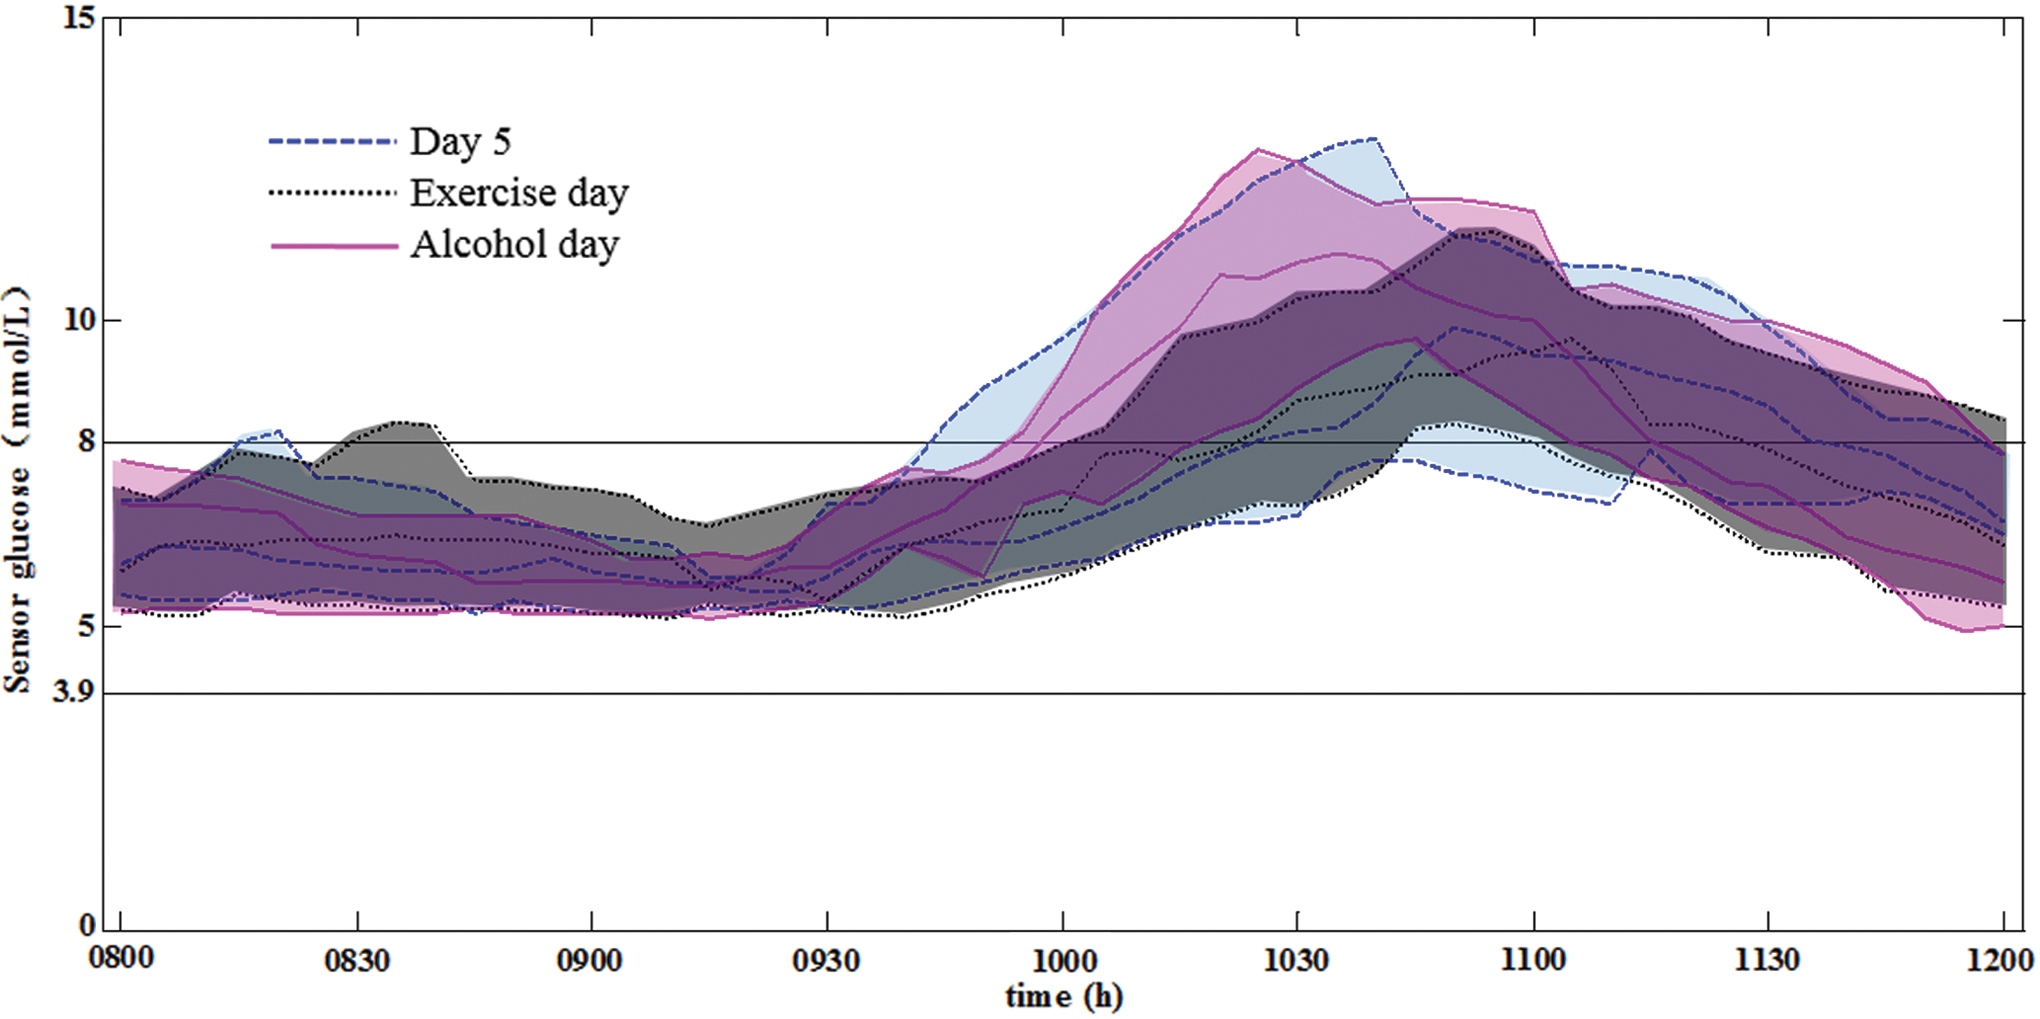
Median (IQR) of sensor glucose on closed-loop day 5, the exercise day, and the alcohol day. Dashed blue line and blue shaded area indicate closed-loop day 5; dotted black line and black shaded area indicate the exercise day; and solid pink line and pink shaded area indicate the alcohol day. Two horizontal black lines denote the target range 3.9–8.0 mmol/L. (Color graphics available at
The strength of our study is the “learning ability” of the AP. The learning-type AP system utilizes the repetitiveness of the daily dietary habit of a patient and does not need any information on the meal time and the amount of carbohydrates.
Because this is the first step in developing a learning AP, there are some limitations of our study. First, it is assumed in this study that the subjects have strict lifestyle repetitiveness; however, there might be disturbances such as exercises at different times of the day, missed meals, erratic meal timing, meals with variable content, and variable absorption of meal carbohydrates in real life. An enhanced method is needed to filter the nonrepetitive nature and to exploit the repetitive nature. Second, 10 patients were recruited to participant in 6-day closed-loop trials in this study. To further confirm our findings, larger and longer studies are needed. Second, the adjustment of insulin delivery was manual instead of automated. Some studies used insulin pump communicating wirelessly with a laptop computer, 25,26 but this is not likely to affect the clinical conclusion.
In this study, the learning gain and the set-point for the blood glucose concentration were set to be 0.5 and 110 mg/dL, respectively. In our future work, these two values will be assigned other values with the aim of potentially finding an optimum setting for the control algorithm. This work is ongoing. To be more practical, learning-type AP of outpatient use would be tested as well.
Conclusion
We did the clinical trials to evaluate the glycemic control performance of a learning-type AP in patients with type 1 diabetes without premeal bolus. The learning-type AP improved the glycemic control performance and shows robustness against exercise or alcohol disturbance. To the authors' best knowledge, this is the first clinical study in the world verifying the learning capability for closed-loop blood glucose control.
Footnotes
Acknowledgments
This work was supported by an EFSD/CDS/Lilly grant; the National Natural Science Foundation of China [Grant Number 61374099]; and the Program for New Century Excellent Talents in University [Grant Number NCET-13-0652].
Author Disclosure Statement
C.C. reports grant from Dexcom and research material support from Dexcom and Roche. Y.W. reports grant from Elli Lilly. W.Y. reports grants from Novo Nordisk, Elli Lilly, and Sanofi; and grants and personal fees from Bayer and AstraZeneca. Y.W. owns intellectual properties in the area of the artificial pancreas. J.Z., F.Z., N.W., X.C., B.Z., and D.Z. declare no competing interests.
References
Supplementary Material
Please find the following supplemental material available below.
For Open Access articles published under a Creative Commons License, all supplemental material carries the same license as the article it is associated with.
For non-Open Access articles published, all supplemental material carries a non-exclusive license, and permission requests for re-use of supplemental material or any part of supplemental material shall be sent directly to the copyright owner as specified in the copyright notice associated with the article.