
Abstract
Background:
Literature supports short-term efficacy and safety of Sensor Augmented Insulin Pump (SAP) therapy in patients with type 1 diabetes (T1D). However, no data are available showing long-term outcomes. Our study describes the long-term outcomes of SAP therapy with low-glucose suspend feature (SAP+LGS) in hypoglycemia in a Colombian population with T1D and hypoglycemia.
Methods:
A cohort study was conducted with T1D patients receiving SAP+LGS therapy who initiated this therapy because of hypoglycemia at San Ignacio University Hospital diabetes center in Bogotá, Colombia. Glycated hemoglobin (A1c) was assessed at least every 6 months, severe hypoglycemia (SH) and hypoglycemia unawareness (HU) incidence yearly. Adherence to therapy was also evaluated.
Results:
One hundred eleven patients were included in the analysis. Total daily insulin dose was reduced during follow-up (mean difference −0.22 U/kg; 95% confidence interval [CI] −0.18 to −0.26; P < 0.001). A1c levels were reduced from a baseline value of 8.8% ± 1.9% to 7.5% ± 1.0% at 5 months (mean difference −1.3%; 95% CI −1.09 to −1.50; P < 0.001) and 7.1% ± 0.8% (mean difference −1.7%; 95% CI −1.59 to −1.90; P < 0.001) at the end of follow-up (47 months on average). The incidence of SH and HU episodes decreased significantly since the first year, and this effect was maintained over time (P < 0.001).
Conclusions:
SAP+LGS therapy in T1D patients with hypoglycemia led to a significant and sustained decrease in A1c during long periods of follow-up, as well as a significant reduction in SH and HU. Future randomized clinical trials are desired.
Introduction
S
STAR 3 study, a multicenter, randomized controlled trial showed significant reductions in glycated hemoglobin (A1c) levels with SAP therapy compared with multiple daily insulin injection (MDI) regimens during 12 to 18 months follow-up. 4,5
Hirsch et al. compared SAP therapy with CSII to standard blood glucose monitoring systems, finding a similar A1C reduction (−0.71% ± 0.71% vs. −0.56% ± 0.072%, P 0.3706), with greater rates of hypoglycemia in the CSII group without CGM. 6
Ly et al. compared standard pump therapy to SAP therapy and low-glucose suspend feature on (SAP+LGS) demonstrating reduction in the combined rate of severe and moderate hypoglycemia during 6 months of treatment. 7 Moreover, the ASPIRE in-Home study showed reduction in nocturnal hypoglycemia without increasing A1C levels while using SAP+LGS therapy during a 3-month period. 8
Although literature supporting the effectiveness and safety of SAP+LGS therapy in short-term studies is ample, there are no data showing long-term outcomes. Our study describes the long-term results of this therapy in a Colombian population with T1D.
Materials and Methods
A cohort study was conducted with T1D patients receiving SAP+LGS therapy who initiated this treatment because of hypoglycemia at Hospital Universitario San Ignacio diabetes center in Bogotá, Colombia. Patients were recruited between August 2009 and August 2014, at the moment they started to use SAP therapy, including an insulin infusion system (Paradigm 722, Paradigm VEO®, Medtronic MiniMed, Inc., Northridge, CA) and CGM system (Enlite®, Medtronic, Northridge, CA). They were followed until December 2015. Inclusion criteria included SAP therapy for more than 12 months and history of severe hypoglycemia (SH) or hypoglycemia unawareness (HU) the year before starting pump therapy. Exclusion criteria were: patients younger than 14 years old, discontinuation of therapy for more than 1 month, and failure to follow-up for more than 6 months. Protocol was approved by the Ethics Committee of Hospital Universitario San Ignacio and Pontificia Universidad Javeriana.
In all patients, insulin pump training program was directed by the diabetes physician, education, and nutrition team. Patients and their families were taught about the insulin pump device, CGM, and carbohydrate counting method by implementing personal and group sessions that included five theoretical and practical workshops lasting 4 to 6 h each one with a maximum of five patients per group. Follow-up during the first 2 months was performed within the first 24 h, 72 h, on the sixth day, and weekly thereafter until a total of five visits were completed. In addition, the diabetes trainer remained available by telephone 24 h a day for any requests from the patient.
Adherence to therapy and downloaded information from CareLink were reviewed to determine the correct insulin pump setting adjustments. The technique and skills used while handling the pump, the first infusion set change on day 3, and the first sensor replacement on day 6 were assessed. The main objective was directed toward optimizing the basal insulin dose per segment and, subsequently, the insulin bolus dose (ratio and sensitivity). After completing 1 year of therapy, patients were retrained to reinforce concepts, remember device functions, and correct potential mistakes. Thereafter, retraining was done yearly.
In all cases, before the initiation of therapy, LGS feature was turned on with a threshold of 70 mg/dL in patients with HU and 60 mg/dL in the remaining patients.
Demographic characteristics (age, gender, weight, and height) and baseline clinical characteristics (total daily insulin dose [TDID], micro- and macrovascular complications, indication for therapy, history of symptomatic HU or SH, and hospitalization associated with diabetes in the past year) were obtained from the hospital records contained in the clinical histories. CGM data and adherence to therapy were extracted directly from the pump device using the CareLink® Pro software version 3.0.
Hypoglycemia was defined as at least 1 episode of SH or HU documented by direct interview during follow-up visits. To evaluate baseline hypoglycemia incidence, episodes in the 12 months before initiation of therapy were considered. Events were documented between each of the periodic assessments (scheduled every 3 to 6 months), but were added to calculate hypoglycemia incidence yearly for analytic purposes. SH was defined by the need for assistance from another person for recovery, and HU was defined as a glucometric value below 70 mg/dL without associated neuroglycopenic symptoms. Diabetic ketoacidosis (DKA) was defined following American Diabetes Association standards and it was inquired by medical record search and patient interview at each follow-up visit.
For continuous variables, mean and standard deviation (SD) were reported for variables with a normal distribution; median and interquartile (IQ) ranges were reported if this condition was not met. For categorical variables, frequencies and percentages were reported. A t-test for repeated measures was used to assess A1c changes comparing baseline value with A1c mean level at each follow-up visit until end of follow-up; Bonferroni correction was done to counteract the problem of multiple comparisons. The incidence of hypoglycemia and the proportion of patients achieving metabolic goals were compared using the Q Cochran test to assess changes between baseline data and follow-up visits. STATA version 14.0 was used for the analysis.
Results
One hundred seventeen patients with T1D initiated SAP therapy between August 2009 and August 2014 and were invited to participate in the study. All of them accepted, but six were lost in the follow-up because of health system coverage policies before achieving the first year of therapy. One hundred eleven were finally included in the analysis and were followed until the end of the study. We did not have censured patients, neither mortality events nor desertions of therapy.
Baseline demographic and clinical characteristics are shown in Table 1. Median age was 42 years (IQ range: 29–58 years), and mean body mass index was 24.12 ± 3.32 kg/m2. The whole population reported hypoglycemia as an indication for insulin pump therapy, with SH in 66.6% and HU in 81.6% of the cases. Poor metabolic control was observed in 66.6% of the patients and 64.8% of the patients also presented high glycemic variability. In seven patients (6.30%), pregnancy was an additional indication for therapy.
A1c, glycated hemoglobin; BMI, body mass index; IQR, interquartile range; SD, standard deviation; TDID, total daily insulin dose; SAP+LGS, sensor augmented insulin pump therapy with low-glucose suspend feature.
Insulin dose
The mean TDID before starting therapy was 0.89 ± 0.39 U/kg and by the last visit in SAP therapy was 0.67 ± 0.25 U/kg (mean difference −0.22 U/kg; 95% confidence interval [CI] −0.18 to −0.26; P < 0.001). The proportion of basal insulin was 46.7% at the first checkup and 55.6% at the last checkup. The mean number of basal doses increased from 4.7 ± 1.7 to 5.1 ± 1.4 at the last visit, while the number of boluses decreased from 5.1 ± 2.1 to 4.7 ± 1.5, respectively.
Adherence
Mean CGM sensor use at the first visit in SAP therapy was 85.9% and 79.45% of time at the last visit. Seventy-nine percent of patients showed sensor use compliance greater than 80% of time at the first visit and this percentage decreased to 72% at the end of follow-up (P = 0.105).
Bolus Wizard® feature was used 97.1% and 98.5% of time at the first and last visit, respectively. Baseline mean number of daily capillary glucose measurements was 6.09 ± 1.99 the first months following SAP therapy and 5.52 ± 2.05 at the last visit. Mean time for changing the infusion set was every 3.58 ± 0.91 days at the first checkup and 3.54 ± 0.93 days at the end of follow-up.
Efficacy
Mean baseline A1c levels were 8.8% ± 1.9%, and mean follow-up time was 47 ± 22.7 months. A1c values and percentages of patients achieving the goal of ≤7% during follow-up are presented in Table 2.
In the first follow-up visit (∼5 months in SAP therapy), mean A1c levels decreased to 7.5% ± 1.0% (mean difference −1.3%; 95% CI −1.09 to −1.50; P < 0.001) and this effect in improving metabolic control remained clinically and statistically significant throughout follow-up (Fig. 1). At the end of follow-up, mean A1c value was 7.1% ± 0.8% (mean difference −1.7%; 95% CI −1.59 to −1.90; P < 0.001).
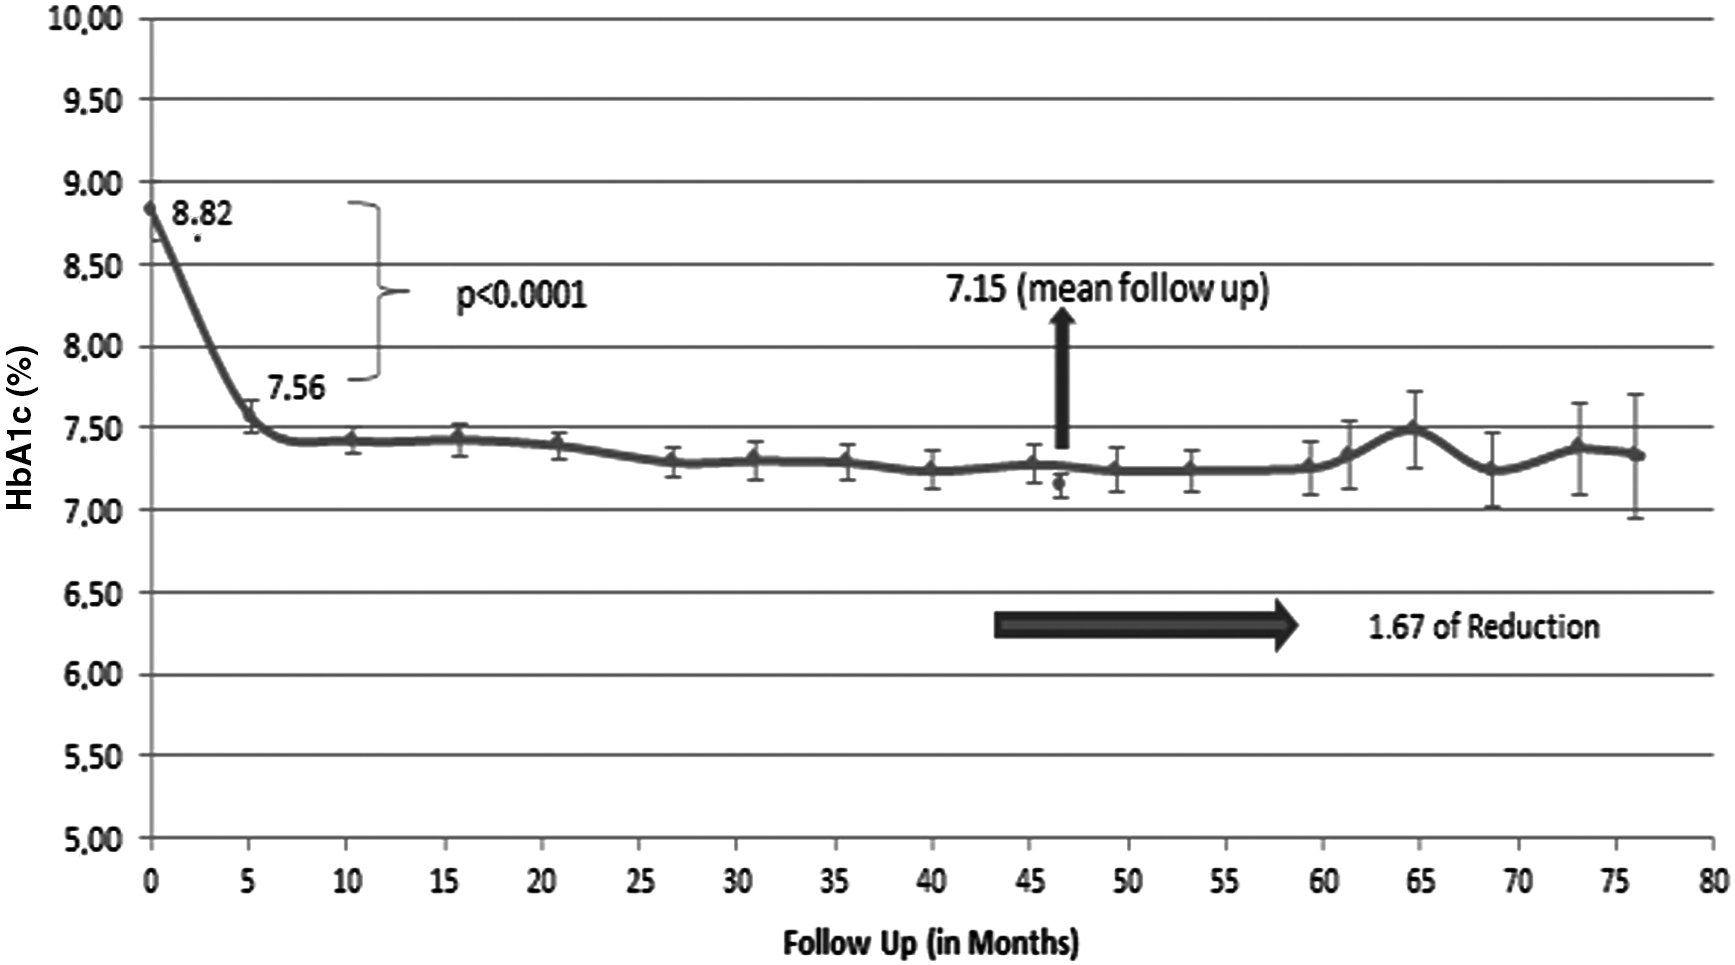
Values correspond to A1c levels ± standard deviations. P-value was determined by the t-test for repeated measurements to assess A1c mean difference and to compare baseline values with values obtained for each follow-up visit. P < 0001 for each of the comparisons.
Baseline data showed only 19 patients (17%) reaching A1c levels ≤7%. At first visit in SAP+LGS therapy, 40% of patients met this goal (P < 0.001) and at last follow-up visit, this value improved to 43.2% (P < 0.001).
Safety
The incidence of SH and HU events before, during each year of follow-up, and at the end of SAP+LGS therapy is shown in Table 3. The number of hypoglycemia events decreased significantly after starting the therapy (P < 0.001) and this trend was maintained over time. This tendency was noticed since the first follow-up visit with SH reported in 9 patients (8.1%) and HU in 20 patients (18.1%).
Last visit refers to the last show-up for each patient during follow-up.
The P-value was calculated as the difference in proportions (incidence of at least 1 episode of hypoglycemia) between the visit before the initiation of insulin pump therapy and yearly follow-up visits. P-value for the difference in proportions of hypoglycemia unawareness and severe hypoglycemia.
Composite outcome
Composite outcome was defined as achieving metabolic control (A1c ≤ 7%) without SH or HU events. Before starting SAP+LGS therapy, only two patients (2.7%) reached metabolic goal without SH events and one patient (0.9%) without HU events. At first follow-up visit in therapy, composite outcome occurred in 36.9% and 32.4% of patients, respectively (P < 0.001), and at the end of follow-up, percentages were 42.3% and 36.9%, respectively (P < 0001).
Diabetic ketoacidosis
In the year before starting therapy, 15 of 111 patients (13.5%) reported an episode of DKA and at last follow-up visit in therapy this proportion decreased to 4.5% (5 of 111 patients) (P = 0.02).
Diabetes-associated hospitalization in last year
Before starting SAP therapy, 30% of patients (34 patients) reported diabetes associated hospitalization in the previous year, and in the last visit follow-up this percentage was reduced to 5.4% (6 patients) during the last year of therapy.
Discussion
Our study is the first one reporting short- and long-term SAP+LGS therapy efficacy and safety in a high risk T1D population with history of HU and SH. Data show improvement in metabolic control with significant change in A1C levels within the first semester (mean difference −1.3%; 95% CI −1.09 to −1.50) and in the long-term scenario (mean difference −1.7%, 95% CI −1.59 to −1.90), accompanied by simultaneous significant reduction in hypoglycemia events (P < 0001).
Previous experience with SAP+LGS therapy has not demonstrated a significant impact on A1c levels. The study by Ly et al., 7 conducted in a younger T1D population with a low-glucose suspension threshold at 60 mg/dL, found that mean A1c decreased from a baseline level of 7.6% (95% CI 7.4%–7.9%) to 7.5% (95% CI 7.3%–7.7%) during 6 months of SAP+LGS therapy. In the same study, patients randomized to insulin pump therapy without LGS showed no difference between baseline and end point A1c levels, 7.4% (95% CI 7.2%–7.6%). Similarly, in the ASPIRE In-Home study, 8 A1c levels remained stable, mean difference of 0.00% ± 0.44% in SAP+LGS therapy, and −0.04% ± 0.42% in controls after 3 months of follow-up in T1D patients with history of nocturnal hypoglycemia and low-glucose suspension threshold at 70 mg/dL. It is possible that the greater decline in A1c levels observed in our patients is due to higher baseline levels before intervention. Patients in Ly study had baseline A1c levels lower than 8.5% as an inclusion criteria, and patients in the ASPIRE In-Home study had a mean baseline A1c level of 7.26% ± 0.71%. It has been demonstrated previously that under oral antidiabetic therapy, greater reductions occur with higher baseline A1c values. 9 The threshold for automatic suspension in our patients was set at 70 mg/dL and was maintained during follow-up in patients with history of HU or SH and at 60 mg/dL for the rest of patients. Therefore, it is unlikely that these suspension values explained the greater decrease in A1c levels in our population. In addition, it is not possible to attribute difference in metabolic control to adherence to therapy because sensor use was similar (85.9% of time at first follow-up visit performed at 5 months in our experience vs. 88.1% in the ASPIRE In-Home study).
Regarding the safety outcomes, it is not possible to compare our results directly with those reported in previous studies. In our real-life experience, the incidence of hypoglycemia was assessed through periodic interviews with patients, asking them to report whether they had experienced at least one SH or HU episode, but the total number of unaware events was not quantified. However, our results were similar to those reported previously. 7,8
Regarding greater follow-up periods, previous studies had evaluated the long-term effect of insulin pump therapy without CGM compared with MDI therapy. Clements et al. 10 described metabolic control achieved after 5 years in T1D patients under this therapy treated at 10 outpatient centers in Sweden. Mean baseline A1c levels in insulin pump therapy group was 8.39%, and a greater decrease was found at 1, 2, and 5 years of therapy because of greater baseline A1c values. However, at 5 years of follow-up, net difference in A1c reduction between the two groups was minimal (mean difference −0.25%, 95% CI 0.11%–0.39%), even for patients with baseline values equal to 9%. Joubert et al. 11 demonstrated a net reduction in A1C levels of 0.4% to 0.5% from first year to more than 7 years of follow-up compared with patients in MDI regimen, with a low percentage of use of Bolus Wizard (23.8%) and mean daily glucose measurements of 5.2 ± 3.2. Our data show greater changes in glycemic control and safety that might be associated with CGM integrated therapy and low-glucose suspend feature in hypoglycemia.
The main limitation of our study is the lack of a control group of patients without SAP+LGS feature therapy. This implies that the decrease of A1c levels could be associated with other characteristics of the population. In fact, our insulin pump training is more intense than education standards used in other programs. In a previous study we demonstrated that a lower A1C was associated with the completion of additional training and the adherence to pump therapy recommendations, specifically sensor use, bolus wizard use, CGM-based alarms, and more frequent blood glucose checks. 12 Future research is needed to evaluate the impact of additional factors in long-term efficacy and safety.
Additional limitations of our study included the method with which the incidence of SH and HU was determined in our patients, which could be biased and underestimated by the patients' memory; however, a more rigorous record of hypoglycemic events would tend to increase the size of this difference rather than decrease it. Similarly, the relatively small number of patients who completed more than 5 years of follow-up was a limitation of this study; however, the size of the effect for both A1c and for the incidence of hypoglycemia was clinically and statistically significant even with these small sample sizes.
Our study is the first to evaluate the effectiveness and safety of SAP+LGS therapy in real life and in the long term, with a mean follow-up of 47 months. Our data demonstrate a meaningful and sustained decrease in A1c during follow-up that is significantly associated with fewer severe and HU events. These results suggest that SAP+LGS therapy is safe and effective in the long term. Future randomized clinical trials are desired.
Footnotes
Acknowledgment
The authors are grateful to all integrants from the Diabetes Center at Hospital Universitario San Ignacio.
Author Disclosure Statement
The author(s) declared the following potential conflicts of interest with respect to the research, authorship, and/or publication of this article: A.M.G. reports speaker fees from Novo Nordisk, Elli Lilly, MSD, Novartis, and Medtronic and research grants from Medtronic, Novartis, Novo Nordisk, and Abbott. C.M.A.C. receives fees for insulin pump patient training from Medtronic. D.C.H.C. reports speaker fees from Novo Nordisk and research grants from Novo Nordisk. No other potential conflicts are reported.