
Abstract
Background:
We have recently shown how the combination of information from continuous glucose monitor (CGM) and heart rate variability (HRV) measurements can be used to construct an algorithm for prediction of hypoglycemia in both bedbound and active patients with type 1 diabetes (T1D). Questions remain on how cardiovascular autonomic neuropathy (CAN) influences these measurable changes. This study aims to examine if changes in HRV during hypoglycemia are confounded by the presence of CAN.
Methods:
Twenty-one adults (hereof 13 men) with T1D prone to hypoglycemia were recruited and monitored with CGM and a Holter device while they performed normal daily activities. CAN was diagnosed using two cardiac reflex tests: (1) deep breathing and (2) orthostatic hypotension and end organ symptoms. Early CAN was defined as the presence of one abnormal reflex test and severe CAN was defined as two abnormal tests or one abnormal test combined with symptoms of autonomic neuropathy.
Results:
A total of 19 hypoglycemic and corresponding euglycemia periods were identified among the 21 patients. Eleven patients were diagnosed with CAN, hereof five with severe CAN. The HRV parameter low frequency (LF) was significantly (P = 0.029) reduced during hypoglycemia. Changes in LF during hypoglycemia were not different between patients with and without CAN, −0.64 versus −0.48 log(LF) (P = 0.74).
Conclusions:
Our data show that there are measurable changes in HRV during hypoglycemia, and present in both patients with and without CAN.
Introduction
W
HRV is a noninvasive and extensively validated method to measure the activity and the balance of the autonomic nervous system (ANS). The ANS is a multifunctional system regulated by the sympathetic nervous system and the parasympathetic system, providing a rapidly responding mechanism to control a wide range of bodily functions, for example, the cardiovascular, respiratory, gastrointestinal, and genitourinary systems, exocrine and endocrine secretions, as well as the microcirculation within the tissues. 3 In patients with T1D and type 2 diabetes (T2D), autonomic dysfunction, the onset of CAN, may be present already in the prediabetic stage. The prevalence of CAN is high and estimated to affect 20%–70% of all patients with diabetes, depending both on the duration of diabetes and on the diagnostic test used. 4 CAN is defined as the impairment of autonomic control of the cardiovascular system in the setting of diabetes after exclusion of other causes 5 and it results from damage to the autonomic nerve fibers resulting in abnormalities in heart rate control and vascular dynamics. 6 CAN may provoke ischemic cardiac episodes by upsetting the balance between myocardial blood supply and demand, 7 and is associated with the “dead-in-bed” syndrome. 8 It has also been shown that autonomic cardiac regulation is effected during spontaneous nocturnal hypoglycemia in patients with T1D. 9 A recent study 10 investigated the effect on HRV during induced hypoglycemia in T2D and healthy controls and found a significant change in HRV in both individuals with T2D and controls.
Most cases of CAN are asymptomatic and even when symptoms are present, they may be weak and uncharacteristic for years and therefore often overlooked. As a result, and due to the high prevalence, many individuals suffer from undiagnosed CAN.
This study aims to examine if changes in HRV during hypoglycemia are confounded by the presence of CAN.
Methods
Participants
Data for this study were obtained from the HypoAna trial performed at Steno Diabetes Center (Gentofte, Denmark). 11 The duration of the trial was between 2007 and 2008. The first patients were enrolled on December 16, 2007, and the last patient was enrolled on March 7, 2008. A total of 21 (13 men and 8 women) adults with long-lasting T1D were recruited. The patients were 58 ± 10 years old, had diabetes duration of 34 ± 12 years, and an HbA1c of 7.9% ± 0.7%. All participants were prone to hypoglycemia, that is, they had experienced at least two episodes of severe hypoglycemia within the last year. None of the patients had a history of cardiovascular disease or took drugs affecting the cardiovascular system. All patients had a normal electrocardiogram. The study protocols were approved by the local ethics committee and the study conducted according to the principles of the “Helsinki Declaration II.” All patients provided written informed consent.
Study design
Participants were admitted to the Clinical Research Unit at the Steno Diabetes Center at 8 PM (study day 1). Electrocardiogram (ECG) was measured from lead II using a digital Holter monitor (SpiderView Plus; ELA Medical, Montrouge, France). At the same time, CGM was monitored using a Guardian Real-Time Continuous Glucose Monitoring System (Medtronic MiniMed, Northridge, CA) with the prevailing glucose level blinded. At 11 PM (study day 1), a cannula was placed into an antecubital arm vein. Blood glucose samples were taken at hourly intervals until 7 AM (study day 2) the next morning. This was conducted as a part of the calibration procedure and to study the nightly glucose fluctuations compared to CGM in another study. At 8 AM (study day 2), participants were sent home with the monitoring equipment and they were instructed to calibrate the CGM at least four times a day. Monitoring ended on study day 4 at 8 PM. A total of 72 h of continuous CGM and ECG data were obtained from each participant.
Diabetes complications
The presence of CAN was investigated using two cardiovascular reflex tests according to standard protocol 12 and symptoms of autonomic neuropathy: (1) deep breathing test according to age-dependent cutoff levels 12 and (2) orthostatic hypotension test with a change in systolic blood pressure of more than 30 mmHg. Early CAN was defined as the presence of one abnormal reflex test and severe CAN was defined as two abnormal tests or one abnormal test combined with symptoms of autonomic neuropathy. Nephropathy was defined as microalbuminuria (urinary albumin/creatinine ratio 30–300 mg/g) or macroalbuminuria (urinary albumin/creatinine ratio >300 mg/g). Diabetic retinopathy was classified based on digital fundus photography. Peripheral neuropathy was diagnosed based on biothesiometry. A vibration perception threshold above 25 V on one foot was classified as peripheral neuropathy. Symptoms of peripheral neuropathy were recorded.
Extracting of HRV from ECG
The ECG was analyzed using custom analysis software developed in MATLAB (Version R2014a; MathWorks, Natick, MA). ECG QRS detection was implemented based on the methods of Pan and Tompkins with (a) bandpass filter, (b) differentiating, (c) squaring, and (d) moving-window integration. 13 Initial R-peaks were identified with a threshold and a minimum time distance of 250 ms from the moving-window integration output. R detections were then found as the highest point in the original signal within the time frame of the initial detected peak. Interbeat intervals were derived from the R detections and interpolation was used to remove outliers based on 2·StdHRV. The HRV signal was analyzed with a 10-min, 90% overlapping sliding window calculating typical derived measures describing HRV, heart rate, SDNN (standard deviation of all NN intervals), SDANN (standard deviation of the averages of NN intervals in all 5-min segments of the entire recording), pNNx (proportion of pairs of adjacent NN intervals differing by more than 50 ms), RMSSD (the square root of the mean of the sum of the squares of differences between adjacent NN intervals), VLF (power in very low-frequency range, <0.04 Hz), LF (power in low-frequency range, 0.04–0.15 Hz), HF (power in high-frequency range, 0.15–0.4 Hz), TP (total power of all frequencies), and LF/HF (ratio of LF and HF).
Data analysis
Self-measurement of blood glucose (SMBG) was used for reference of episodes with hypoglycemia, ≤3.9 mmol/L. The delta HRV was calculated as the absolute difference from the time of the hypoglycemic event defined by the SMBG (hypoglycemic period) and 1 h before the event (nonhypoglycemic period). Because of the skewed distributions in HRV, a logarithmic transformation was made on the measures of HRV. Differences in the logarithmic values between hypoglycemic and euglycemic periods were analyzed by paired-samples t-test. To test the influences of cardiac autonomic modulation on regulation during hypoglycemia, significant changes between hypoglycemic and euglycemic periods were analyzed using linear regression.
Results
Characteristics of patients are presented in Table 1. Eleven patients were diagnosed with early-stage CAN (CAN+) and five of them had late-stage autonomic neuropathy with symptoms of autonomic neuropathy, for example, erectile dysfunction or gastroparesis.
Early CAN (CAN+) was defined as early stage with one abnormal reflex test. Severe CAN* was defined as two abnormal tests or one abnormal test combined with symptoms of autonomic neuropathy. Nephropathy was defined as microalbuminuria (urinary albumin/creatinine ratio 30–300 mg/g) or macroalbuminuria (urinary albumin/creatinine ratio >300 mg/g). Diabetic retinopathy was classified as nil, background retinopathy and proliferative retinopathy based on digital fundus photography. Peripheral neuropathy was diagnosed based on biothesiometry. A vibration perception threshold above 25 V on one foot was classified as peripheral neuropathy.
CAN, cardiovascular autonomic neuropathy.
A total of 19 hypoglycemic and corresponding euglycemic periods were identified among the 21 patients. LF was significantly (P = 0.029) reduced for all patients during hypoglycemia—Figure 1 illustrates the individual change in the HRV parameter LF from euglycemia (1 h prior) compared to the hypoglycemic event.
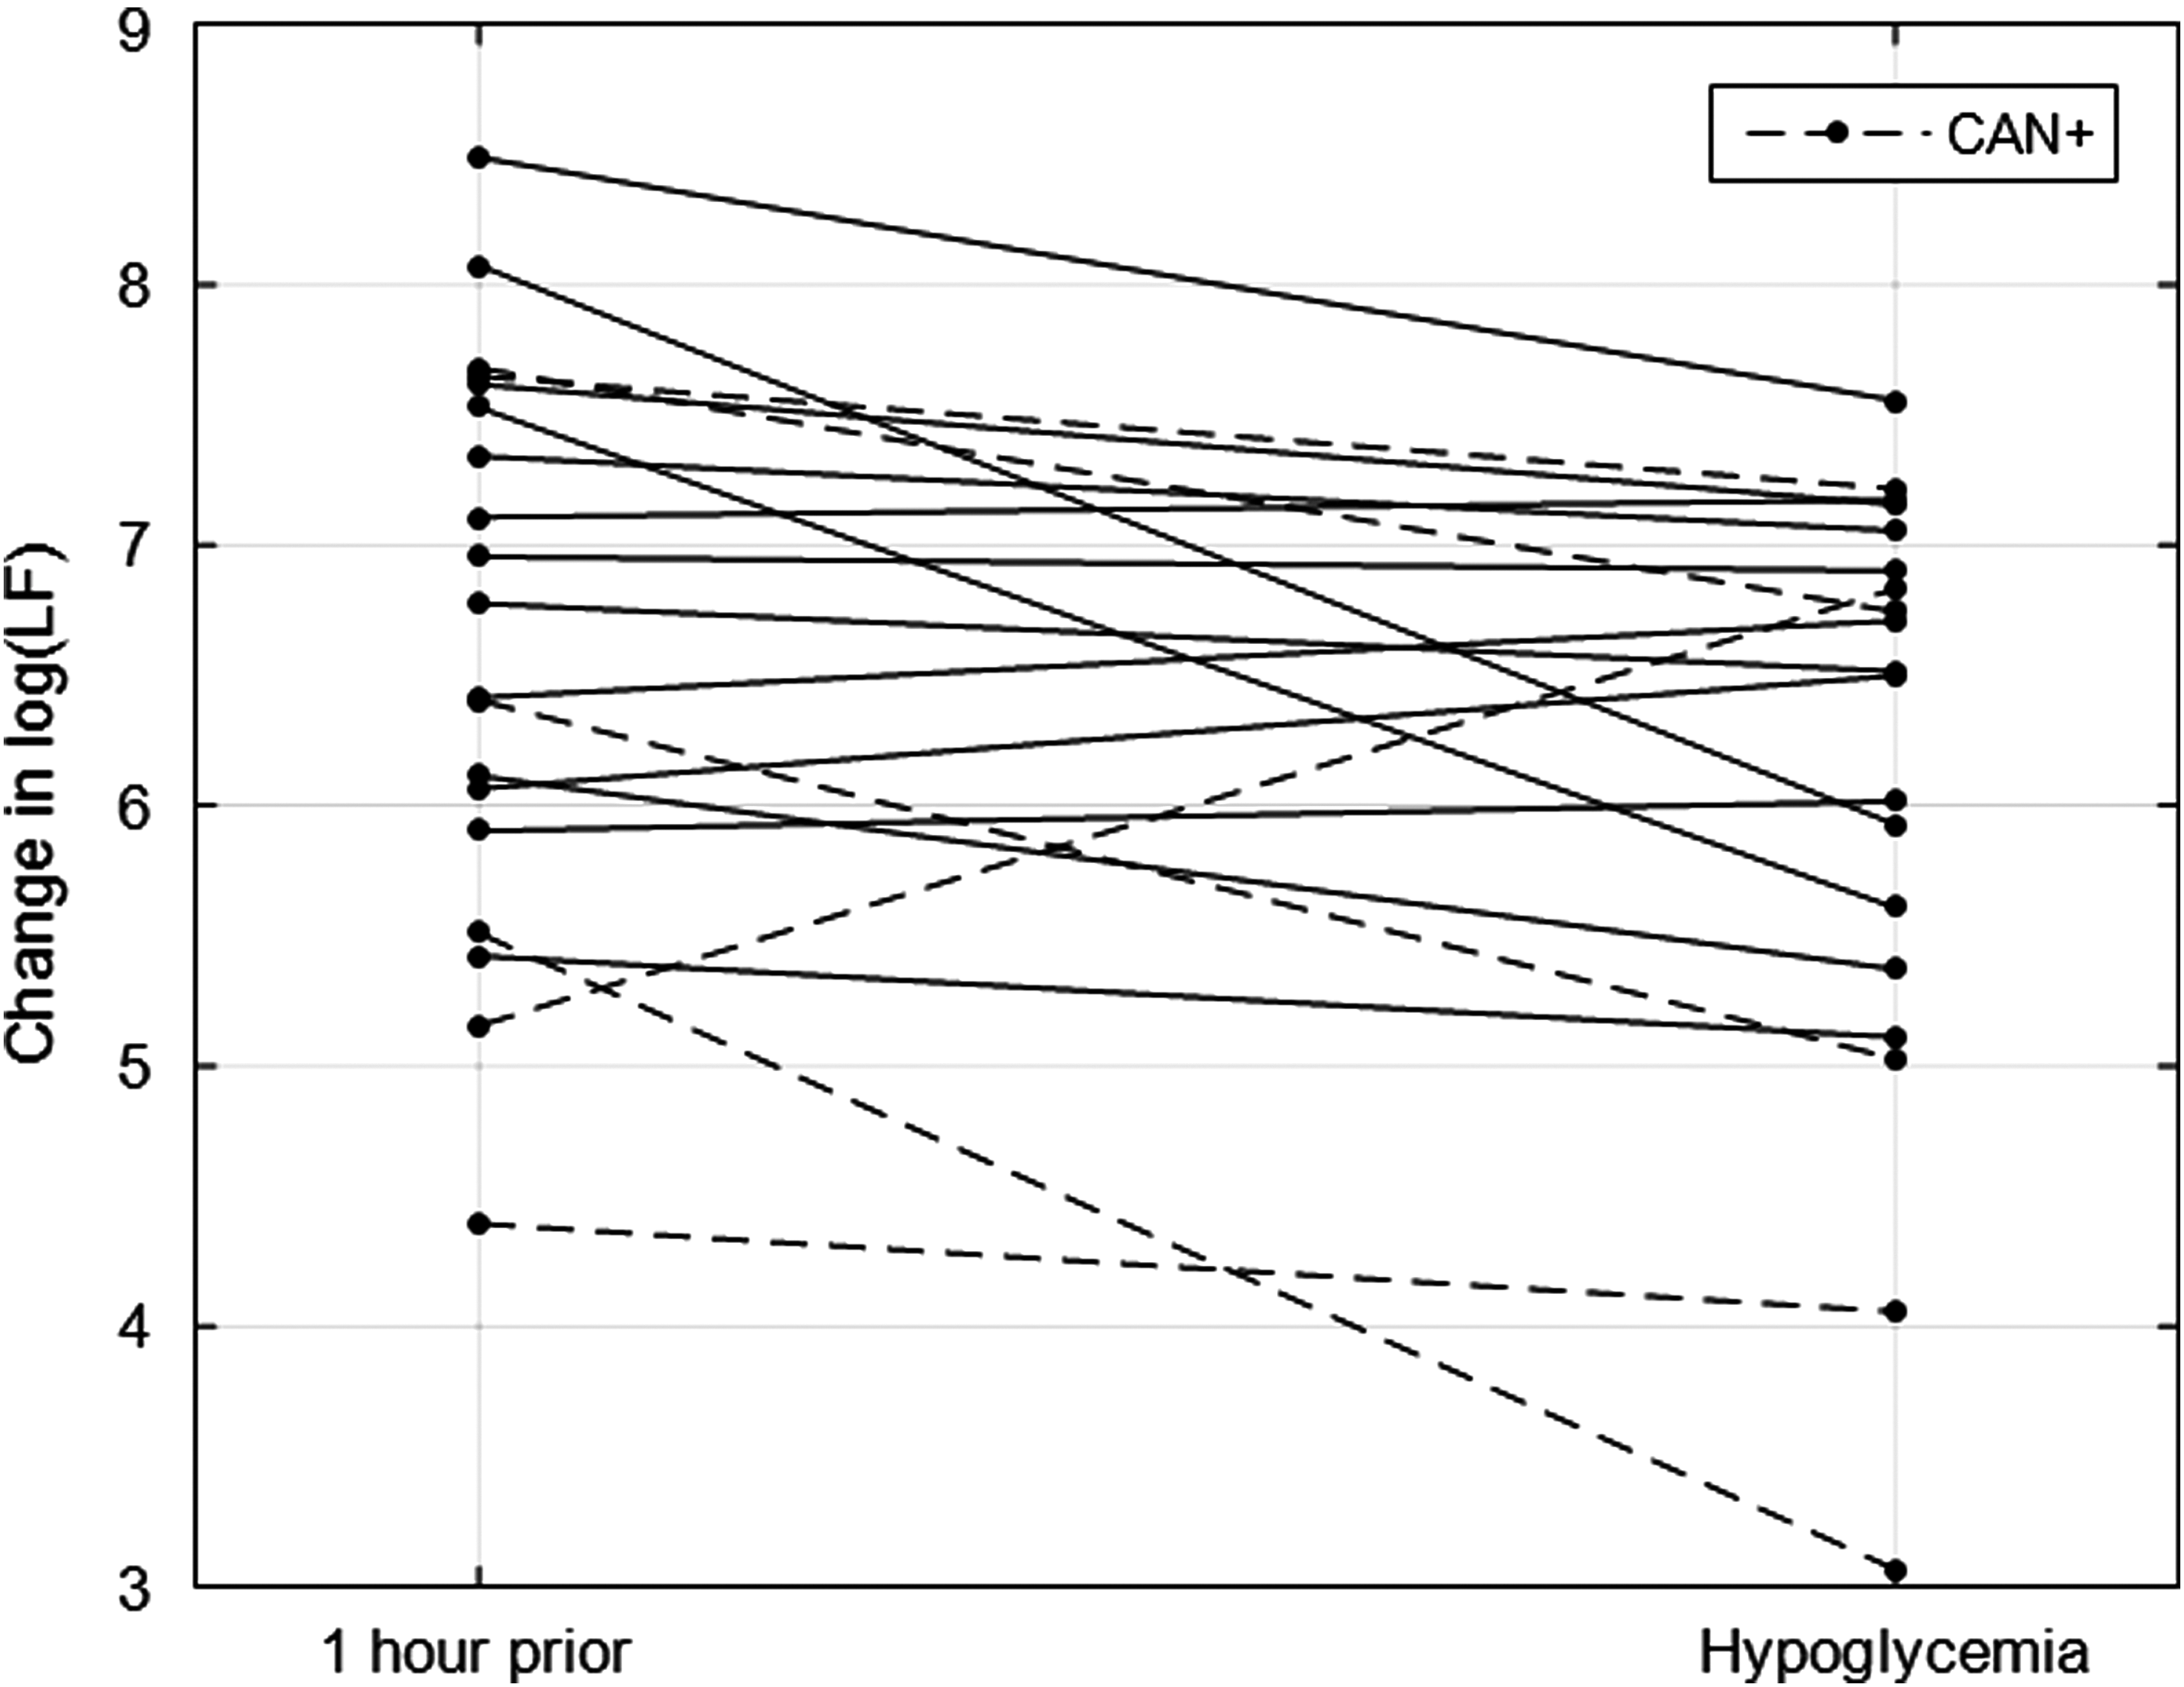
The individual development in the heart rate variability parameter low frequency from euglycemia (1 h prior) to the hypoglycemic event. CAN, cardiovascular autonomic neuropathy.
Relative changes in SDNN, RMSSD, HF, and TP were not observed (Table 2). Further analysis showed no relationship between autonomic cardiac regulation (LF) during spontaneous hypoglycemia and reduced parasympathetic modulation measured with deep breathing, P = 0.66, R2 = 0.012. Figure 2 shows that there was no relationship between the initial assessment of CAN+ (deep breathing) and the change in LF (delta between euglycemia and hypoglycemia).

The relationship between the initial assessment of CAN+ (deep breathing) and the change in low frequency (delta between euglycemia and hypoglycemia).
HF, high frequency; HR, heart rate; LF, low frequency; NS, nonsignificant; RMSSD, root of the mean of the sum of the squares of differences; SDNN, standard deviation of NN.
Data show that the changes in LF during hypoglycemia in free-living are present for both groups with and without CAN. Furthermore, the changes in LF during hypoglycemia were not different between the groups with and without CAN, −0.64 versus −0.48 log(LF) (P = 0.74).
Discussion
Hypoglycemia is the main side effect of insulin replacement therapy in patients with diabetes and it remains a major risk and obviously a daily concern for most patients and their relatives. Recent reports have indicated that severe hypoglycemia is a major burden on the healthcare system due to the high costs of emergency visits and hospitalizations. 14 Equally important as this burden is the hypothesis 15 –17 that (asymptomatic) hypoglycemia occurring during sleep most likely will contribute to the development of hormonal counter regulatory failure during hypoglycemia and hypoglycemia unawareness, which in turn increases the risk of further hypoglycemic episodes. Thus, a vicious circle of further and more severe hypoglycemic episodes may develop. 16,17 We have shown how an algorithm can help predict hypoglycemic episodes. 1 The prediction could help the patient or his/her relatives to intervene and prevent the hypoglycemic episode to occur. The technology is based on a combined CGM and HRV analysis. In light of this, it is expected that such an algorithm may not work in patients with CAN, which encompasses damage to the autonomic nerve fibers that innervate the heart, resulting in abnormalities in heart rate control and a significantly reduced HRV. Due to the high prevalence from both diagnosed and undiagnosed CAN and the link between CAN and the “dead-in-bed” syndrome and hypoglycemia unawareness, it is of immense importance that such algorithm is able to predict hypoglycemia also in patients suffering for neuropathy. Therefore, we have investigated how a reduced cardiac autonomic modulation influences autonomic cardiac regulation measured by HRV during spontaneous hypoglycemia. Our study indicated that HRV changes during hypoglycemia are independent of the presence of CAN. A linear regression failed to show relationship between reduced cardiac autonomic modulation and the decline in the HRV parameter LF during hypoglycemia. We considered that the relationship might be nonlinear, but the data did not support this. The LF component is influenced by sympathetic, parasympathetic, and baroreflex sensitivity. 18
To our knowledge, no other studies have investigated the effect of reduced HRV on the changes during hypoglycemia in patients with CAN. However, one study found a stronger association between reduction in some HRV parameters in controls compared to individuals with T2D. 10 This could indicate that reduced HRV in diabetes affects hypoglycemia-induced changes at some level. In conclusion, there are measurable changes in HRV during hypoglycemia in both patients with and without CAN.
Footnotes
Author Disclosure Statement
The algorithm for prediction of hypoglycemia mention in this article is developed by Medicus Engineering. S.L.C. and J.F. are consultants for Medicus Engineering.