
Abstract
Background:
In glucose clamp experiments, blood glucose concentrations (BGs) are kept as close as possible to a predefined target level using variable glucose infusion rates (GIRs). In automated clamps, GIRs are calculated by algorithms implemented in the device (e.g., the Biostator). Low BG- and GIR-variability is needed for high clamp quality. We therefore tried to reduce oscillations in both BG and GIR with an improved algorithm implemented in ClampArt, a modern clamp device.
Subjects and Methods:
The Biostator algorithm was first improved by numerical simulations of glucose clamps (in silico). With the results of the simulations, we started in vitro experiments using the ClampArt device and a container with water and glucose as “test subject.” After a small pilot in vivo study, a larger clinical study was performed to compare the original with the optimized algorithm.
Results:
With the improved algorithm, in silico, in vitro, and in vivo experiments showed reduced oscillations in both BG and GIR. In the clinical study, the coefficient of variation (CV) of BG values was lowered from 6.0% (4.6%–7.8%) [median (interquartile range)] to 4.2% (3.6%–5.0%), P < 0.0001 and the CV of GIR from 60.7% (49.6%–82.0%) to 43.5% (32.8%–57.2%), P < 0.0001. Other clamp quality parameters did not change substantially, median deviation from target slightly increased from 0.6% (0.2%–1.0%) to 1.1% (0.7%–1.5%), P = 0.0005, whereas utility did not change [97.0% (93.4%–100.0%) vs. 97.0% (94.0%–98.8%), P = 0.57].
Conclusions:
With the improved algorithm, all experiments confirmed a reduction in BG- and GIR-oscillations without a major impact on other glucose clamp parameters. The optimized algorithm has been implemented in ClampArt for all future glucose clamp studies.
Introduction
T
In automated clamps, the ability of the algorithm to keep BG at target, thereby avoiding high oscillations in BG und GIR, determines the glucose clamp quality. To achieve optimal clamp quality, the algorithm has to be adapted to time lags, BG measurement quality, pump characteristics, and so on. First published in 1982, the Biostator algorithm has widely been used for automated clamps with the Biostator. 6 The Biostator, however, is a device developed in the 1970s using outdated pump and glucose sensor technology. We therefore developed ClampArt, a CE-marked state-of-the-art glucose clamp device (Fig. 1). Initially, the original Biostator algorithm was implemented into ClampArt. This article describes the efforts to optimize this algorithm for ClampArt, particularly with regard to reduced oscillations in both BG and GIR.
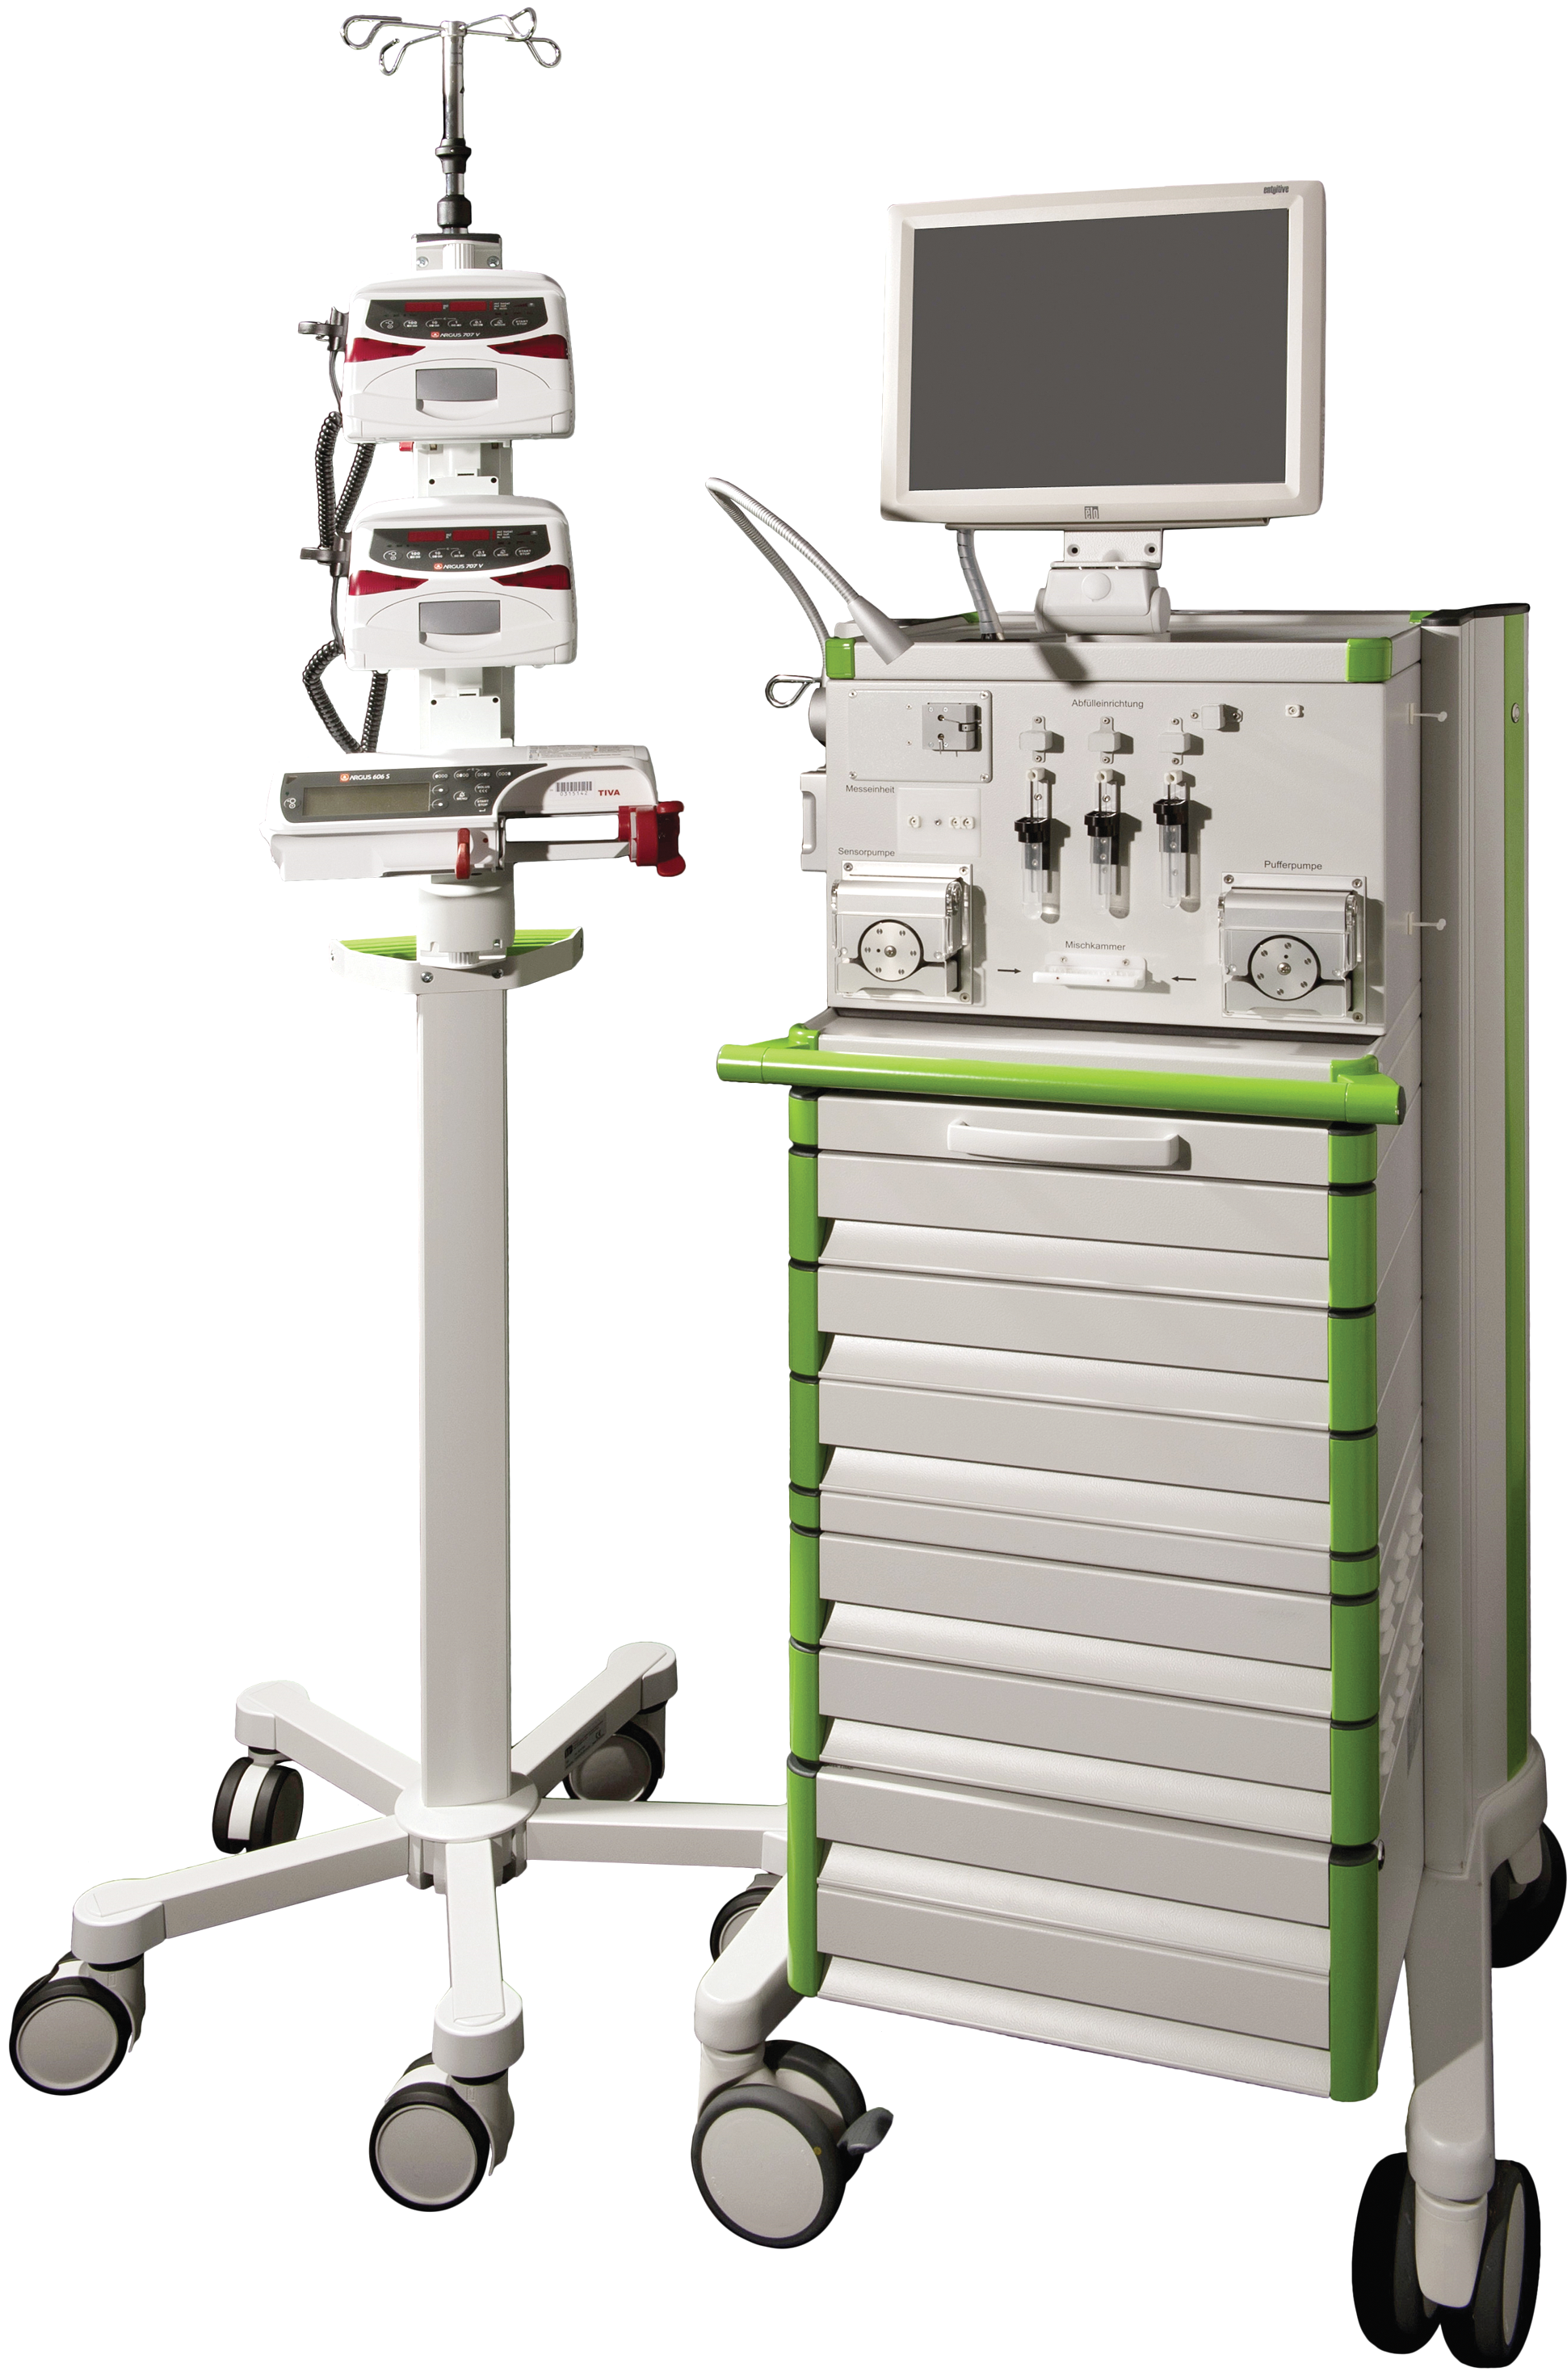
The ClampArt device used for the in vitro and in vivo experiments as well as for the clinical study.
Subjects and Methods
The optimization of the unmodified Biostator algorithm (UBA) was achieved in four steps: (i) in silico optimization using a numerical simulator, (ii) in vitro testing of the optimization, (iii) in vivo validation in a pilot study, and (iv) validation of the optimized algorithm in a clinical study.
For the first optimization step, a numerical glucose clamp simulator was used. In glucose clamps, glucose is usually measured and infused intravenously within the same compartment. The simulation of a euglycemic glucose clamp, where BG variations are limited, can be done with a single-compartment description of glucose kinetics with an exponential (fairly slow) absorption of the insulin from the subcutaneous tissue and exponential insulin clearance from plasma with a fast rate of elimination. The simulator calculated the BG concentration from the previous BG concentration by using a log-normal profile for insulin action 7 (i.e., for lowering BG) and the optimized algorithm for calculating GIRs (i.e., for increasing BG). In addition, sensor noise was added to the BG values using normally distributed random values with a standard deviation of 0.8 mg/dL (reflecting the measurement error of the ClampArt glucose sensor).
In several reiterating cycles, the UBA was optimized by reducing the aggressiveness of the PID controller until (finally) an improved clamp algorithm (ICA) was developed that reduces oscillations of BG and GIR in silico.
The ICA was then tested in in vitro experiments. In these experiments, a 5 L container filled with a glucose solution was used as glucose reservoir. The original ClampArt device was connected to the container via the original tubing set. A double lumen catheter was used to pump the glucose solution from the container to the ClampArt glucose sensor (mimicking blood glucose sensing) and a commercial infusion tubing set was subsequently used to “infuse” 20% glucose solution via the ClampArt glucose infusion pump into the container. The insulin-induced glucose-lowering effect was simulated in the container by diluting the glucose solution with water infused at variable rates by a computer-controlled pump. The time–action profiles of various insulin formulations (basal, rapid acting) were taken from previous glucose clamp experiments performed at Profil and then programmed into the pump. In addition, endogenous glucose production was simulated by an external glucose infusion pump, which pumped glucose solution into the container at a constant pump rate of 5 mL/h.
To calculate the appropriate amount of 20% glucose solution and to keep the glucose concentration within the container at a target level of 100 mg/dL, the UBA and the ICA were integrated into the ClampArt device. Several in vitro glucose clamps using either UBA or ICA were performed to compare oscillations in BG and in GIR.
On the basis of the successful computer simulations and the corresponding successful in vitro tests, the UBA and ICA were compared with regard to both BG and GIR oscillations in a small in vivo pilot study in five people with type 1 diabetes.
On two study days, each study participant received two different doses (0.3 and 0.4 U/kg) of insulin aspart (NovoRapid; Novo Nordisk, Bagsvaerd, Denmark) under glucose clamp conditions using ClampArt. PDs were assessed for up to 11 h after dosing, and reference BG values were obtained every 15 min. The BG target level was set to 100 mg/dL (5.5 mmol/L).
A confirmation of the results of this pilot study was obtained in a larger clinical study investigating the PD activity of insulin aspart. The study started during the development of the ICA and initially used the UBA for the first glucose clamp experiments. As results of the in silico and in vitro studies as well as the pilot study were promising, it was decided to enroll additional subjects to repeat a number of experiments with the ICA, thereby further improving clamp quality and facilitating a valid calculation and interpretation of PD endpoints. The clinical studies were conducted from December 2013 to August 2014 and carried out according to the International Conference on Harmonization (ICH). They were also approved by the Ethics Committee (Ethics Committee of the Medical Association North-Rhine, Düsseldorf, Germany) as well as the national competent authority (Bundesinstitut für Arzneimittel und Medizinprodukte [BfArM], Bonn, Germany). All participants provided written informed consent before any study-related activities.
Subjects' demographics (age, gender, body mass index, diabetes duration, and total daily insulin dose) are provided in Table 1. In total, 131 glucose clamps (UBA: 87, ICA 44) with type 1 diabetes subjects were performed by means of ClampArt. The target level for all clamps was set to 100 mg/dL (5.5 mmol/L) and clamp duration was 12 h after a single dose of 0.2 U/kg insulin aspart, which resulted in a total clamp duration of 1051 h for UBA and 546 h for ICA.
Data are mean ± standard deviation.
BMI, body mass index; ICA, improved clamp algorithm; TDD, total daily insulin dose; UBA, unmodified Biostator algorithm.
Statistical analysis
Due to the small sample size, only descriptive statistics without statistical comparisons are provided for the in silico, in vitro, and pilot studies. For the larger clinical study, all clamps performed (87 with the UBA and 44 with the ICA) were included in the analysis. After applying a Fourier-filter (bandpass filter 0.01–0.1) to the GIR data sets to eliminate high-frequent sensor noise (not related to the algorithm) and low-frequent changes in GIR (due to the metabolic effect of the insulin), the remaining GIR oscillations were investigated by determining the coefficient of variation for UBA and ICA (CV GIR). In addition, the CVs of the BG values (precision) for UBA and ICA were calculated using all BG values where the algorithm was active, that is, all BG values with corresponding no-zero GIRs (CV BG). Finally, the clamp quality parameter control deviation, that is, the mean absolute relative deviation of BG from the target level when the algorithm is active, and the utility (time with the device being operational) between UBA and ICA were compared. 3
Within each clamp, all GIR and all BG data points, including all outliers, were analyzed. Due to the fact that all four calculated parameters (CV BG, CV GIR, control deviation and utility) showed no normal distribution, a two-sided unpaired Wilcoxon rank sum test was used to calculate the probability that the null hypothesis (equality of the median of the abovementioned four parameters) is true (P-values). The significance level of the test was set to α = 5%. Analyses were done with SAS version 9.4.
Results
In comparison with UBA, ICA numerically reduced the amplitude of oscillations of both BG and GIR in all three test settings (in silico, in vitro, and in the pilot study). In the in silico simulations, ICA reduced the mean amplitude of BG oscillations by 43% and that of GIR oscillations by 66% versus UBA (Fig. 2, top and Table 2). Even slightly higher reductions were observed in the in vitro experiments (Fig. 2, middle and Table 2): The amplitude of BG oscillations was 61% and that of GIR oscillations 76% lower with ICA. Finally, reductions by 35% (BG-oscillations) and 65% (GIR-oscillations) were seen in the in vivo pilot study (Fig. 2, bottom and Table 2).
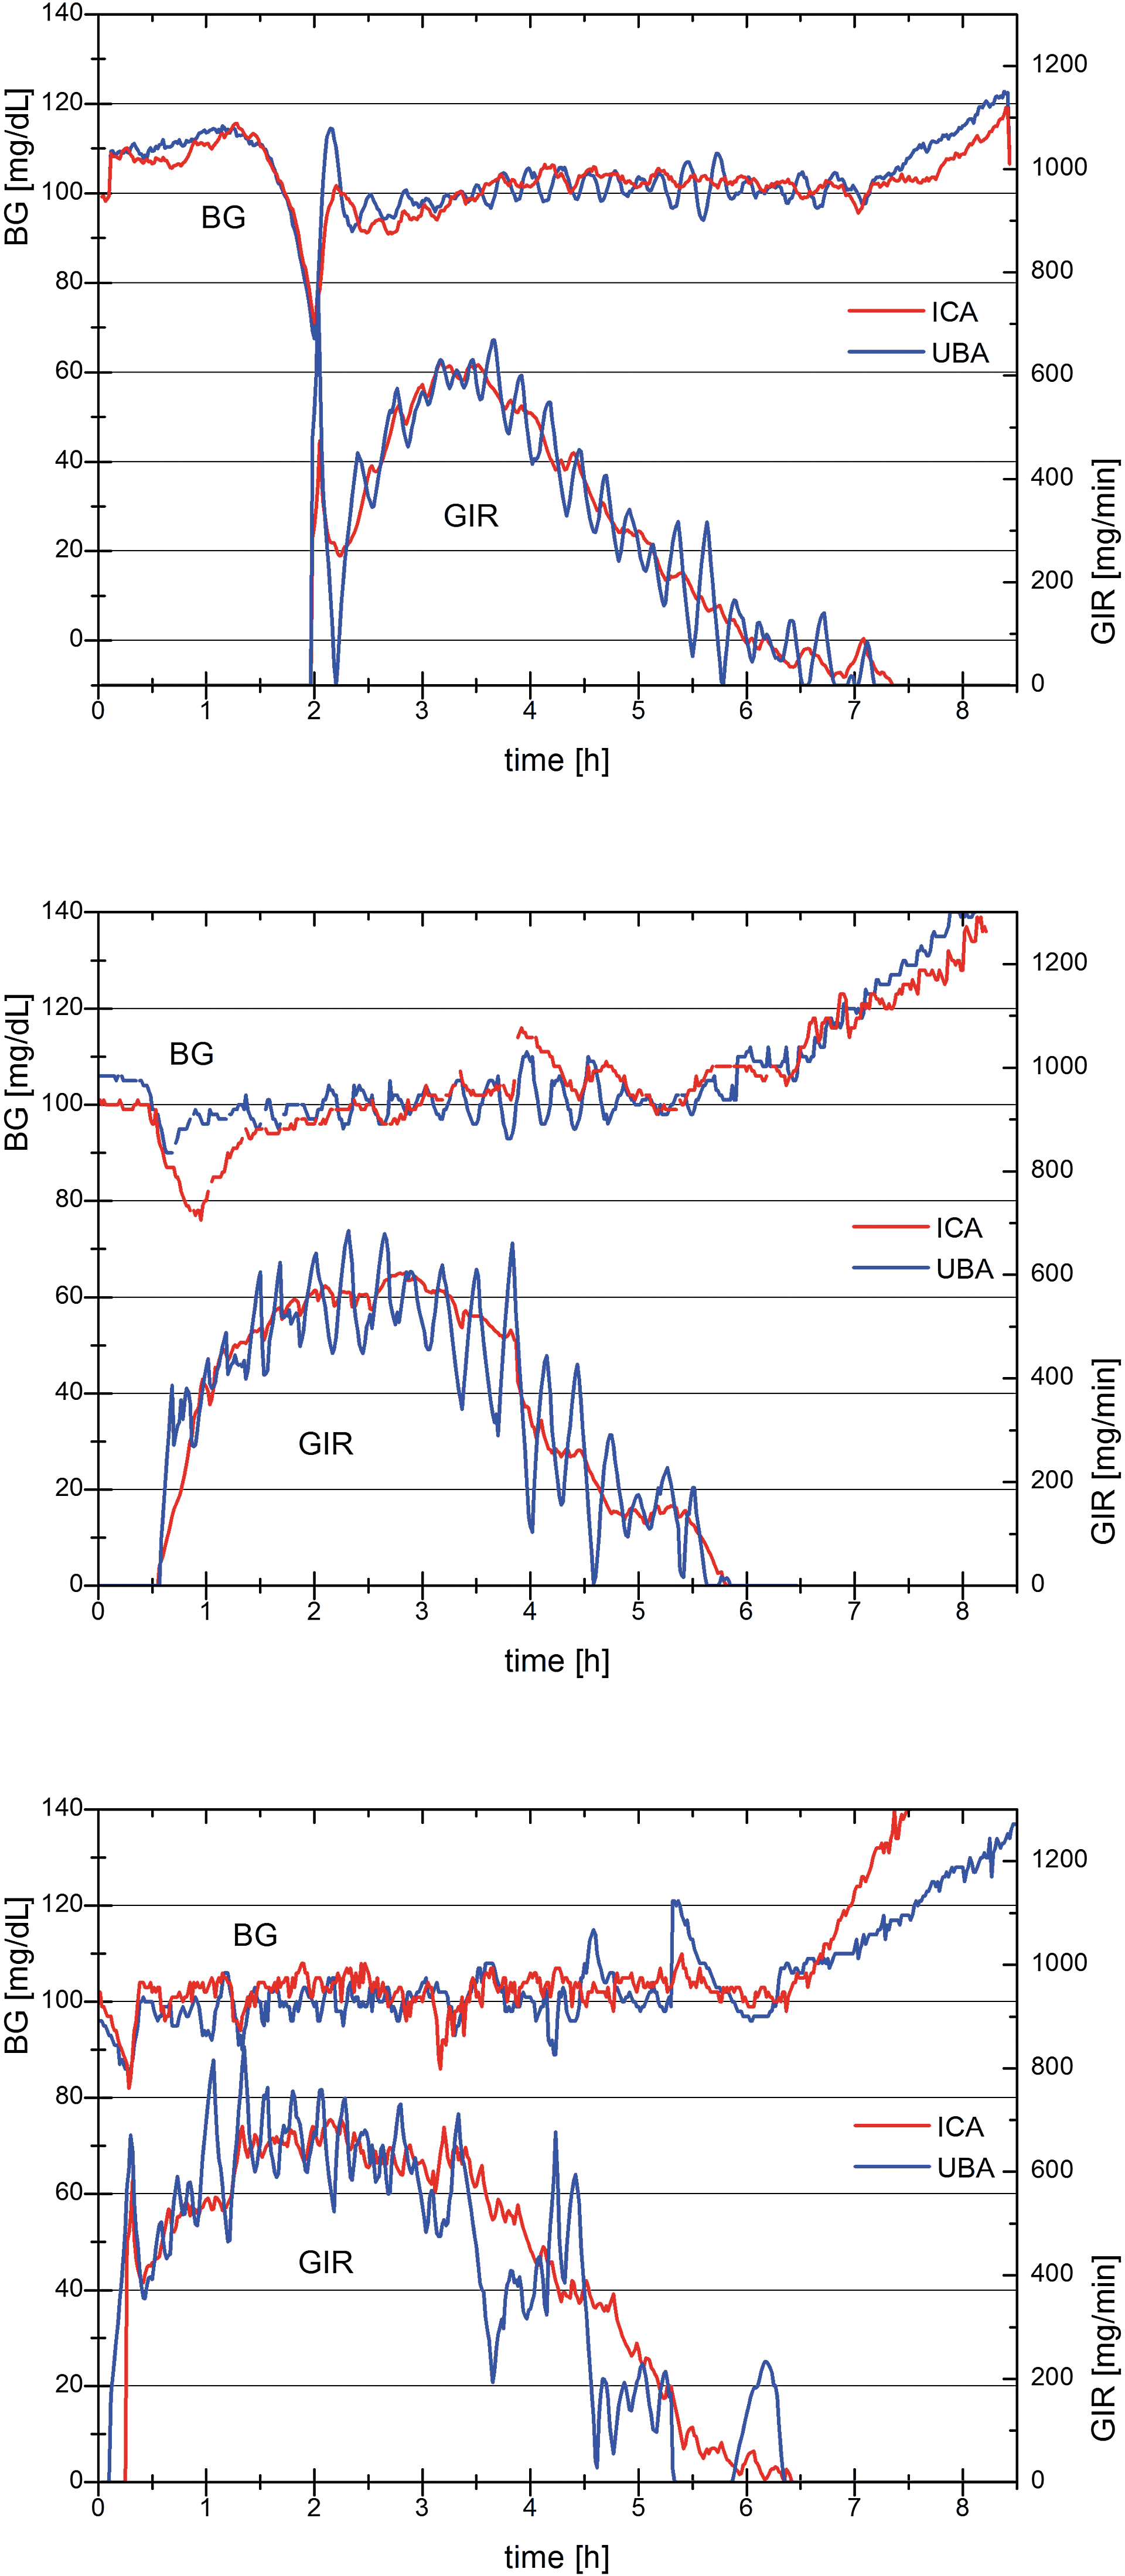
Example results of the in silico (top), in vitro (middle), and in vivo (bottom) comparison of blood glucose and glucose infusion rate during an automated euglycemic clamp. On the left axis, each diagram shows the blood glucose values (top) of a typical glucose clamp for a short acting insulin analogue performed with the two different algorithms (red: ICA, blue: UBA). On the right axis, the corresponding glucose infusion rates (bottom) needed to keep the blood glucose at the target level of 100 mg/dL are shown (red: ICA, blue: UBA). Blood glucose values were obtained every minute and glucose infusion rates were automatically adapted accordingly. No smoothing was applied to either of the curves and no outlier was removed. ICA, improved clamp algorithm; UBA, unmodified Biostator algorithm.
The median CV of the blood glucose values in the larger clinical study was 6.0% with UBA versus a CV of 4.2% with ICA, P < 0.0001 (Fig. 3 and Table 3). The median CV of the GIR-oscillations was likewise markedly reduced: 60.7% with UBA versus 43.5% with ICA, P < 0.0001 (Fig. 3 and Table 3).

Boxplot of the four clamp quality parameters' CV glucose infusion rate (top left), CV blood glucose (top right), control deviation (bottom left), and utility (bottom right). Each diagram displays the results for UBA on the left and those for ICA on the right. Each boxplot shows the median (middle line) and the 25 and 75 percentile (lower and upper line) as the central box as well as the minimum (lower mark) and the maximum (upper mark) value. In addition, the mean value is plotted as a small square. CV, coefficient of variation.
BG, blood glucose concentration; CV, coefficient of variation; GIR, glucose infusion rate; IQR, interquartile range.
Deviations from target level (median control deviations) (Fig. 3, lower left) were excellent with either algorithm (0.6% [UBA] vs. 1.1% [ICA], P = 0.0005, Fig. 3 and Table 3). Likewise, median utility was similar (97% with either algorithm, P = 0.567, Fig. 3 and Table 3). Typical examples of clamps performed with ClampArt are provided in Figure 4 (UBA and ICA, respectively).
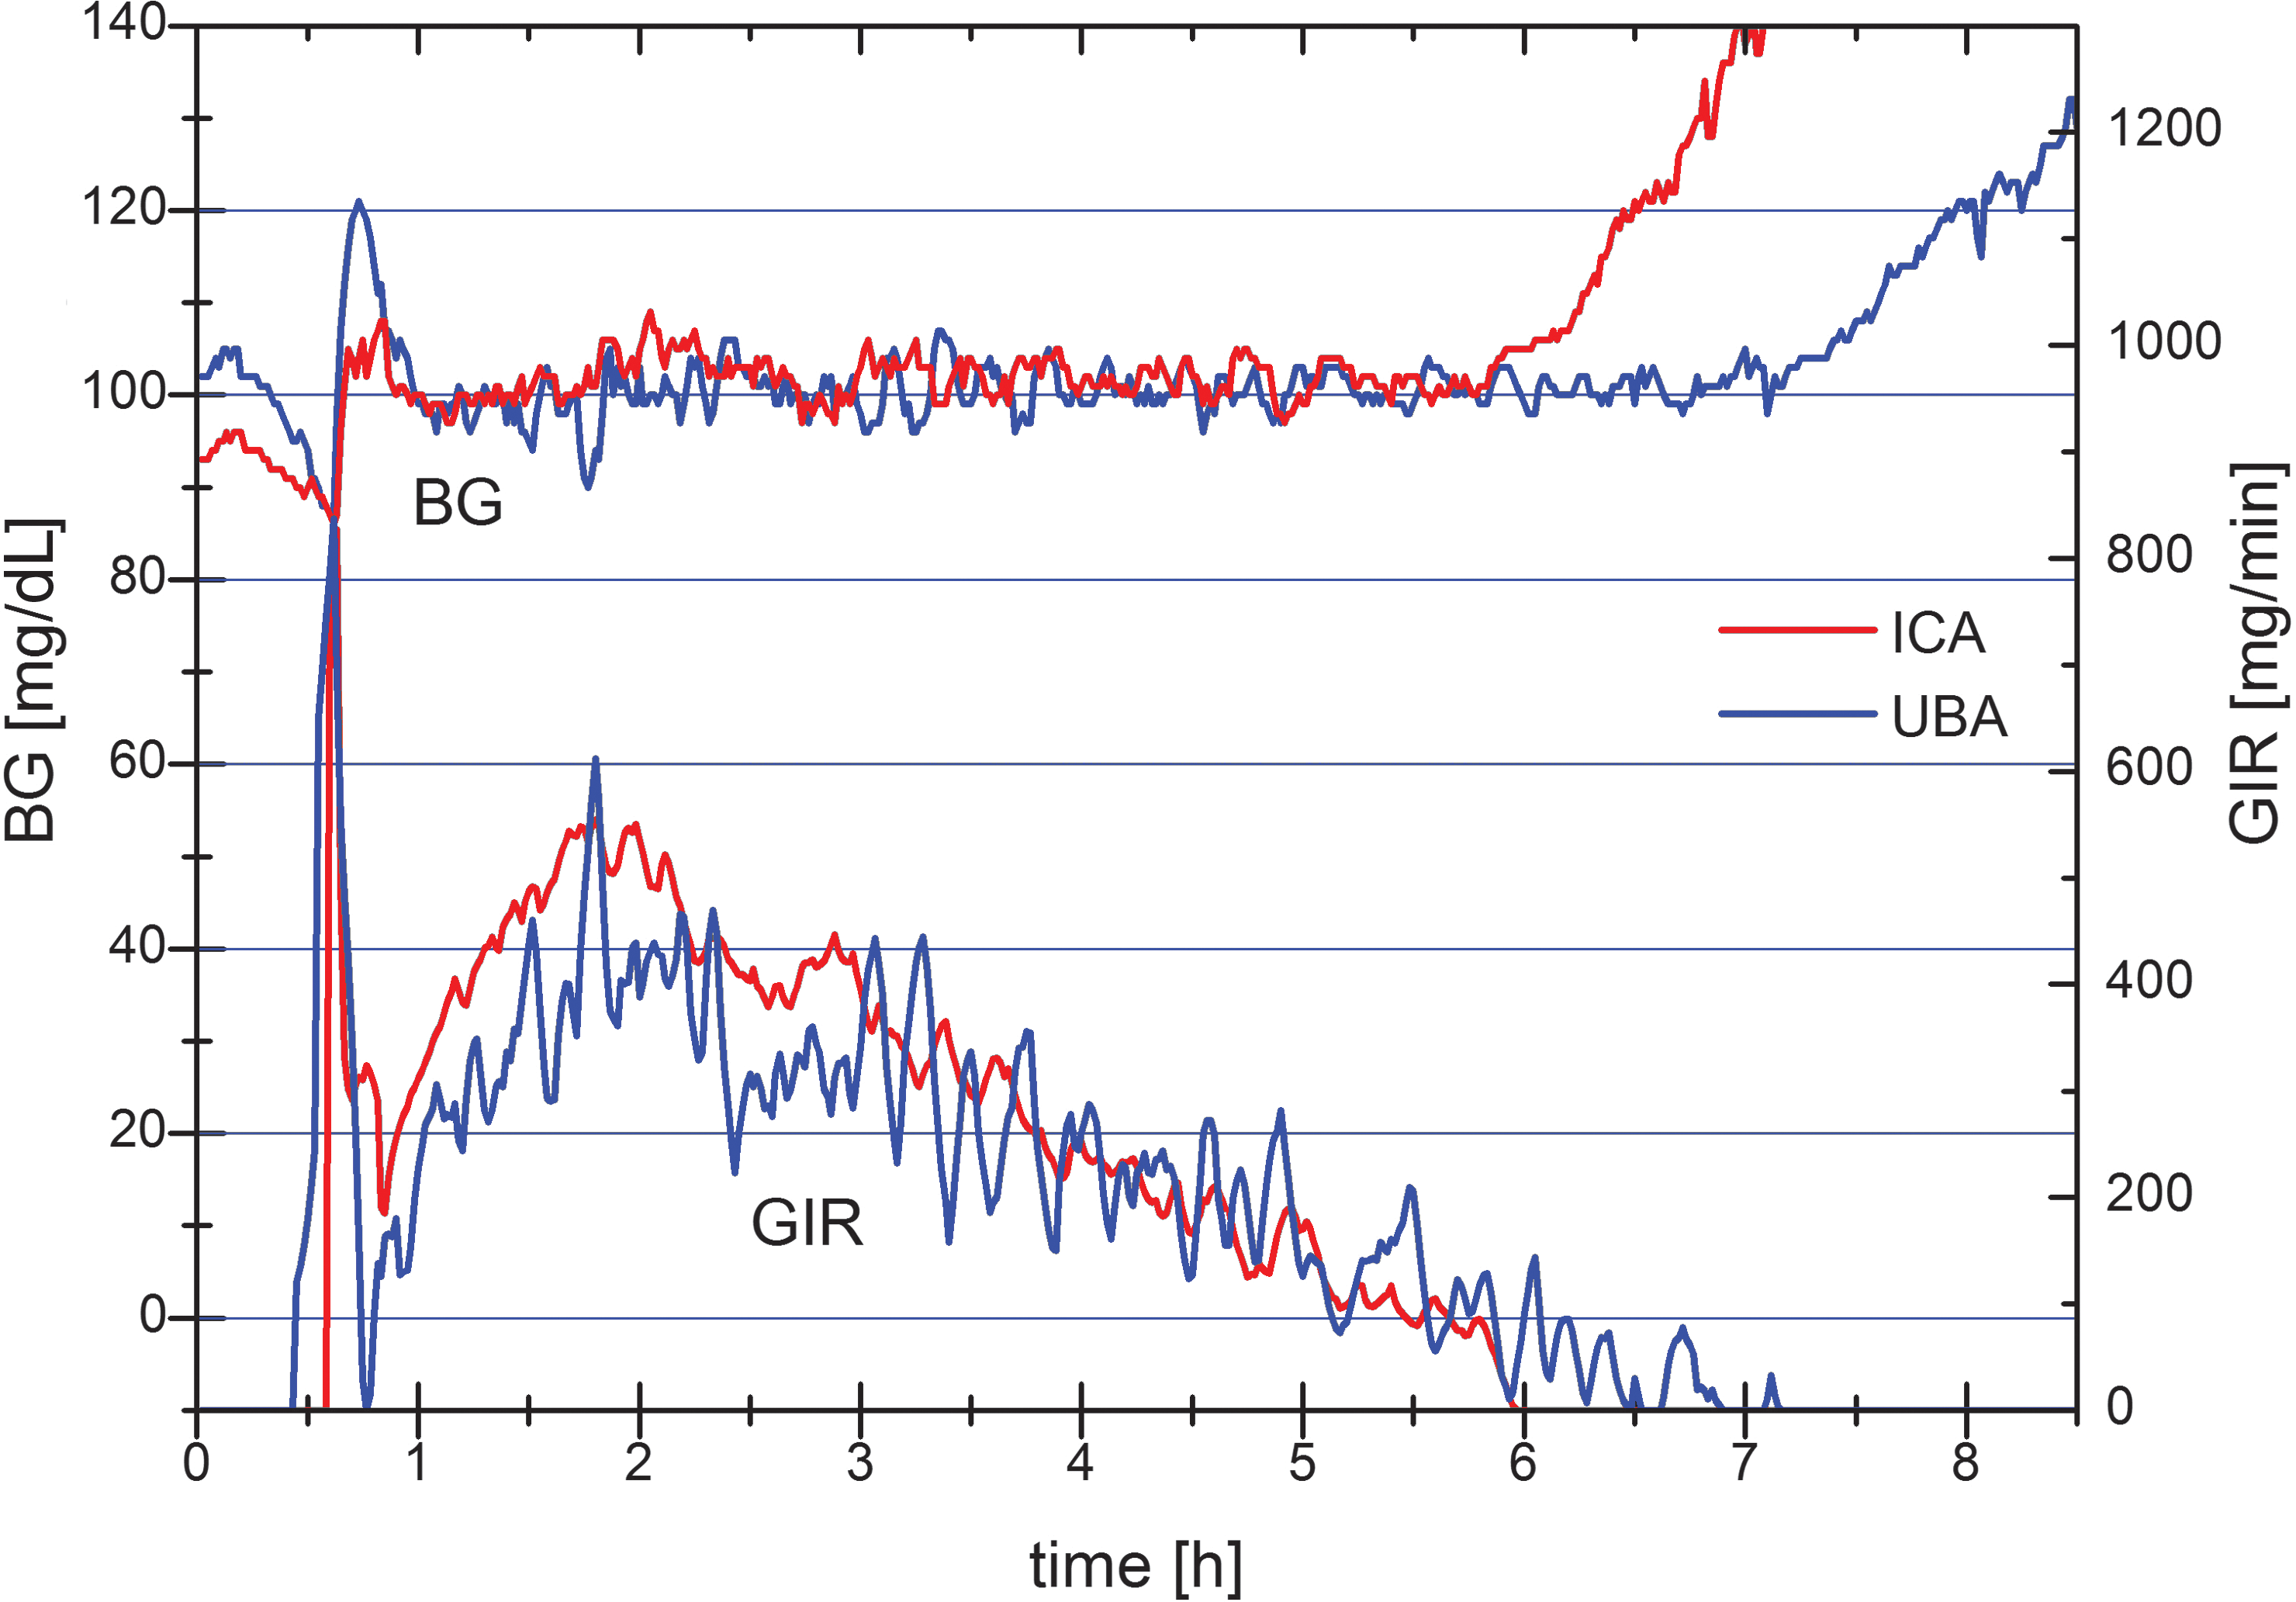
Typical automated euglycemic clamp with a short acting insulin analogue of the clinical trial with ICA (red) and UBA (blue), respectively. On the left axis, the blood glucose values (top) are shown for either algorithm. On the right axis, the corresponding glucose infusion rate (bottom) needed to keep the blood glucose at the predefined target level of 100 mg/dL is shown. Blood glucose values were obtained every minute and glucose infusion rates were automatically adapted accordingly. No smoothing was applied to either of the curves and no outlier was removed.
Discussion
Euglycemic glucose clamps have become the gold standard to assess the PDs of blood glucose-lowering agents (in particular insulins) and insulin administration routes as well as insulin sensitivity. 8,9 To obtain precise and reproducible results, it is important to achieve a high glucose clamp quality by, for example, keeping BG as close as possible to target clamp level. 1 Technically, deviations from the BG target are indicative of a “wrong” GIR, not entirely reflecting the BG-lowering action of the drug to be examined. It is therefore important to report both the mean deviation from target (which could be close to 0 because of high clamp quality, but also because positive and negative deviations from target nullify each other) and the coefficient of BG variation, which alone does not allow an evaluation of clamp quality. Low CVs are indicative of stable BG levels during the clamp. These levels, however, do not necessarily have to be close to target. Thus, smaller deviations from target and smaller BG oscillations around the target level reflect higher clamp quality. While automated glucose clamps should potentially show a higher clamp quality than manual clamps because of more frequent BG measurements and GIR adaptations, the actual quality achieved crucially depends on the ability of the algorithm to keep BG levels close to target. In general, a good compromise has to be found between fast GIR adaptations (to bring BG back to target in case of deviations) and overreactions leading to swings in both BG and GIR. For instance, if the algorithm reacts too aggressively to BG below target level, an overextended amount of GIR will be infused raising BG above the target level. Likewise, if GIR reductions in case of BG above target are too strong, BG will again drop below target. As a result, BG will oscillate around the target level with an amplitude that highly depends on the aggressiveness of the algorithm (the more pronounced GIR changes are, the higher the amplitude of BG oscillations).
The UBA is a good example of an algorithm that might be a bit too aggressive. While mean deviations from target (control deviation) are fairly low, oscillations in both BG and GIR are relatively high. High oscillations in GIR hamper the analysis of the PD profiles, in particular with regard to time-related parameters and maximum GIR. For a reliable assessment of these parameters, GIR profiles often have to be smoothed to substantially reduce GIR oscillations. A later mathematical smoothing, however, introduces other artifacts such as elevated GIR at baseline. 1 To minimize oscillations in both BG and GIR, we therefore tried to optimize the Biostator algorithm for the newly developed ClampArt device.
To avoid performing too many human studies, we started with an in silico optimization of the original Biostator algorithm. With a reiterative optimization of the control parameters of the algorithms, oscillations were improved, finally resulting in the development of an ICA. The superiority of the ICA over the UBA was confirmed by in vitro experiments for which the original ClampArt device was already used to measure glucose concentrations and to infuse glucose. Importantly, the original tubing set was used to test the algorithm with the same time lag as in clinical use. The time delay caused by the blood transfer from the tip of the double lumen catheter to the glucose sensor in clamp studies was, for example, simulated in the experimental design. After the in vitro data confirmed the reduction in GIR- and BG-oscillations was the new algorithm tested in a pilot in vivo clamp study in patients with type 1 diabetes. While the magnitude of the reductions in oscillations varied between the different experimental approaches (in silico, in vitro, and pilot in vivo), it was reassuring that all of them consistently showed an improvement with the ICA versus the UBA.
We therefore used this new algorithm in a larger clamp trial with the rapid-acting insulin analogue insulin aspart. The study showed a substantial improvement in fluctuations with the ICA: the median CV of the BG values (i.e., BG precision) dropped by about one-third from 6.0% to 4.2%. In addition, the ICA showed only less than half the variability in precision as its interquartile range was only 1.4% versus 3.2% with the UBA. Thus, the ICA not only improved precision in BG but also reduced the interclamp differences in clamp quality. In other words, the ICA achieved a higher clamp quality more consistently than did the UBA.
Likewise, GIR fluctuations were also significantly reduced by about one-third (from 60.7% to 43.5%), as was the interquartile range of the GIR variations (from 32.4% to 24.4%), indicating less interclamp variations and a potentially easier analysis of GIR profiles with less need for mathematical smoothing. In contrast, the median control deviation was similar or even numerically higher with the ICA. While the ICA led to numerically higher deviations from target, the observed difference in control deviation was only 0.5%, translating to 0.5 mg/dL at a clamp level of 100 mg/dL. This very small difference was even below the resolution of the glucose sensor used. Overall, BG deviations above and below the target level therefore almost nullify with either algorithm. The amplitude of the deviations of UBA, however, is larger than the deviations caused by ICA. This confirms the assumption that the UBA is a bit too aggressive; while it keeps BG very close to target, it induces larger oscillations in BG and GIR than does the ICA.
Median utility with both algorithms was identical, 97.0% (93.4%–100.0%) with UBA and 97.0% (94.0%–98.8%) with ICA. As the different algorithms should not influence the time when the device is operational, this observation was expected. Approximately 3% of the time during which the device is not operational is mainly due to clotting within the small inner diameter of the tubing system. This is independent of the algorithm used.
One limitation of this study is the test of the new algorithm with only one type of insulin, that is, a rapid-acting insulin analogue. A rapid-acting insulin was chosen because of its fast and pronounced metabolic effect of this insulin formulation. This should be an advantage for the rather aggressive UBA that leads to rapid changes in GIR. Further studies will test the algorithm with other insulin formulations, such as intermediate or basal insulin, which has a lower maximum activity and a steadier metabolic effect over time. In this case, the ICA could potentially be even more advantageous. On the contrary, it is possible that further modifications to the ICA need to be introduced to achieve excellent clamp quality with slower acting insulins.
Additional limitations of our study include the lack of randomization and the open (unblinded) data analysis, which could possibly introduce some bias. However, the study nurses and the research physicians involved in the performance of the glucose clamps were blinded to the algorithm, and all available data were included in the final analysis, even if they were clearly affected by events such as clotting, leakage of the tubing material, and movements of the subjects' arm. Thus, while lack of randomization and the sequential rather than a crossover and open study design certainly are important limitations, there was little room for analysis bias. Investigator bias can also be excluded in an automated clamp study as GIR is regulated by the device only.
Furthermore, there were no substantial differences between the demographic data of the study participants as shown in Table 1. The similar total daily insulin dose of both subject groups also indicates a similar level of insulin resistance. Nevertheless, it cannot be excluded that there were differences between the study participants beyond the mere number of subjects per group and that this together with design issues mentioned previously might have impacted the statistical power of the study. Still, despite these limitations, we did observe highly statistically significant differences between the two algorithms in the clinical study and the findings in the clinical study are in line with the observations in the numerical simulations and the in vitro setup indicating that the ICA really improves the oscillations in GIR and BG.
In conclusion, our data show that the well-established Biostator algorithm for the calculation of GIR in automated glucose clamp studies is successful in achieving mean BG close to the predefined clamp target glucose level, although at the expense of relatively high oscillations in BG and GIR. The improved algorithm, now implemented in ClampArt, a modern, CE-certified glucose clamp device, significantly reduced the amplitude of the oscillations in both BG and GIR in PD clamp assessments of a rapid-acting insulin analogue. This was achieved without compromising clamp quality or utility. The optimized algorithm will therefore be used for future glucose clamp studies. Additional studies will investigate the suitability of the algorithm for other settings such as insulin sensitivity clamps or PD investigations of slower acting insulins.
Footnotes
Acknowledgments
We are very grateful to Silke Zeugner, Profil, for performing the in vitro experiments and the clinical staff at Profil for performing the in vivo experiments. C.B. and T.H. designed the study. C.B. and M.K. analyzed the data, wrote the manuscript and, together with T.H., contributed to the discussion and interpretation of results. All authors reviewed and approved the manuscript. No funding was received for this trial.
Author Disclosure Statement
M.K., T.H., and C.B. are employees and T.H. is shareholder of Profil, Neuss, Germany, the private research institute where ClampArt was developed and is in use.