
Abstract
Background:
The evaluation of brown adipose tissue (BAT) and its role in metabolism and obesity remains an important topic in the recent literature. This study evaluated the influence of the BAT triglyceride content measured by proton magnetic resonance (MR) spectroscopy in patients with type 2 diabetes mellitus (DM2) and prediabetes on insulin sensitivity.
Methods:
A total of 25 patients with DM2 and prediabetes (45.9 ± 10.1 years old, body mass index [BMI] of 31.6 ± 5.4 kg/m2) underwent anthropometric measurements (BMI), insulin sensitivity analysis (M value during euglycemic hyperinsulinemic clamp and homeostasis model assessment of insulin resistance), proton MR spectroscopy, and blood tests (total cholesterol, low-density lipoproteins, high-density lipoproteins, and triglycerides). The relationship between the triglyceride content in the supraclavicular fat depot and insulin sensitivity, anthropometric measurements, and blood test results was assessed.
Results:
The triglyceride content in the supraclavicular fat depot varied between 79.2% and 97.1% (mean: 92.6% ± 4.2%). The triglyceride content in the subcutaneous white adipose tissue of the neck was significantly higher (85.3%–99.3%; mean: 95.5% ± 2.9%; P = 0.0007). The triglyceride content in the supraclavicular fat depot exhibited a significantly moderate correlation with the BMI (r = 0.64; P = 0.0009). A significant weak negative correlation between the supraclavicular fat content and M value was revealed (r = −0.44; P = 0.002). Patients with high insulin resistance (IR) had a higher triglyceride content in the supraclavicular fat depot than patients with normal and lower IR (94.3% ± 2.0% vs. 90.4% ± 5.2%; P = 0.02).
Conclusions:
Reducing the BAT content in the supraclavicular fat depot can influence the development of IR in patients with DM2 and prediabetes.
Introduction
T
Several articles have reported the successful characterization of BAT and WAT both in animals, 2 excised adipose tissue samples, 3 and humans using positron emission tomography–computed tomography (PET-CT), 4 magnetic resonance imaging (MRI), 5 and magnetic resonance (MR) spectroscopy. 6 PET combined with CT can determine BAT by radiolabeled glucose uptake. In addition, PET examination requires BAT metabolic activation using a cold probe, otherwise inactive BAT will remain invisible. Thus, 18 F-FDG-PET has increasingly been used to estimate the BAT activity under physiologically meaningful conditions, such as a mild cold. 7 MR imaging and MR spectroscopy can determine both activated and inactive BAT. However, the possibility of calculating the BAT mass without a functional assessment is the main disadvantage of the MR techniques.
MR spectroscopy is successfully used for the determination of the lipid content in the liver 8,9 of patients with liver steatosis. Moreover, the water peak and lipid peak ratios are strongly correlated with liver triglyceride content. A similar technique can be used for calculating the water content of fat tissues. While WAT contains minimal water, the water concentration of BAT is significantly higher. The most prominent BAT depot is localized within the supraclavicular area. 10 The triglyceride and water content ratio in the supraclavicular fat depot is associated with the BAT concentration, regardless of its current activation status.
Several studies describing the supraclavicular triglyceride content determined by MRI in comparison with PET-CT 11 have been published. In addition, a histologic analysis of biopsy specimens in patients who underwent PET-CT 12 or MR spectroscopy 6 for supraclavicular fat characterization has been reported.
Most BAT researchers are focused within the areas of obesity and lipid metabolism. However, Orava et al. demonstrated that BAT is highly insulin sensitive and the BAT metabolic activity correlates with the whole-body insulin sensitivity. 13 This supports the need to study BAT in patients with diabetes mellitus. 14 Raiko et al. demonstrated that the BAT triglyceride content is associated with decreased insulin sensitivity in healthy volunteers without diabetes and other diseases, and with normal glucose tolerance. 6 However, assessment of the BAT triglyceride content and insulin sensitivity in patients with type 2 diabetes mellitus (DM2) remains unclear.
In this study, we sought to evaluate the triglyceride content in BAT using proton MR spectroscopy in patients with DM2 and prediabetes. A secondary objective of this study was to compare these data with insulin sensitivity, clinical laboratory data, and anthropometric measurements.
Methods
Twenty-five patients with DM2 and prediabetes aged from 28 to 64 years (mean ± standard deviation [SD]: 45.9 ± 10.1 years) with a body mass index (BMI) between 19.7 and 43.7 kg/m2 (31.6 ± 5.4 kg/m2) were included in the study. The participants were screened for their overall health status, smoking, alcohol or drug use, and recent medication or supplement use.
Participant inclusion criteria were as follows: between 18 and 65 years of age, newly diagnosed with DM2, impaired fasting glucose, or impaired glucose tolerance. 15
Patients exhibiting disease onset in a state of ketoacidosis, who received glucose-lowering therapy, with any oncological diseases in anamnesis, or had experienced an acute inflammatory process within the last month were excluded from the study.
Informed written consent was obtained from all participants before their inclusion in the study.
All patients underwent anthropometric measurements (BMI assessment), insulin sensitivity analysis (M value during euglycemic hyperinsulinemic clamp and homeostasis model assessment of insulin resistance [HOMA-IR]), proton MR spectroscopy, and blood tests (total cholesterol, low-density lipoproteins [LDL], high-density lipoproteins [HDL], and triglyceride concentrations).
The euglycemic hyperinsulinemic clamp was initiated at 09.00 h and lasted for 4 h, with a continuous infusion of regular insulin at a constant rate of 1 mIU/kg/min. 16 For the duration of the clamp study, plasma glucose was maintained at 5.0–5.6 mmol/L by a concomitant intravenous infusion of 20% glucose, based on bedside plasma glucose measurements every 5 min. Plasma glucose was measured immediately at the bedside with a Hemocue Glucose Analyzer (Hemocue, Ängelhdm, Sweden). Glucose uptake during the insulin clamp (M value) was calculated as an average of the amount of glucose (mg/kg/min) required to maintain euglycemia during the last 30 min of the clamp study. In addition, for calculating the HOMA-IR, insulin and glucose assays were performed after an overnight fast before the clamp studies.
Blood samples for glycated hemoglobin (HbA1c) and fasting lipid profiles were obtained immediately before the initiation of the clamp study.
MR spectroscopy was performed on a 3T human whole body scanner with a dedicated 16-channel neck phased array coil at a room temperature of ∼25°C. A single voxel spectroscopy approach and Point RESolved Spectroscopy pulse sequence were used. MR spectra were acquired from three volumes (left and right supraclavicular fat depots and the subcutaneous WAT of the neck). Volume positioning for MR spectroscopy is depicted in Figure 1.

Volumes positioning for MR spectroscopy in the left supraclavicular fat depot
A voxel size of 10 × 10 × 10 mm was selected. Standard spectroscopic parameters included TR = 2000 ms, TE = 50 ms, bandwidth = 2000 Hz/cm, and number of repetitions = 50. There was no fat or water saturation. Spectra processing (noise filtering, baseline phase correction, and peak fitting) was performed using SpektroView software (Philips Medical Systems, the Netherlands). The fat spectra of the supraclavicular fat depot and subcutaneous WAT of the neck with major peaks indicated are presented in Figure 2.
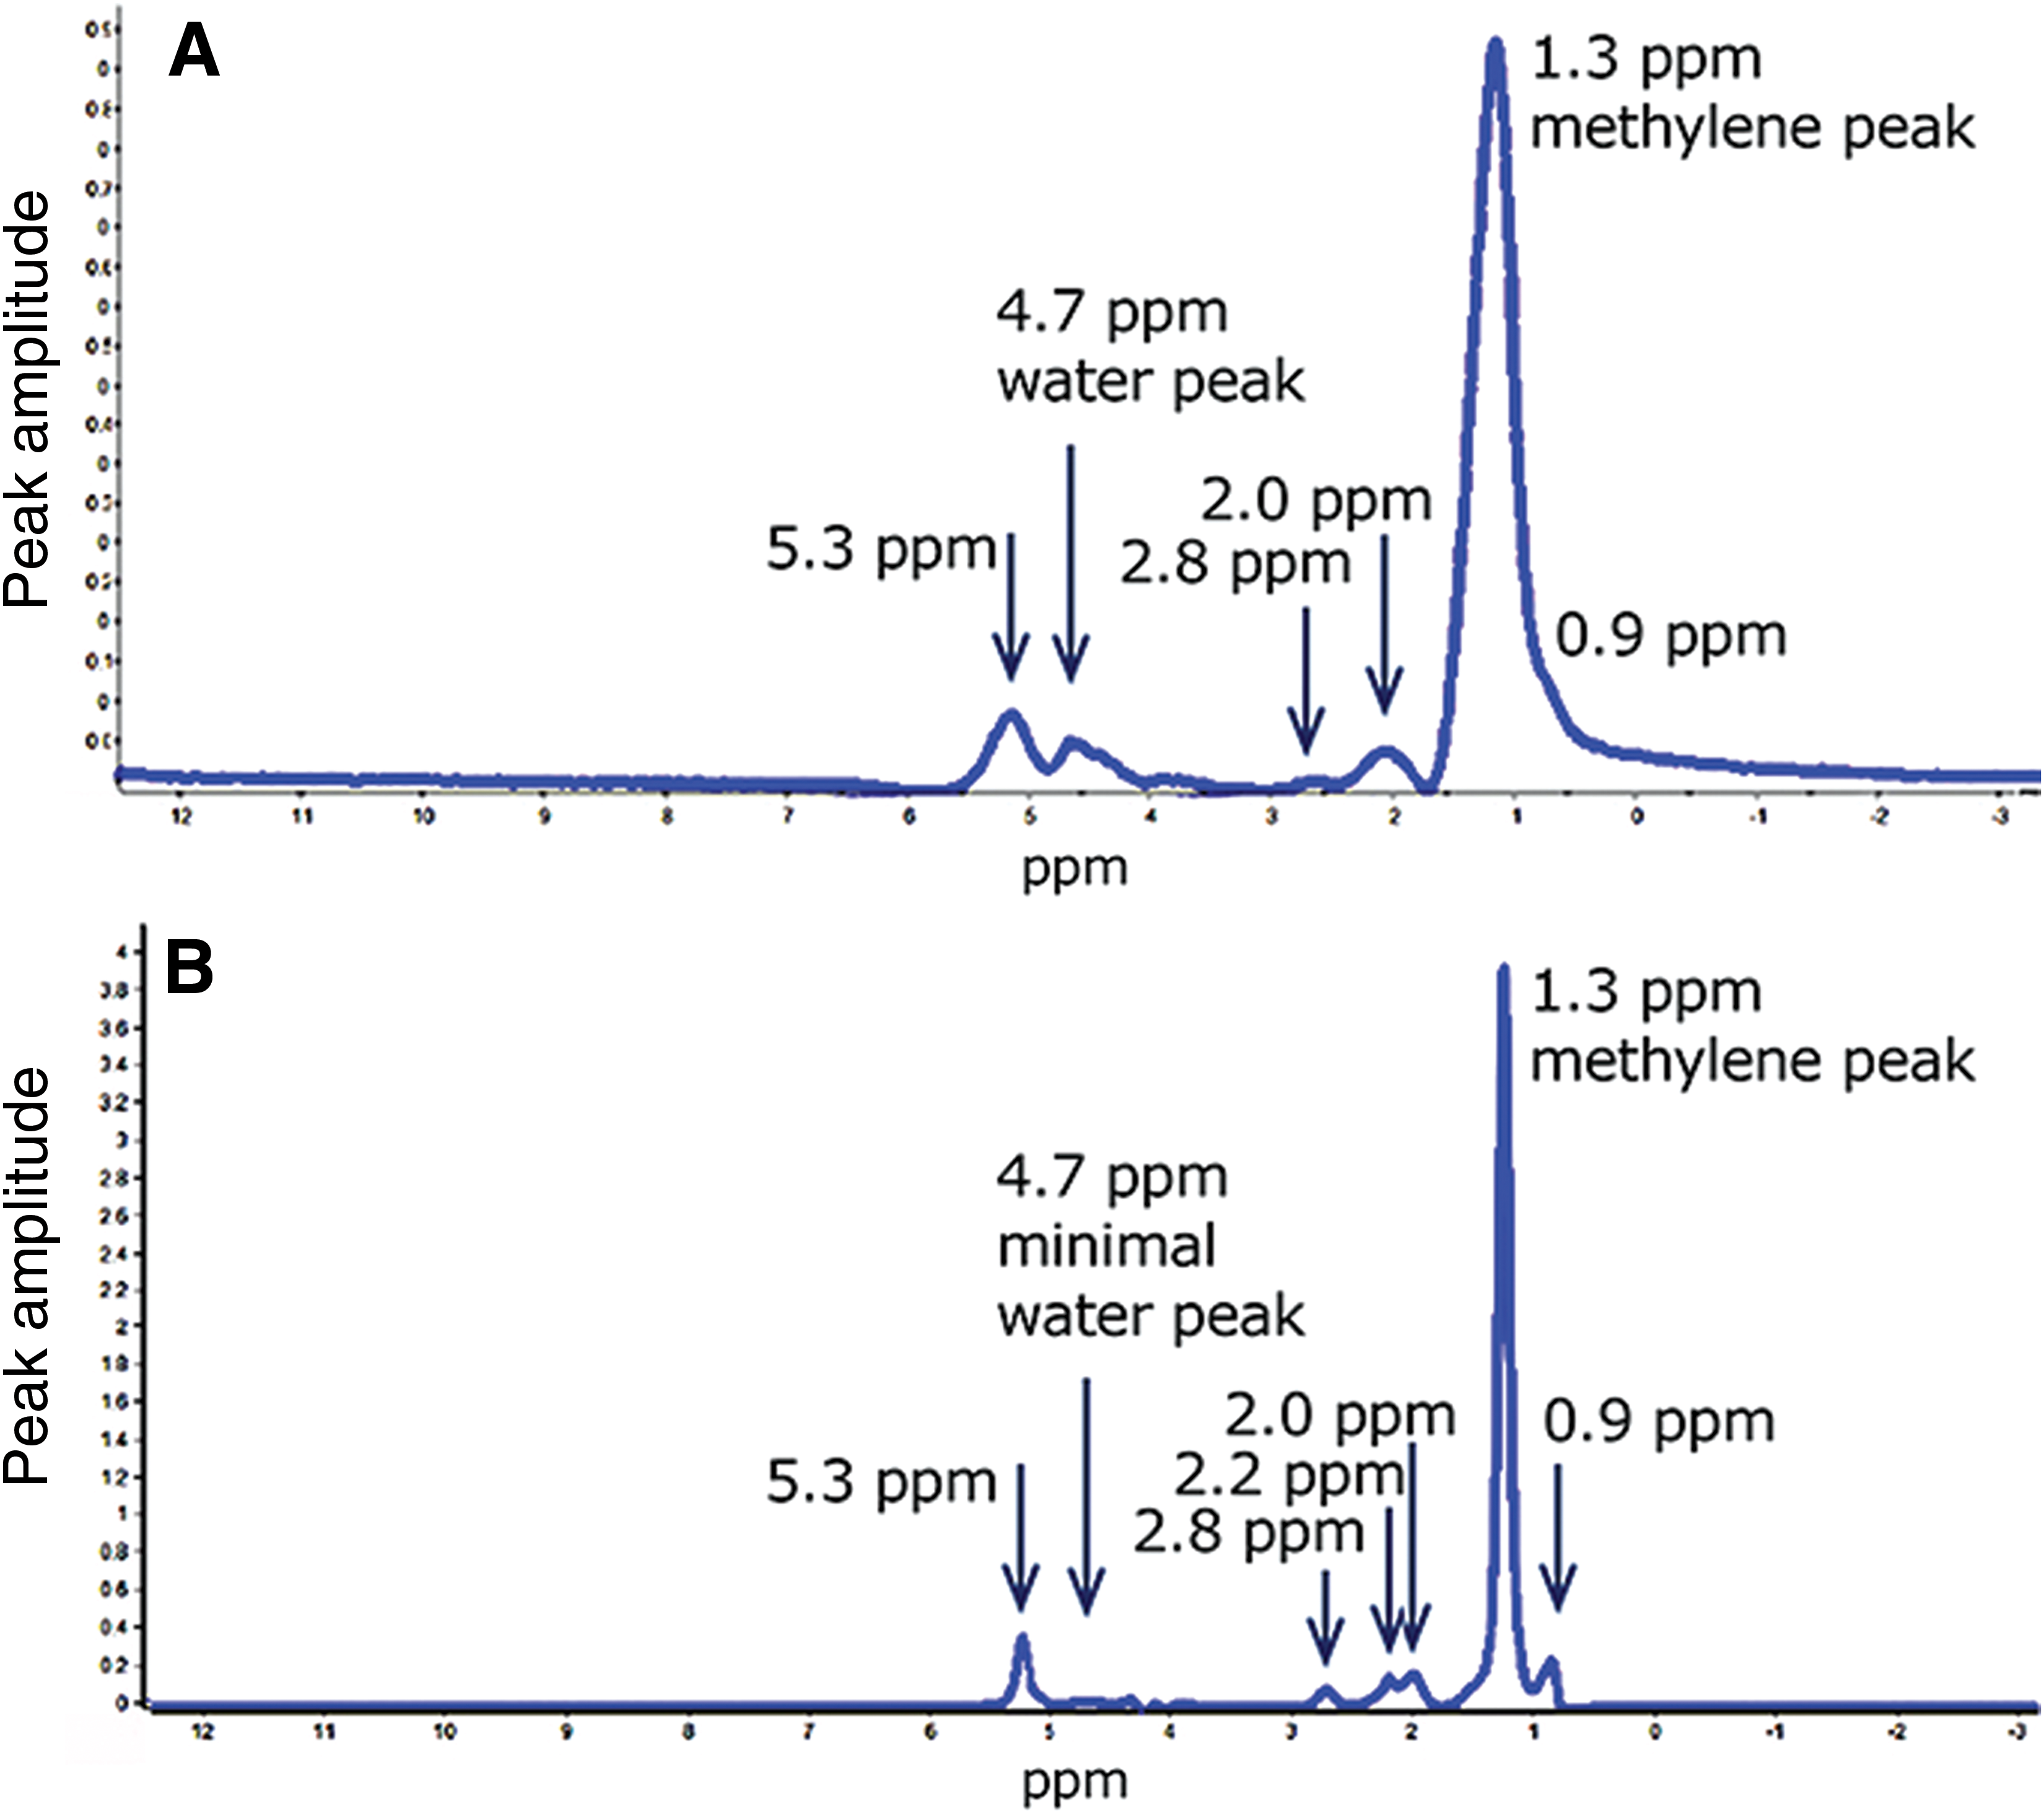
MR spectra of fat tissue in the left supraclavicular fat depot
The area under the methylene-CH2-peak (1.3 ppm) and area under the water peak (4.7 ppm) were calculated. 17 The adipose tissue triglyceride content was determined as the ratio of peak areas: fat peak/(fat peak + water peak) × 100%. Two spectra for the right and left supraclavicular fat depots and one spectrum for the subcutaneous WAT of the neck were processed for each patient. The mean value of adipose tissue triglyceride content in the right and the left supraclavicular regions was used for further analysis.
Statistical methods
Descriptive data are presented as the mean ± SD. Statistical analysis was performed using Statistica software (Statsoft). A Spearman rank correlation and nonparametric Mann–Whitney U tests were used for analysis.
Results
The triglyceride content in the supraclavicular fat depot varied between 79.2% and 97.1% (mean: 92.6% ± 4.2%). The triglyceride content in the subcutaneous WAT of the neck was significantly higher (85.3%–99.3%; mean: 95.5% ± 2.9%; P = 0.0007).
The triglyceride content in the supraclavicular fat depot demonstrated a significant moderate correlation with the BMI (r = 0.64; P = 0.0009). A significant weak negative correlation between the supraclavicular fat content and M value was revealed (r = −0.44; P = 0.002). Figure 3 illustrates these correlations in scatterplots.
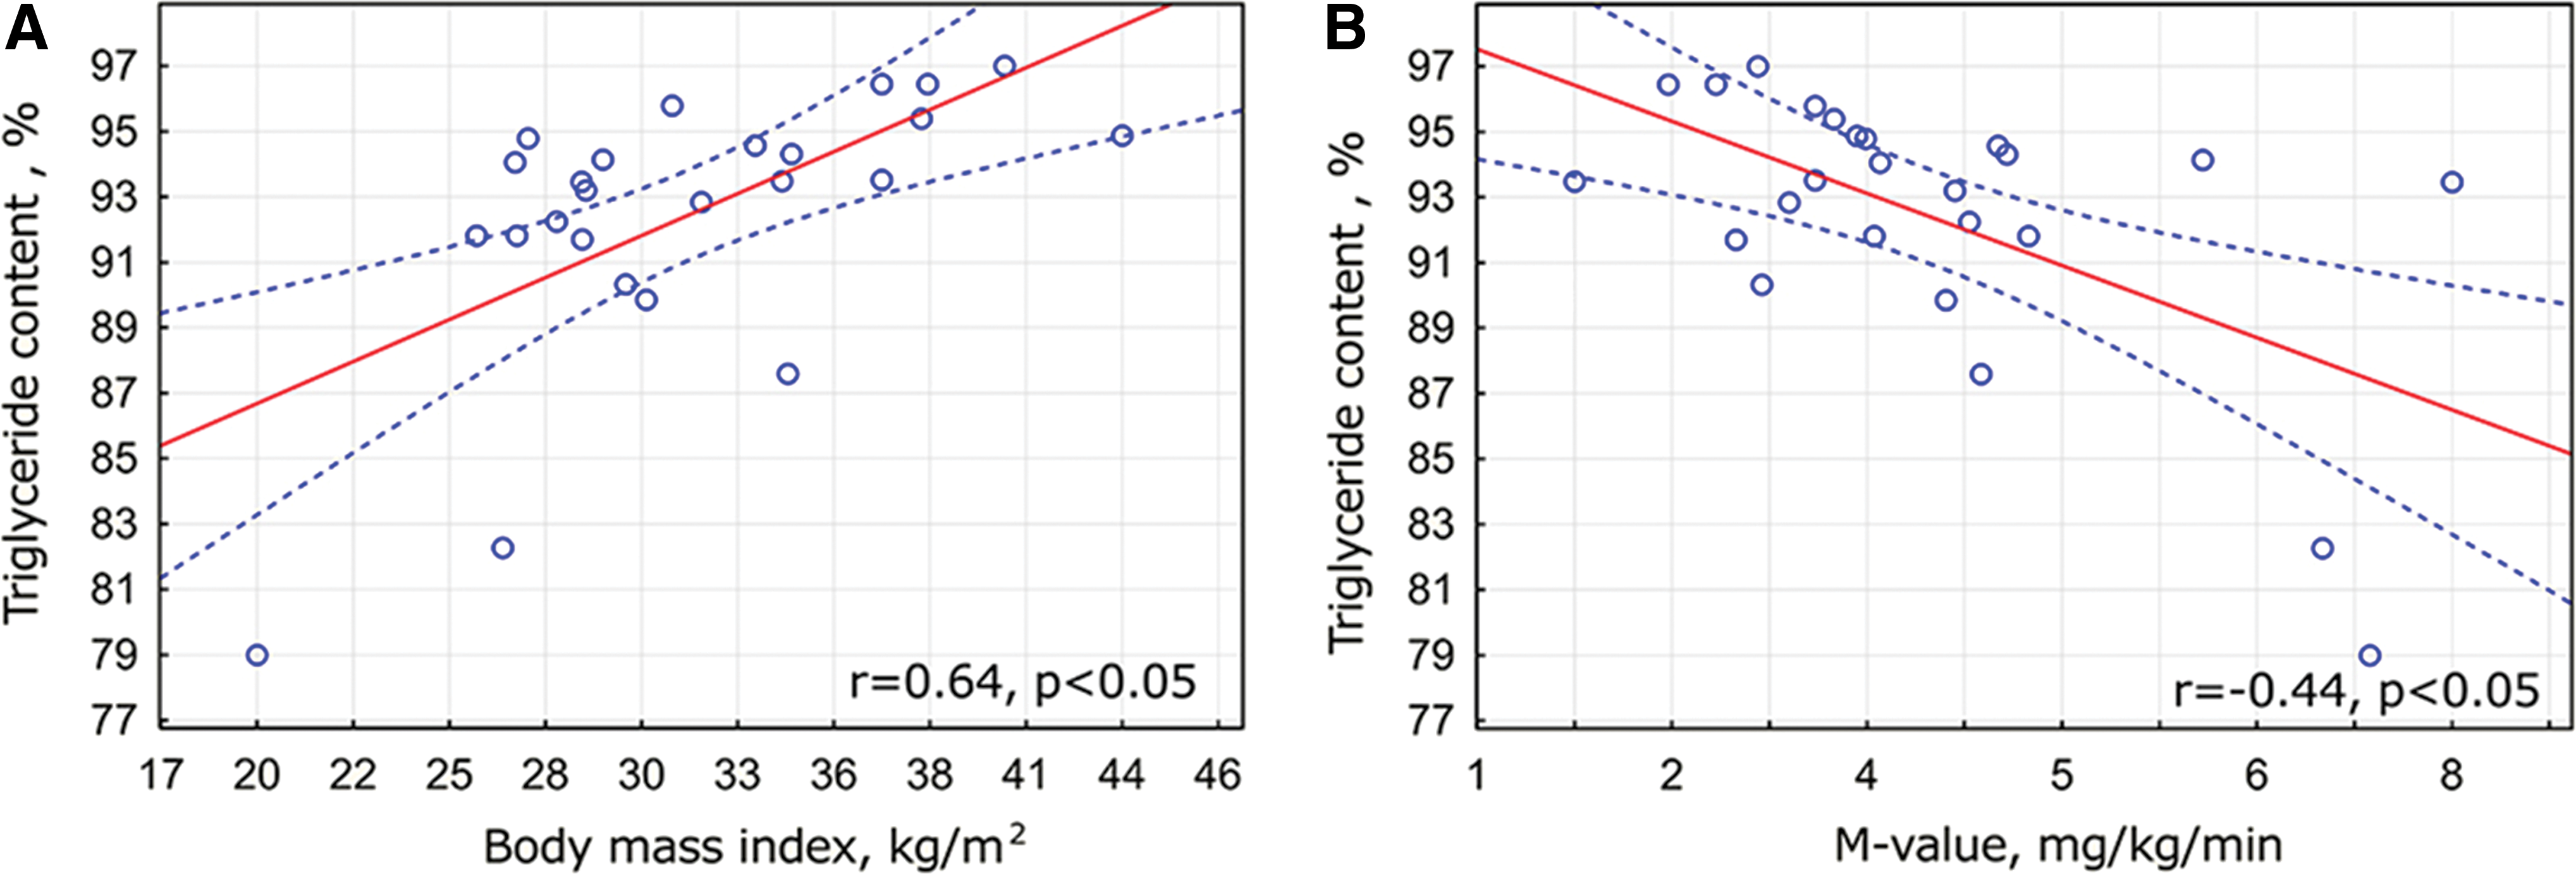
Significant correlation of the triglyceride content in supraclavicular fat depot with body mass index
All patients were divided into two groups depending on the triglyceride content in the supraclavicular fat depot (Table 1). A total of 10 patients with a supraclavicular triglyceride fraction <93% (mean: 89.1% ± 4.7%) were included in the first group and 15 patients with supraclavicular triglyceride content >93% (mean: 94.9% ± 1.2%) formed the second group. The cutoff point of 93% was used to maintain comparable group sizes. The first group consisted of patients with higher BAT content in the supraclavicular fat depot. The second group was considered to comprise patients with predominately WAT in the supraclavicular fat depot.
Data are presented as mean ± SD values.
BMI, body mass index; HbA1c, glycated hemoglobin; HDL, high-density lipoproteins; HOMA-IR, homeostasis model assessment of insulin resistance; LDL, low-density lipoproteins; MR, magnetic resonance; NS, not significant; SD, standard deviation; SD, standard deviation; TG fat depot, the triglyceride content in supraclavicular fat depot measured by MR spectroscopy; TG neck, the triglyceride content in the subcutaneous WAT of the neck measured by MR spectroscopy; WAT, white adipose tissue.
The two groups did not have any significant differences regarding age, triglyceride content in the subcutaneous WAT of the neck, or cholesterol, triglyceride, LDL, and HDL blood levels. In addition, the two insulin sensitivity indexes (M value and HOMA-IR) did not differ significantly between the groups. Patients with higher supraclavicular BAT content were associated with a lower BMI (28.2 ± 4.0 vs. 33.9 ± 5.2 kg/m2; P = 0.01) and lower blood cholesterol levels (5.4 ± 1.2 vs. 6.4 ± 1.4 mmol/L; P = 0.046) compared to the patients with predominately WAT in the supraclavicular fat depot.
All patients were also divided into two groups depending on the M value (Table 2). There were 14 patients with a high degree of insulin resistance (IR) (M value <4; mean: 2.9 ± 0.6 mg/kg/min) included in the first group and 11 patients with a normal and low degree of IR (M-value >4; mean: 5.2 ± 1.3 mg/kg/min) formed the second group. The fat spectra of the supraclavicular fat depot in patients from the first and the second groups are shown in Figure 4.
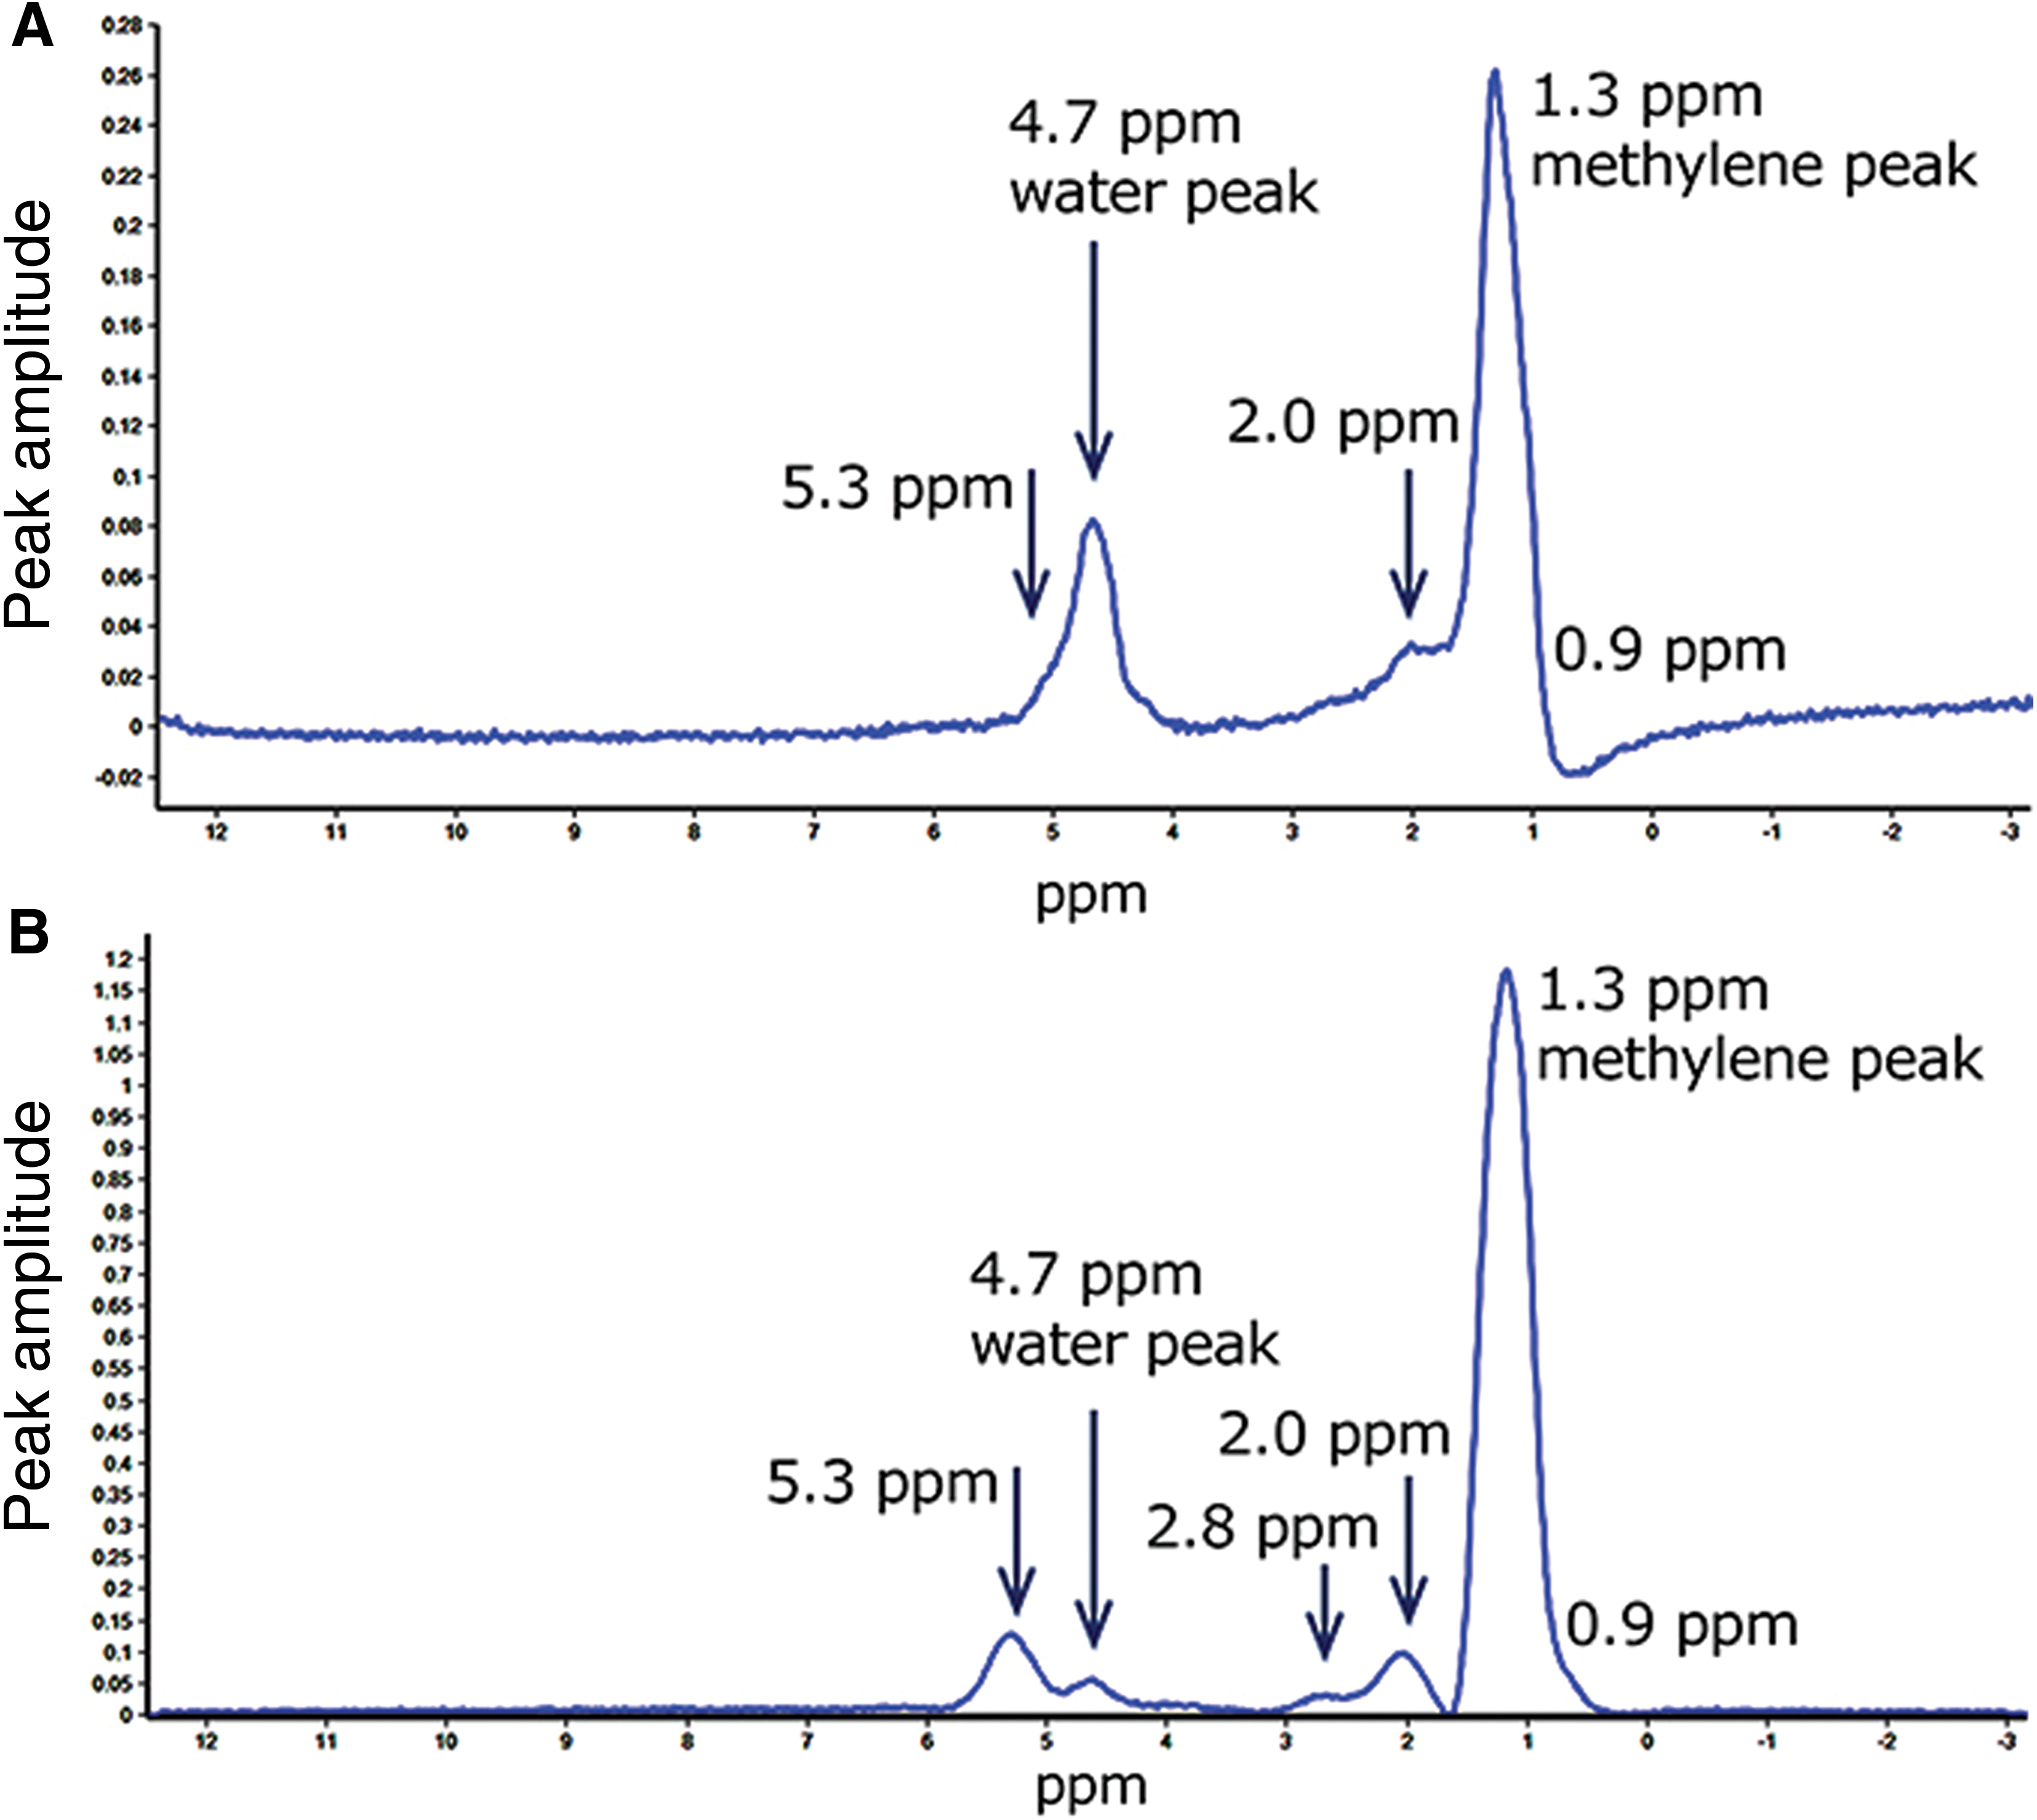
MR spectra of fat tissue in the left supraclavicular fat depot in the patient with normal and low degree of insulin resistance, M value = 7.0 mg/kg/min, left supraclavicular triglyceride content = 79.2%
Data are presented as mean ± SD values.
Patients with a high degree of IR had higher triglyceride content in the supraclavicular fat depot compared to the patients with a normal and lower degree of IR (94.3% ± 2.0% vs. 90.4% ± 5.2%; P = 0.02). This means that low M values were predominately associated with WAT in the supraclavicular fat depot and high M values were observed in patients with a higher content of supraclavicular BAT.
Patients from the first group were significantly younger than those from the second group (40.9 ± 8.3 vs. 52.4 ± 8.5 years; P = 0.005) and they had significantly higher blood triglyceride levels (3.98 ± 5.98 vs. 1.61 ± 0.93 mmol/L; P = 0.02). There were no significant differences in the triglyceride content in the subcutaneous WAT of the neck, HOMA-IR, and LDL and HDL cholesterol levels between the two groups.
Discussion
In this study, the triglyceride content in the supraclavicular fat depot in patients with DM2 and prediabetes was evaluated. The supraclavicular lipid content in our study was higher compared with the results obtained in healthy adults, 6 infants, 18 and newborns. 19 This supports the theory that BAT influences glucose and insulin metabolism and plays a protective role in the pathogenesis of diabetes mellitus.
A significant weak negative correlation between the supraclavicular fat content and M value established in this study also indicates that patients with BAT in the supraclavicular fat depot had higher insulin sensitivity.
Significant differences in the M values and HOMA-IR in patients with supraclavicular triglyceride content of greater or less than 93% were not established, possibly due to insufficient sample size or an inadequate cutoff point. However, selecting another cutoff point led to incomparable group sizes due to poor quantities of BAT in patients with DM2 and prediabetes.
WAT was predominately detected in the supraclavicular fat depot of patients with a high degree of IR. Moreover, a lower supraclavicular triglyceride content was found in patients with normal and lower degrees of IR. These findings confirm the important role of BAT in the pathogenesis of diabetes mellitus.
The association between BAT and BMI was reported in previous studies. 12,20 Patients with a higher BAT content in the supraclavicular depot had a lower BMI. This suggests a positive influence of BAT in the prevention of obesity in patients with DM2.
Our results suggest that the presence of BAT can improve insulin sensitivity and glucose metabolism in individuals at a high risk of carbohydrate disorders. It is known that the activation of UCP1 in response to different stimuli (e.g., cold and influence of some hormones, such as fibroblast growth factor 21 [FGF21] or irisin) results in increased glucose and free fatty acid oxidation leading to heat generation, as well as hypoglycemic and hypolipidemic effects, which can significantly improve insulin sensitivity. 21 If the BAT (over 70 mL) remains chronically active, it could dispose of ∼23 g of glucose in 24 h. 22 Future research is required to investigate the correlation between different types of carbohydrate disorders (e.g., LADA, MODY, and rare lipoatrophic diabetes), insulin sensitivity, and BAT. Thus, BAT may be a potential therapeutic target for the prevention and treatment DM2 and prediabetes.
Conclusion
In summary, MR spectroscopy can be used to evaluate BAT in patients with DM2 and prediabetes. Our findings suggest that reducing the BAT content in the supraclavicular fat depot can influence the development of IR in such patients. Future research should examine whether MR spectroscopy may be useful to choose candidates who will benefit from BAT activation therapy. 23
Footnotes
Acknowledgment
The research was supported by Russian Science Foundation (project No. 14-25-00181).
Author Disclosure Statements
No competing financial interests exist.