
Abstract
Objective:
Self-monitoring of blood glucose (BG) is an essential part of diabetes therapy. Accurate and reliable results from BG monitoring systems (BGMS) are important especially when they are used to calculate insulin doses. This study aimed at assessing system accuracy of BGMS and possibly related insulin dosing errors.
Research Design and Methods:
System accuracy of six different BGMS (Accu-Chek® Aviva Nano, Accu-Chek Mobile, Accu-Chek Performa Nano, CONTOUR® NEXT LINK 2.4, FreeStyle Lite, OneTouch® Verio® IQ) was assessed in comparison to a glucose oxidase and a hexokinase method. Study procedures and analysis were based on ISO 15197:2013/EN ISO 15197:2015, clause 6.3. In addition, insulin dosing error was modeled.
Results:
In the comparison against the glucose oxidase method, five out of six BGMS fulfilled ISO 15197:2013 accuracy criteria. Up to 14.3%/4.3%/0.3% of modeled doses resulted in errors exceeding ±0.5/±1.0/±1.5 U and missing the modeled target by 20 mg/dL/40 mg/dL/60 mg/dL, respectively. Compared against the hexokinase method, five out of six BGMS fulfilled ISO 15197:2013 accuracy criteria. Up to 25.0%/10.5%/3.2% of modeled doses resulted in errors exceeding ±0.5/±1.0/±1.5 U, respectively.
Conclusions:
Differences in system accuracy were found, even among BGMS that fulfilled the minimum system accuracy criteria of ISO 15197:2013. In the error model, considerable insulin dosing errors resulted for some of the investigated systems. Diabetes patients on insulin therapy should be able to rely on their BGMS' readings; therefore, they require highly accurate BGMS, in particular, when making therapeutic decisions.
Background
I
In insulin pump therapy or intensified conventional therapy with multiple daily injections, insulin boluses typically depend on planned carbohydrate intake and on the current blood glucose (BG) concentration. In these types of therapy inaccurate BG measurement results can translate into insulin dosing errors that, depending on the level of inaccuracy, can lead to inadequate glucose control and, in turn, result in short-term or long-term complications. 7 –10
Requirements regarding the accuracy of BGMS are topic of standards and guidance documents, 11,12 including the widely accepted international standard ISO 15197:2013. 11 Besides assessment of analytical system accuracy, this standard also considers the clinical relevance of BG measurement inaccuracy by incorporation of the consensus error grid (CEG). 11,13 However, CEG analysis is based on survey data from 1996, 13 and it does not directly reflect insulin dosing error.
Models for estimation of insulin dosing error have been used for some time, and there are multiple different alternatives of calculating insulin dosing error. 14 –16
In the study presented here, system accuracy of six different BGMS was investigated and possibly related insulin dosing errors were modeled.
Research Design and Methods
The accuracy study was performed at the Institut für Diabetes-Technologie Forschungs- und Entwicklungsgesellschaft mbH an der Universität Ulm, Ulm, Germany in August and September 2015. Study procedures were based on ISO 15197:2013, clause 6.3. ISO 15197:2013 was harmonized with the regulations of the European Union as EN ISO 15197:2015. This harmonization had no impact on the requirements and procedures in ISO 15197:2013; changes were made to the foreword and an informative annex.
The study was approved by the Ethics Committee, announced to the competent authority, and registered at the ClinicalTrials.gov trial registry (identifier number NCT02531386). It was performed in accordance with the Good Clinical Practice guidelines, the Declaration of Helsinki (revised edition, Fortaleza 2013), and the German Medical Devices Act.
Study participants
Following ISO 15197:2013, 11 100 evaluable data sets had to be obtained. The study was performed in two parts with three BGMS per part. To obtain the required number of data sets, up to 130 subjects were enrolled in each part of the study. Participants had to have type 1 diabetes, type 2 diabetes, or no diabetes, and they had to be at least 18 years old and provide signed informed consent. Exclusion criteria included, for example, pregnancy, legal incompetence, or, at the study physician's discretion, a current physical or mental constitution that may compromise the subject's capability to participate in the study.
BG monitoring systems
In the study, six different BGMS were evaluated with three reagent system lots each (Table 1). According to survey data provided by Bayer Vital GmbH, the predecessor-in-interest of Ascensia Diabetes Care Deutschland GmbH, who funded the study, these systems are often used in combination with pumps for continuous subcutaneous insulin infusion (data on file).
GDH, glucose dehydrogenase; GOD, glucose oxidase; HK, hexokinase.
Systems 1, 5, and 6 were evaluated at the same time in part 1 of the study; systems 2, 3, and 4 were evaluated at the same time in part 2.
All BGMS were set up, used, and maintained according to the respective manufacturer's labeling. For all BGMS used in the study, control solution measurements were performed at least daily to ensure that the BGMS were working properly.
Comparison methods
Comparison measurements were performed with a hexokinase method (COBAS INTEGRA® 400 Plus; Roche Instrument Center, Rotkreuz, Switzerland) and with a glucose oxidase method (YSI 2300 STAT PLUS; YSI Life Sciences, Yellow Springs, OH). Both methods conform to the traceability requirements of ISO 17511 17 according to the respective manufacturer's information. Trueness and precision of both comparison methods were verified by daily internal and regular external quality control measures as required by the German national standard (Rili-BÄK) 18 and IDT-internal standard operating procedures.
In the literature, a systematic measurement difference between measurements with a hexokinase method and with a glucose oxidase method of up to 8% was found. 19 Because some of the systems are referenced against the hexokinase method and others are calibrated against the glucose oxidase method, both methods were used for comparison measurements in this study.
All measurements were performed in duplicate on plasma samples (see “Samples” section).
Study procedures
Study procedures were performed in a laboratory environment, in which temperature and humidity were controlled to be within BGMS labeling and within ISO 15197 requirements. All measurements were performed by trained personnel.
Participants were examined by a physician to check eligibility after they signed the informed consent form.
Before performing any study procedures, participants were asked to wash and dry their hands to avoid possible contamination.
The following procedure was performed by trained personnel with each participant in each study part: (a) collection of capillary samples for comparison measurements in heparinized tubes (b) measurements with three reagent system lots of one type of BGMS (c) collection of capillary samples for comparison measurements in heparinized tubes (d) repetition of steps (b) and (c) for two other types of BGMS.
For adjusted BG concentrations (see “Samples” section), collection of samples for comparison methods was only performed before the first type of BGMS and after the last type of BGMS.
Immediately before or after performing this procedure, additional samples were obtained to determine packed cell volume (hematocrit), which had to be within the range specified in the BGMS labeling. Hematocrit ranges as specified in the BGMS labeling, as well as descriptive statistics about the subjects' hematocrit values, are displayed in Supplementary Table S1 (Supplementary Data are available at
Samples
Study personnel collected fresh capillary blood samples by pricking the participants' fingertips. Samples collected for comparison measurements were centrifuged within 10 min of collection to obtain plasma. Measurements with BGMS were performed directly from the fingertip. Measurements with the comparison methods and with the BGMS were performed in duplicate.
Samples were distributed with respect to their BG concentration into different categories according to ISO 15197:2013 requirements. 11 Once a category reached the required number of samples, no further samples were added to that category.
Unaltered samples were used for BG concentrations between 50 and 400 mg/dL; higher or lower BG concentrations could be achieved in samples with adjusted BG concentrations following ISO 15197:2013 by supplementing glucose stock solution or by glycolysis. 11 A blood gas analyzer (OPTI® CCA-TS analyzer; OPTI Medical System, Inc., Roswell, GA) was used to ensure that oxygen partial pressure in these samples was comparable to that of fresh capillary blood samples. 20
BG concentrations between 50 and 80 mg/dL and between 300 and 400 mg/dL could be reached by provoking slight glucose excursion, for example, by adjusting injection-meal intervals or by slightly modifying insulin dosing. If these steps were performed, a physician closely monitored the respective participants who had to arrive at the study site with normal BG concentrations and who had to stay at the study site until their BG concentrations stabilized at a normal level.
Data analysis
Out of all obtained samples, some were excluded from the analysis for the following reasons: the comparison method's quality control measurement sample was outside the acceptable limits; BG concentration was not sufficiently stable between comparison method measurements before and after the BGMS measurements (difference >4 mg/dL at BG concentrations <100 mg/dL or >4% at ≥100 mg/dL); a procedural error was documented; hemolysis in the comparison method sample was observed; the mean comparison method result was >550 mg/dL and therefore the sample was not evaluable according to ISO 15197:2013, clause 6.3.3, criterion B 11 ; or the BG concentration category was already filled.
Measurements resulting in error messages were excluded, and the measurements were immediately repeated.
System accuracy analysis was performed by applying the criteria of ISO 15197:2013, clause 6.3, 11 thus calculating the percentage of results within ±15 mg/dL of the comparison method result for glucose concentrations <100 mg/dL and within ±15% for glucose concentrations ≥100 mg/dL, and the percentage of results within the clinically acceptable zones A and B of the CEG. More stringent criteria of ±10 mg/dL and ±10%, respectively, which ISO 15197:2013 recommends to report, were applied as well. In addition, the bias (systematic measurement difference) was calculated according to Bland and Altman, 21 and linear regression analysis was performed according to Passing and Bablok. 22
All samples included in the system accuracy analysis were then assessed regarding possibly related insulin dosing errors. The model used in this study is based on the model published in 2015 by Bedini et al., 15 and a detailed description can be found in the Supplementary Data. The model only covers short-term insulin doses (i.e., meal-related doses and doses for BG correction), but not long-term (basal) insulin doses. This model was primarily chosen because it resembles bolus calculator algorithms from insulin pumps.
In this insulin dosing error model, the difference between insulin doses based on BGMS measurement results and their respective comparison method measurement results are calculated using a predefined set of parameters used in insulin therapy (target BG: 130 mg/dL; insulin sensitivity: 40 mg/dL/U; carbohydrate intake: 60 g; insulin-to-carb ratio: 15 g/U). Fixed parameters were chosen to provide identical conditions for all BGMS. For all BGMS and both comparison methods, 95% ranges for insulin dosing errors were calculated, as well as percentages of insulin dosing errors exceeding ±0.5 U, ±1.0 U, and ±1.5 U.
Results
System accuracy
In comparison with results from the hexokinase method, five BGMS (1–4, and 6) showed at least 95% of results (96%–100%) within ISO 15197:2013 accuracy limits (criterion A) with each reagent system lot. The other system showed 91.5%, 91.5%, and 95.0% of results within these limits (Fig. 1 and Table 2).

Differences between BGMS results and comparison method results plotted over the respective comparison method result for the six investigated BGMS and both comparison methods (left: hexokinase, right: glucose oxidase). Dashed and continuous lines show accuracy limits of ISO 15197:2013 and the less stringent limits of ISO 15197:2003, respectively, in which at least 95% of results shall be found. Asterisks indicate the graph with the comparison against the respective manufacturer's reference method. BGMS, blood glucose monitoring systems.
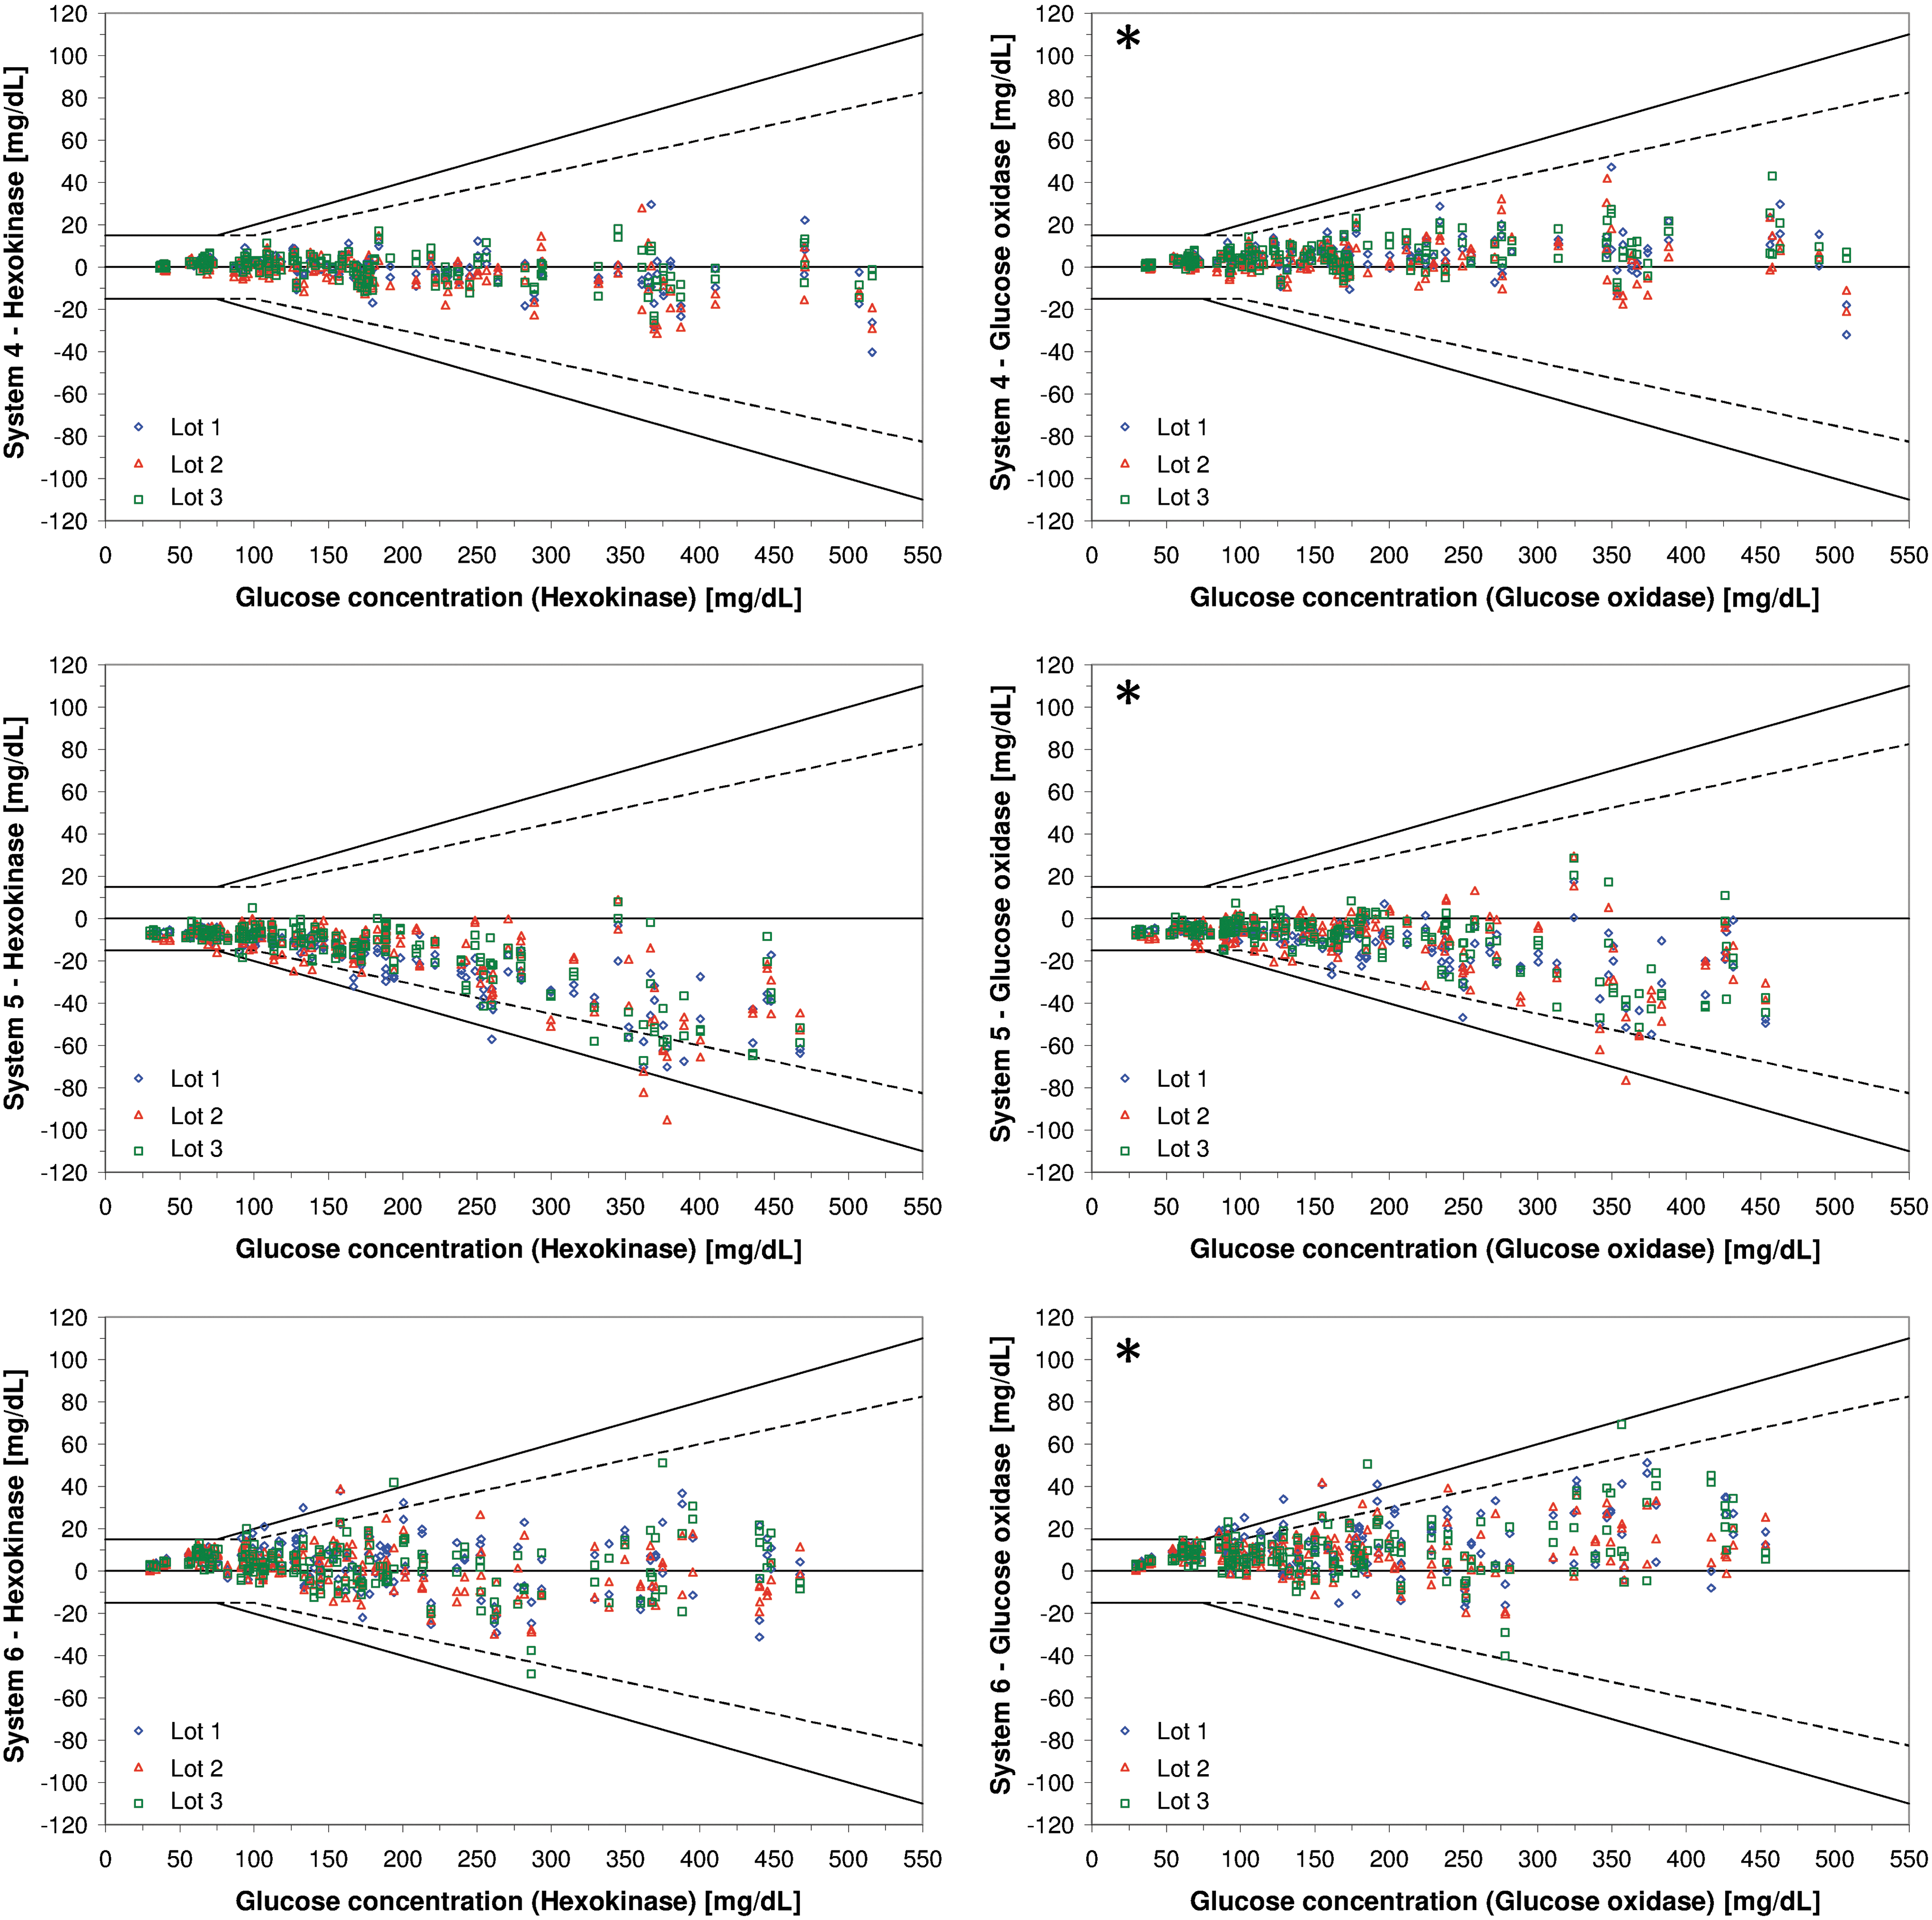
Percentages of results within accuracy criteria of ISO 15197:2013 in comparison with the manufacturer's measurement method are written in bold letters.
BGMS, blood glucose monitoring systems.
When comparing BGMS measurement results with the respective results of the glucose oxidase method, five BGMS (systems 1–5) showed at least 95% of results (97%–100%) within ISO 15197:2013 accuracy limits (criterion A) with each reagent system lot. The other system showed 92.5%, 96.5%, and 97.0% of results within these limits (Fig. 1 and Table 2).
All BGMS showed 100% of the combined results from three reagent system lots within the clinically acceptable CEG zones A and B and thus satisfied the ISO 15197:2013 accuracy criterion B.
The bias of the individual reagent system lots is shown in Table 2, whereas bias for all three lots combined can be found in Supplementary Table S2.
Insulin dosing errors
The modeled insulin dosing errors also reflect the varying levels of system accuracy as indicated by the size of the 95% ranges.
In the comparison against the hexokinase method, all 95% ranges were found between dose errors of −1.6 U and +0.6 U, whereas they were found between dose errors of −1.2 U and +1.0 U when comparing against the glucose oxidase method (Fig. 2). With a modeled insulin sensitivity of 1 U per 40 mg/dL, these errors correspond to the modeled target glucose concentration of 130 mg/dL being missed by as much as −64 mg/dL to +24 mg/dL and −48 mg/dL to +40 mg/dL, respectively.
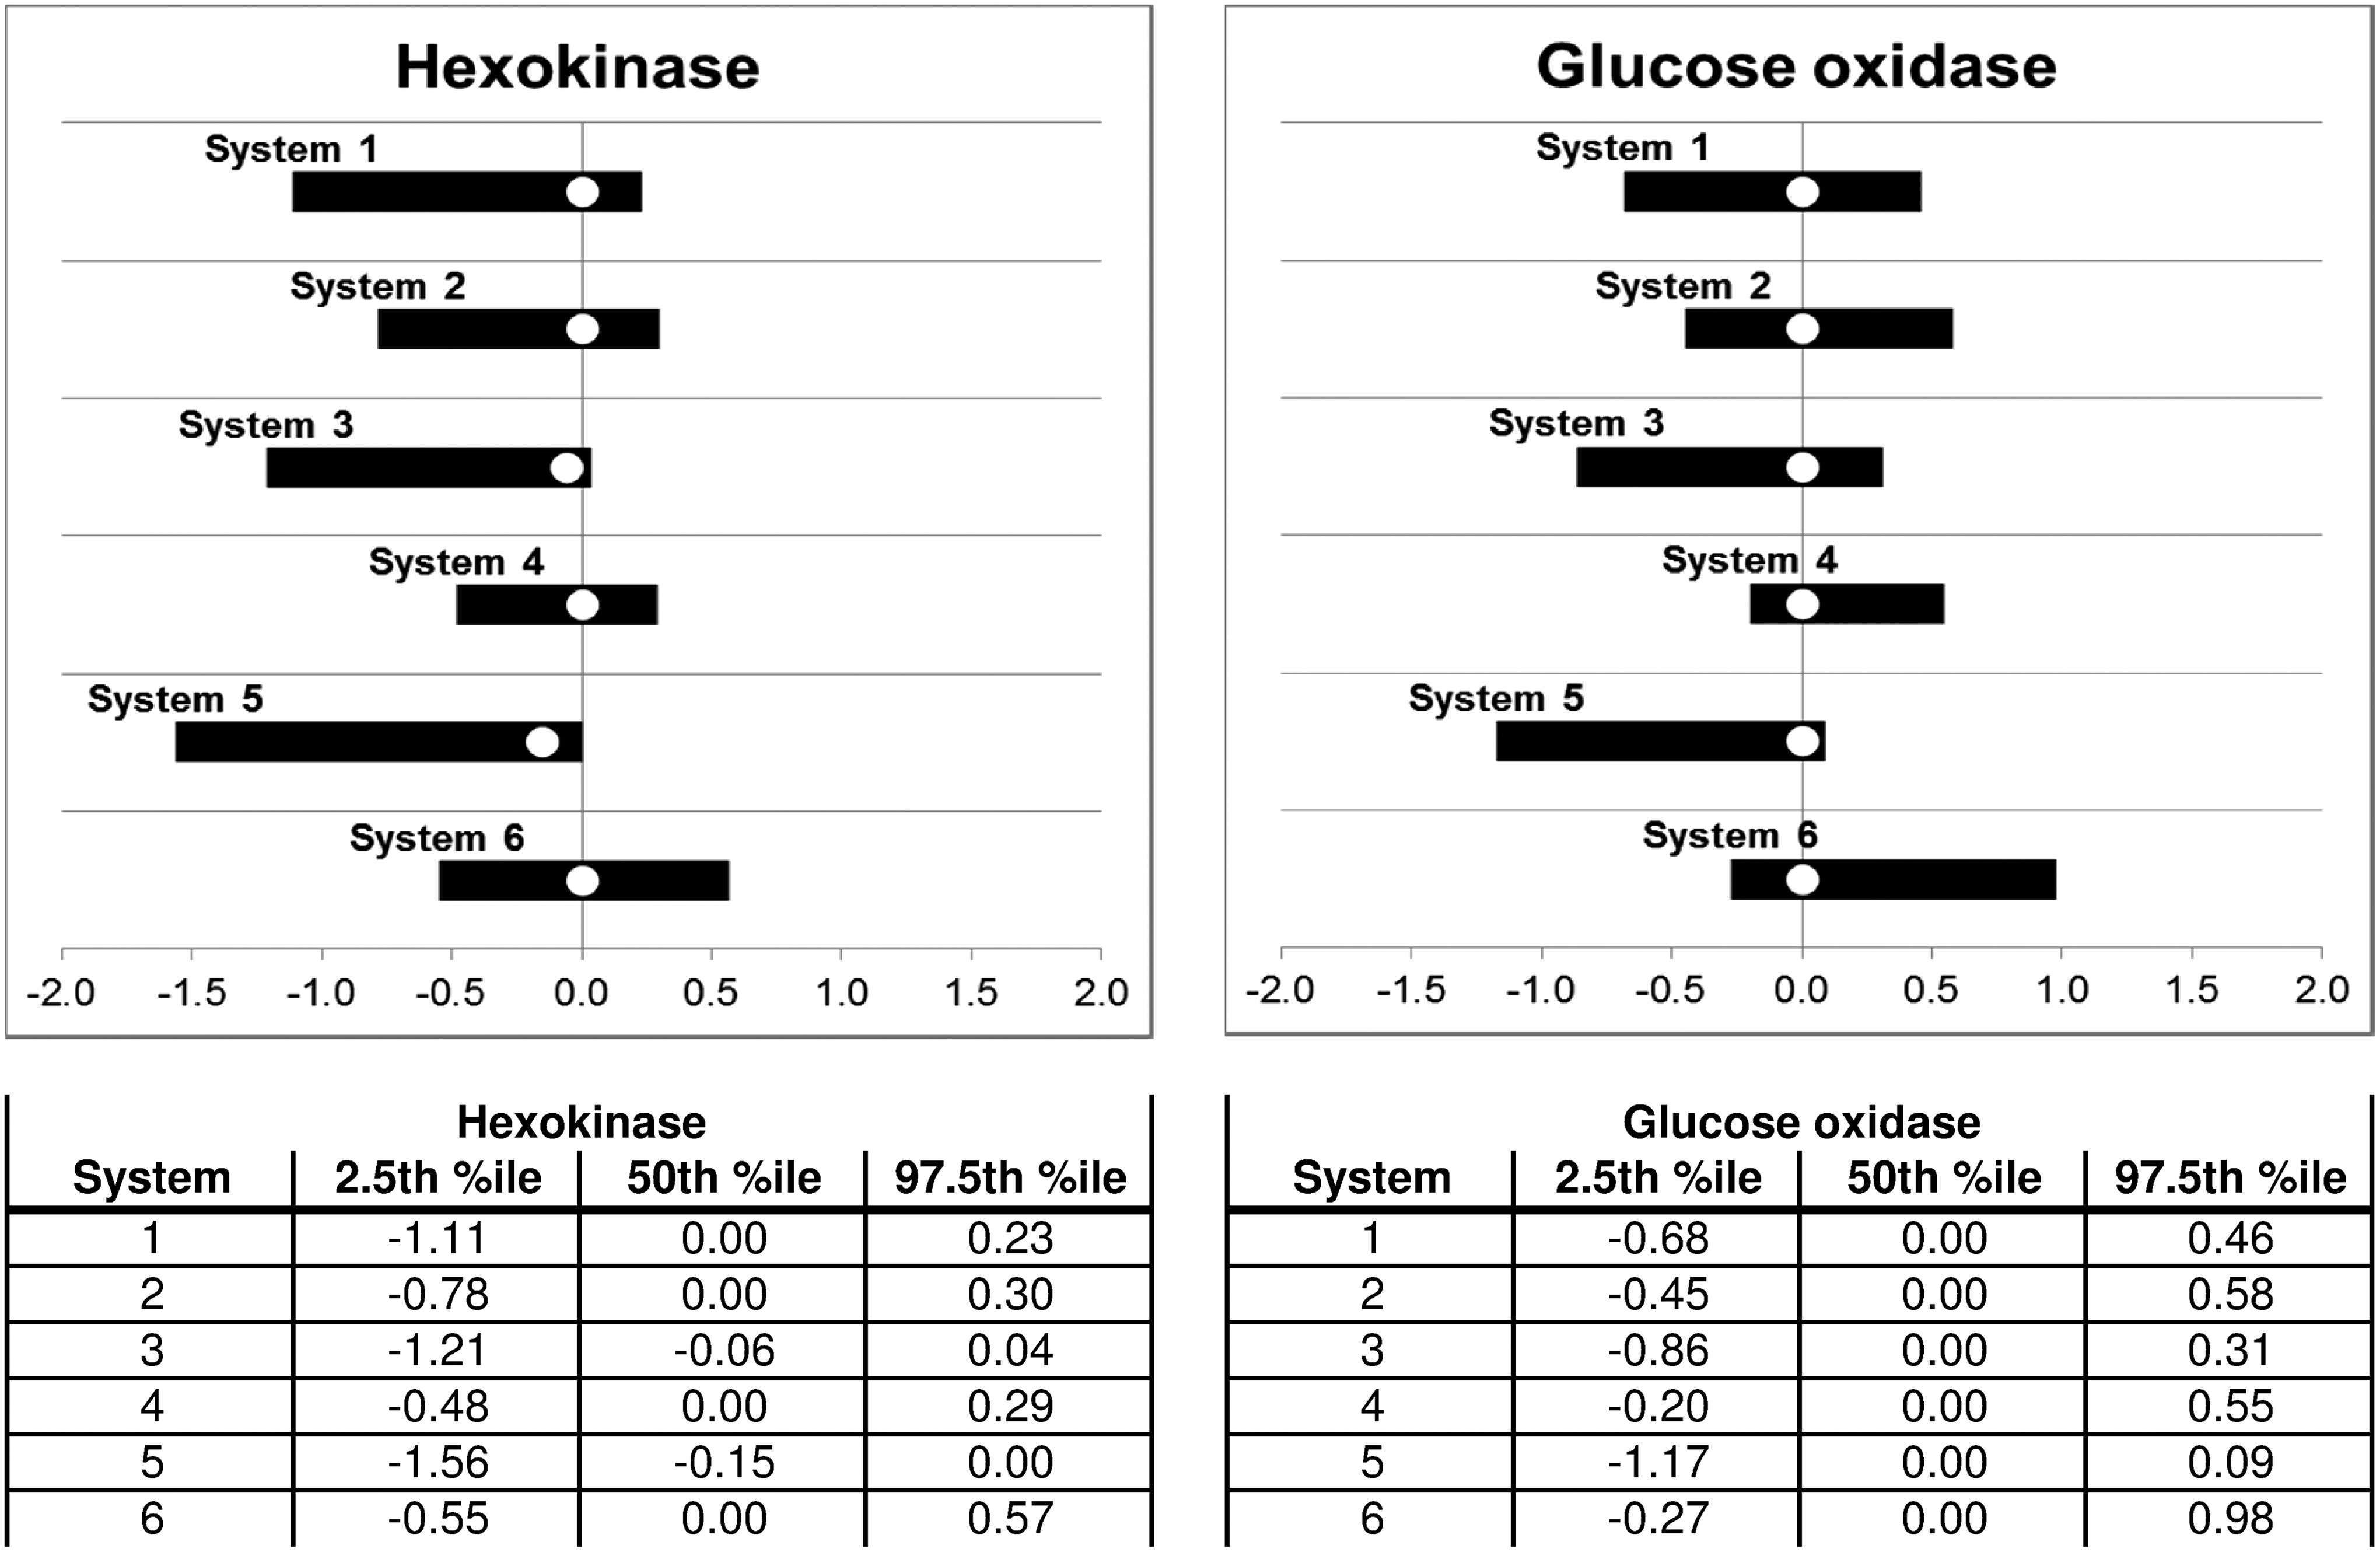
Modeled insulin dosing errors. Black bars indicate ranges in which 95% of all dose errors were found, with the white circle showing the median dose error.
The percentages of dose errors larger than ±0.5 U, ±1.0 U, and ±1.5 U are shown in Table 3. They correspond to missing the target glucose concentration (130 mg/dL) by more than ±20 mg/dL, ±40 mg/dL, and ±60 mg/dL, respectively.
Conclusions
For diabetes patients on insulin therapy, SMBG plays an integral role. 1 –4 Inaccurate BG readings can lead to unfavorable outcomes, 5,6 and there are different protocols for establishing a minimum measurement accuracy. 11,12
The BGMS investigated in the study showed varying levels of accuracy when performing a study based on ISO 15197:2013, 11 clause 6.3. Only one out of six BGMS did not fulfill the minimum system accuracy criteria compared against the manufacturer's measurement method, and none of the BGMS showed results within clinically unacceptable zones of the CEG.
The fact that there are qualitative differences among BGMS fulfilling specific criteria was highlighted by Breton and Kovatchev in 2010. 23 In their model, the probability for missing a hypoglycemic event, when measuring at precisely the moment the event occurred, increased substantially for BGMS showing more than 5% of results outside of ±7 mg/dL at glucose concentrations <75 mg/dL or outside of ±10% at ≥75 mg/dL. These criteria are slightly more restrictive than ±10 mg/dL at glucose concentrations <100 mg/dL and ±10% at ≥100 mg/dL that are mentioned in ISO 15197:2013 and that were also applied in this study. Compared against the manufacturer's measurement method, systems 2 and 4 showed at least 95% of all results from three test strip lots within these limits. Following Breton and Kovatchev's model, 23 using these BGMS would be associated with a lower risk of missing a hypoglycemic event than using the other BGMS, although five of six BGMS fulfilled the ISO 15197:2013 system accuracy criteria.
These qualitative differences among BGMS fulfilling internationally accepted standards may be the reason why the Food and Drug Administration (FDA) issued a guidance that specifies more stringent criteria than ISO 15197:2013. 12
As mentioned above, no BGMS showed results within clinically unacceptable zones of the CEG. However, the insulin dosing errors resulting from the model (Supplementary Data) showed that for some systems, substantial dosing errors can occur. Compared against the manufacturer's measurement method, up to 4.3% of results would result in dose errors exceeding 1.0 U, corresponding to missing the target glucose concentration by at least ±40 mg/dL. It is important to note that five out of six BGMS investigated in this study fulfilled the criteria set forth in ISO 15197:2013, and the other BGMS missed the criteria only by a small margin with one of three test strip lots. Previous studies showed that there are a number of BGMS that do not fulfill these criteria; 24 –28 therefore the possible insulin dosing errors are likely higher than those found in this study.
Giving too much insulin increases the risk of acute complications, like insulin-induced hypoglycemia and long-term complications, for example, from recurring or prolonged hypoglycemia. 7 –9 In contrast, giving not enough insulin results in elevated BG levels with unfavorable impact on glycated hemoglobin levels and increased risk of long-term complications. 10
A limitation of the study presented here is that all BG measurements were performed by trained professionals. Several publications have established that the level of measurement accuracy of specific BGMS also depends on the operator performing the measurements. 29 –31 Generally speaking, the measurements are reported to be less accurate when performed by lay users, thus potentially leading to larger insulin dosing errors than those estimated in this study. Sources for user errors can be device specific, for example, insufficient blood volume, 32 and device independent, for example, contamination with glucose-containing substances. 33,34
The insulin dosing error model used in this study allows estimating the clinical relevance of the investigated BGMS' analytical quality. Results suggest that this modeling is more sensitive than CEG analysis as recommended by ISO 15197:2013. Although it is a simple and established model, other models were used in the past, 14,16 and the specific choice of diabetes therapy parameters can impact the modeled doses. A strength of the model is that it is very similar to models used in automated bolus calculators that are often featured in insulin pumps. It has to be kept in mind that diabetes patients may adapt their therapy parameters based on previous experience with their BGMS. Such adaptations could, in principle, minimize the impact of the BGMS' systematic error (bias), but not its random error (imprecision). Nevertheless, differences in bias and imprecision between different BGMS can play an important role when patients switch from one BGMS to another, for example, when older BGMS models are phased out by their respective manufacturers.
Differences in bias can also appear due to manufacturers using different reference methods for calibration of their systems. As described above, a bias of up to 8% is reported between GOD (glucose oxidase) and HK (hexokinase) methods. 19 Therefore, GOD-calibrated BGMS showing a high level of accuracy according to ISO 15197 would likely show systematically different results compared to HK-calibrated BGMS that show a high level of accuracy according to ISO 15197, and users might not know about this difference. One possible solution for this issue would be to use higher order reference methods, like isotope-dilution mass spectrometry. However, these methods are comparably expensive and typically have lower sample throughput than GOD- or HK-based laboratory analyzers. Another alternative could be mathematical adjustment of reference values (recalibration). The Scandinavian evaluation of laboratory equipment for primary healthcare (SKUP) program, for example, uses linear regression data from measurements of standard reference material to adjust all comparison method measurement results. 35 Harmonization of reference methods could increase comparability of different BGMS regarding their analytical performance.
In conclusion, the investigated BGMS showed varying degrees of measurement accuracy, and only one of six BGMS did not fulfill the system accuracy criteria. While all BGMS showed only clinically accurate results with respect to ISO 15197:2013 requirements, for some BGMS considerable insulin dosing errors resulted according to the model used in this study. The insulin dosing error model allows a more detailed estimation of the clinical relevance of the BGMS' analytical quality and, thus, a finer distinction in the analytical quality of BGMS that fulfill ISO 15197:2013 requirements. As there are qualitative differences even among BGMS fulfilling the minimum requirements of current protocols, manufacturers should strive for a high level of measurement accuracy even in the hands of lay users, possibly exceeding these minimum accuracy criteria.
Diabetes patients and their physicians or diabetologists, on the other hand, should be aware of these qualitative differences among BGMS, especially when starting insulin therapy or when switching between brands of BGMS.
Footnotes
Acknowledgments
Parts of this study's results were presented at the 76th Scientific Sessions of the American Diabetes Association in New Orleans, LA, June 10–14, 2016.
The authors thank Scott Pardo, PhD, PStat®, for his assistance in modeling insulin dosing errors.
This study was funded and medical writing was supported by Bayer Vital GmbH, the predecessor-in-interest of Ascensia Diabetes Care Deutschland GmbH.
Author Disclosure Statement
G.F. is general manager of the IDT (Institut für Diabetes-Technologie Forschungs- und Entwicklungsgesellschaft mbH an der Universität Ulm, Ulm, Germany), which carries out clinical studies on the evaluation of BG meters and medical devices for diabetes therapy on its own initiative and on behalf of various companies. G.F./IDT have received speakers' honoraria or consulting fees from Abbott, Ascensia, Bayer, Berlin-Chemie, Becton-Dickinson, Dexcom, LifeScan, Menarini Diagnostics, Novo Nordisk, Roche, Sanofi, Sensile, and Ypsomed. A.B., N.J., S.P., and C.H. are employees of IDT.
References
Supplementary Material
Please find the following supplemental material available below.
For Open Access articles published under a Creative Commons License, all supplemental material carries the same license as the article it is associated with.
For non-Open Access articles published, all supplemental material carries a non-exclusive license, and permission requests for re-use of supplemental material or any part of supplemental material shall be sent directly to the copyright owner as specified in the copyright notice associated with the article.