




Abstract
Background:
Postprandial (PP) control remains a challenge for closed-loop (CL) systems. Few studies with inconsistent results have systematically investigated the PP period.
Objective:
To compare a new CL algorithm with current pump therapy (open loop [OL]) in the PP glucose control in type 1 diabetes (T1D) subjects.
Methods:
A crossover randomized study was performed in two centers. Twenty T1D subjects (F/M 13/7, age 40.7 ± 10.4 years, disease duration 22.6 ± 9.9 years, and A1c 7.8% ± 0.7%) underwent an 8-h mixed meal test on four occasions. In two (CL1/CL2), after meal announcement, a bolus was given followed by an algorithm-driven basal infusion based on continuous glucose monitoring (CGM). Alternatively, in OL1/OL2 conventional pump therapy was used. Main outcome measures were as follows: glucose variability, estimated with the coefficient of variation (CV) of the area under the curve (AUC) of plasma glucose (PG) and CGM values, and from the analysis of the glucose time series; mean, maximum (Cmax), and time to Cmax glucose concentrations and time in range (<70, 70–180, >180 mg/dL).
Results:
CVs of the glucose AUCs were low and similar in all studies (around 10%). However, CL achieved greater reproducibility and better PG control in the PP period: CL1 = CL2<OL1<OL2 (PGmean 123 ± 47 and 125 ± 44 vs. 152 ± 53 and 159 ± 54 mg/dL) and Cmax OL 217.1 ± 67.0 mg/dL versus CL 183.3 ± 63.9 mg/dL, P < 0.0001. Time-in-range was higher with CL versus OL (80% vs. 64%; P < 0.001). Neither the time below 70 mg/dL (CL 6.1% vs. OL 3.2%; P > 0.05) nor the need for oral glucose was significantly different (CL 40.0% vs. OL 22.5% of meals; P = 0.054).
Conclusions:
This novel CL algorithm effectively and consistently controls PP glucose excursions without increasing hypoglycemia. Study registered at
Introduction
P
Until now, different approaches have been suggested to counteract meal-induced disturbances in CL studies. Fully automated CL control without prior information regarding meal size and insulin delivery optimization has shown lower performance during the PP period either in single- or in dual-hormone CL systems. 1 –3 Other less-ambitious approaches in which meals are announced to the system (meal announcement, semi CL) giving full prandial bolus, 4,5 or at least a percentage (priming boluses), leaving the rest to the CL controller 6 have been evaluated. More recently, other strategies added to CL control of insulin delivery, such as the addition of pramlintide, liraglutide, or technosphere inhaled insulin, have been shown to improve PP glucose excursions. 7,8 However, these strategies do not relieve the burden of decision-making before meals and/or add complexity to the CL therapy. For these reasons, meal announcement appears to be the easiest way to improve PP glucose control in CL systems.
Despite the use of meal announcement, the main challenge of control algorithms is to find a balance between PP glucose control and hypoglycemic risk, avoiding the overcorrection of hyperglycemia. An aggressive tuning for a lower PP glucose peak may cause insulin stacking, producing late hypoglycemia. Several groups have incorporated safety strategies in their algorithms such as the inclusion of constraints on residual insulin activity (insulin on-board, IOB), 9 the addition of insulin feedback (IF), 10 or inclusion of glucagon as a counterregulatory control action (bihormonal CL control), 11,12 with some improvement during the PP period. An alternative proposed strategy may be using sliding mode reference conditioning (SMRC). This is a safety loop, which needs to be added to the main control loop and is only active when IOB is going to overcome any previously defined constraint. 13 However, to date, only an in silico validation of this strategy is available.
Recent at-home artificial pancreas (AP) studies have demonstrated improved daytime glucose control and less within-day and between-days glycemic variability compared to pump therapy. However, the reduction of glycemic variability was mainly due to a diminution in nocturnal glycemic variability. 5,14 In addition, the PP period was not systematically addressed in these studies. Hence, the superiority of CL versus open loop (OL) during the PP period needs still to be proven.
In this context, our study aimed to assess whether a SMRC-based CL controller is able to safely improve PP glycemic control in comparison with standard OL therapy based on CSII in subjects with T1D.
Research Design and Methods
Study design and subjects
This was a randomized, prospective, one-way, repeated-measures (four periods, two sequences) crossover study in subjects with T1D under CSII. The protocol was approved by the Ethics Committees of the Clinic University Hospital of Valencia and the Clinic University Hospital of Barcelona (clinical settings). The study was designed as an in-hospital approach fulfilling the regulatory conditions applied in our country to this sort of projects before moving to at-home settings.
Subjects were eligible to participate if they were between 18 and 60 years of age, had a diagnosis of T1D for at least 1 year, HbA1c between 6.0% and 8.5%, and were on CSII for at least 6 months. Hypoglycemia unawareness was ruled out using a validated questionnaire. 15
Each subject underwent an in-hospital 8-h standardized mixed meal test (60 g carbohydrate, CH) on four occasions. On two occasions (CL1 and CL2), after a meal announcement, an augmented bolus was given, followed by manual adjustments of the basal rate every 15 min according to a CL controller. On the other two occasions (OL1 and OL2), conventional CSII was used and boluses were based on the individual insulin/carbohydrates (I:CHO) ratios. All subjects were randomly assigned to sequence 1 (OL1-CL1-OL2-CL2) or 2 (CL1-OL1-CL2-OL2) with a wash-out period of at least 1 week between studies.
Patients were instructed to wear a continuous glucose monitoring (CGM) device and follow a structured self-monitoring blood glucose (SMBG) protocol during a 6-day period before the first meal test. Data from CGM and SMBG were used to obtain individual estimated insulin sensitivity and a pharmacokinetic/pharmacodynamic model resulting in the calculation of the following parameters: I: CHO ratio, sensitivity factor, basal insulin needs, and IOB. These parameters were used to optimize the overall home blood glucose control 16,17 (OL) and also for the controller tuning (CL).
Study devices
CSII was carried out with the Paradigm Veo® insulin pump (Medtronic MiniMed, Northridge, CA) and CGM using Enlite-2 sensors® (Medtronic MiniMed). Two CGM devices were inserted at least 24 h before the meal tests, to improve performance and avoid missing data and problems related to sensor drift. For safety and regulatory reasons, two sensors were used in this phase of development to ensure the algorithm to be fed with the secondary CGM in case of sensor failure. In all subjects, calibration of CGM was performed using the Contour® Next Link (Ascensia Diabetes Care Holdings AG, Basel, Switzerland, formerly Bayer). Glucose concentrations were also measured every 15 min with a reference method YSI 2300 Stat Plus Glucose Analyzer (YSI 2300; YSI Incorporated Life Sciences, Yellow Springs, OH).
The CL system was based on a novel SMRC glucose controller 13 built in a PC. Glucose values from the two CGM devices were introduced manually every 15 min into the controller interface. Manual operation greatly simplified regulatory approval of the system in the first submission of this type of studies in Spain. The system defined a primary and secondary CGM device automatically, based on an accuracy analysis (absolute relative difference, ARD, from reference) before the start of the CL controller. Only data from the primary CGM were used, except in case of malfunction, resulting in an automatic switch to the secondary CGM. Malfunction was defined as an ARD between the CGM reading and the plasma glucose (PG) reference greater than 40% at one time point or ARD greater than 30% in two consecutive periods. The insulin infusion rate for the next 15-min time interval was calculated by the controller and manually set by the attending physician/nurse.
The glucose controller consists of a feed-forward action plus two control loops: (a) The feed-forward action is an augmented bolus calculated based on meal announcement. The value of the bolus is the result of adding to the standard bolus (calculated from insulin/carbohydrates ratio as in OL studies) the amount of basal insulin that would be delivered in the next hour in the case of being in OL. (b) The inner control loop is a PID-type controller designed to drive the measured glucose to a target value. It is tuned from the insulin pump settings. (c) The outer control loop is based on SMRC and modulates the glucose target value on the estimated IOB, minimizing the impact of controller overcorrection resulting in late hypoglycemia. When the estimated IOB is beyond prespecified limits, a high-frequency discontinuous signal is generated and filtered inducing smooth changes in the target glucose value so that insulin-on-board constraints are not violated. Thus, this outer loop acts as a safety supervisory loop. The IOB estimation is calculated using a previous population pharmacokinetic model. Finally, the IOB limit is estimated individually based on 1-week CGM data and previous insulin pump settings. Compared to IF, also used in combination to PID controllers,
18
SMRC is expected to induce an early pump shutoff due to the augmented bolus administration with a potential benefit in PP control, compared to a later effect by IF driven by the estimated plasma insulin concentration.
Mixed meal tests
Before the meal test, fasting subjects were admitted to the clinical research units at 08:00 AM. In a sitting position, two venous lines were prepared, one for arterialized venous blood sampling 19 and the other for insulin/glucose infusion, if required. To ensure comparable metabolic conditions between studies, where appropriate, subjects received an intravenous infusion of regular human insulin in a feedback manner, or glucose, to maintain PG at 90–100 mg/dL until the beginning of the studies. At 12:00 h (t = 0), a standard mixed meal (530 Kcal, 60 g CHO, 45.3% CHO, 24.2% protein, 30.5% fat) was consumed in 15–20 min. At the same time, insulin was administered following the randomization protocol (OL or CL), and PG was monitored for the ensuing 8 h until the end of study at 20:00 h (time 480 min). If PG fell below 70 mg/dL during two consecutive 15-min periods, oral glucose was administered in fixed amounts of 15 g until recovery from hypoglycemia.
Statistical analysis
Mean glucose concentrations, time spent in different ranges (<70, 70–180, and >180 mg/dL), maximum (Cmax), and time to maximum (Tmax) glucose values were used as a measure of glycemic control. Variability of the PP glycemic response was estimated from the coefficient of variation (CV) of the area under the curve (AUC) of PG and CGM values and from the analysis of the glucose-time series of the four studies (CL1, CL2, OL1, and OL2).
The primary study outcome was the CV of PG during the whole PP period (CV_AUC-PG0–8h). However, the CV of glucose measurements was also calculated for the early (CV_AUC-PG0–3h) and the late (CV_AUC-PG3–8h) PP phases.
All of the above measures were also calculated from CGM values.
The linear trapezoidal rule was used to calculate the AUC for glucose measurements for each study, obtaining two values for the CL (AUC_CL1and AUC_CL2) and two for the OL condition (AUC_OL1 and AUC_OL2). Then, CV was calculated as the ratio between the respective AUC's SDs and means, so that
Cmax, Tmax, and the time spent in range (70–180 mg/dL) were read directly from the concentration–time data for each subject.
As data were mostly not normally distributed, they were analyzed nonparametrically. The Wilcoxon signed rank sum test was used to compare CVs of CL and OL studies. Glucose concentration–time series, as well as all the other parameters, were analyzed using Kruskal–Wallis one-way ANOVA on ranks. Post hoc comparisons were carried out to examine the differences between pairs of groups after Kruskal–Wallis analysis: the least significant difference post hoc test was used to explore all possible pair-wise comparisons of means (OL1 vs. OL2, OL1 vs. CL1, OL1 vs. CL2, OL2 vs. CL1, OL2 vs. CL2, and CL1 vs. CL2).
Data analysis was carried out with SPSS software, version 20.0 (SPSS, Inc., Chicago, IL).
Sample size calculation
A power analysis was conducted. In a 2 × 2 crossover study design, 20 patients achieved a power of 90% with an effect size of 0.963 between CV of CL and OL, when the actual mean difference is −4.813; the standard deviation of the period differences for each subject within each sequence is 5.000; a one sided t-test is considered; and the significance level is 0.05.
Results
Twenty subjects with T1DM with fair glycemic control (13/7, females/males; age 40.7 ± 10.4 (mean ± SD) years; BMI 25.7 ± 3.0 kg/m2; diabetes duration 22.2 ± 9.9 years; time on CSII 7.2 ± 4.4 years; and HbA1c 7.8% ± 0.7%) were recruited and all of them completed the study.
Efficacy—glycemic control
Analysis of CV_AUCs did not show any improvement in glucose variability using CL compared to OL, with values around 10% either with PG or CGM independent of the PP period phase (0–8, 0–3, 3–8 h) (Table 1). However, analysis of glucose concentration–time series was superior with a controller-driven insulin infusion (Figure 1). Indeed, PG was significantly lower in CL than in OL (OL1 152.4 ± 53.4; OL2 159.3 ± 53.8; CL1 123.3 ± 46.9; CL2 124.9 ± 44.3 mg/dL, P < 0.0001), with no differences between CL studies (CL1−CL2 = −1.6 mg/dL with 95% CI [−6.9; 3.8]). In contrast, mean PG during OL1 was significantly different from OL2 (−6.9 mg/dL [−12.3; −1.5]). The differences between OL and CL studies were also confirmed when CGM time series were analyzed (OL1 160.8 ± 51.8; OL2 165.2 ± 56.7; CL1 132.1 ± 47.8; CL2 127.1 ± 42.3 mg/dL, P < 0.0001). However, in this case, post hoc analysis revealed no difference between OL (OL1−OL2 = −4.4 mg/dL [−9.7; 1]) or CL studies (CL1−CL2 = −5 mg/dL [−0.4; 10.4]).
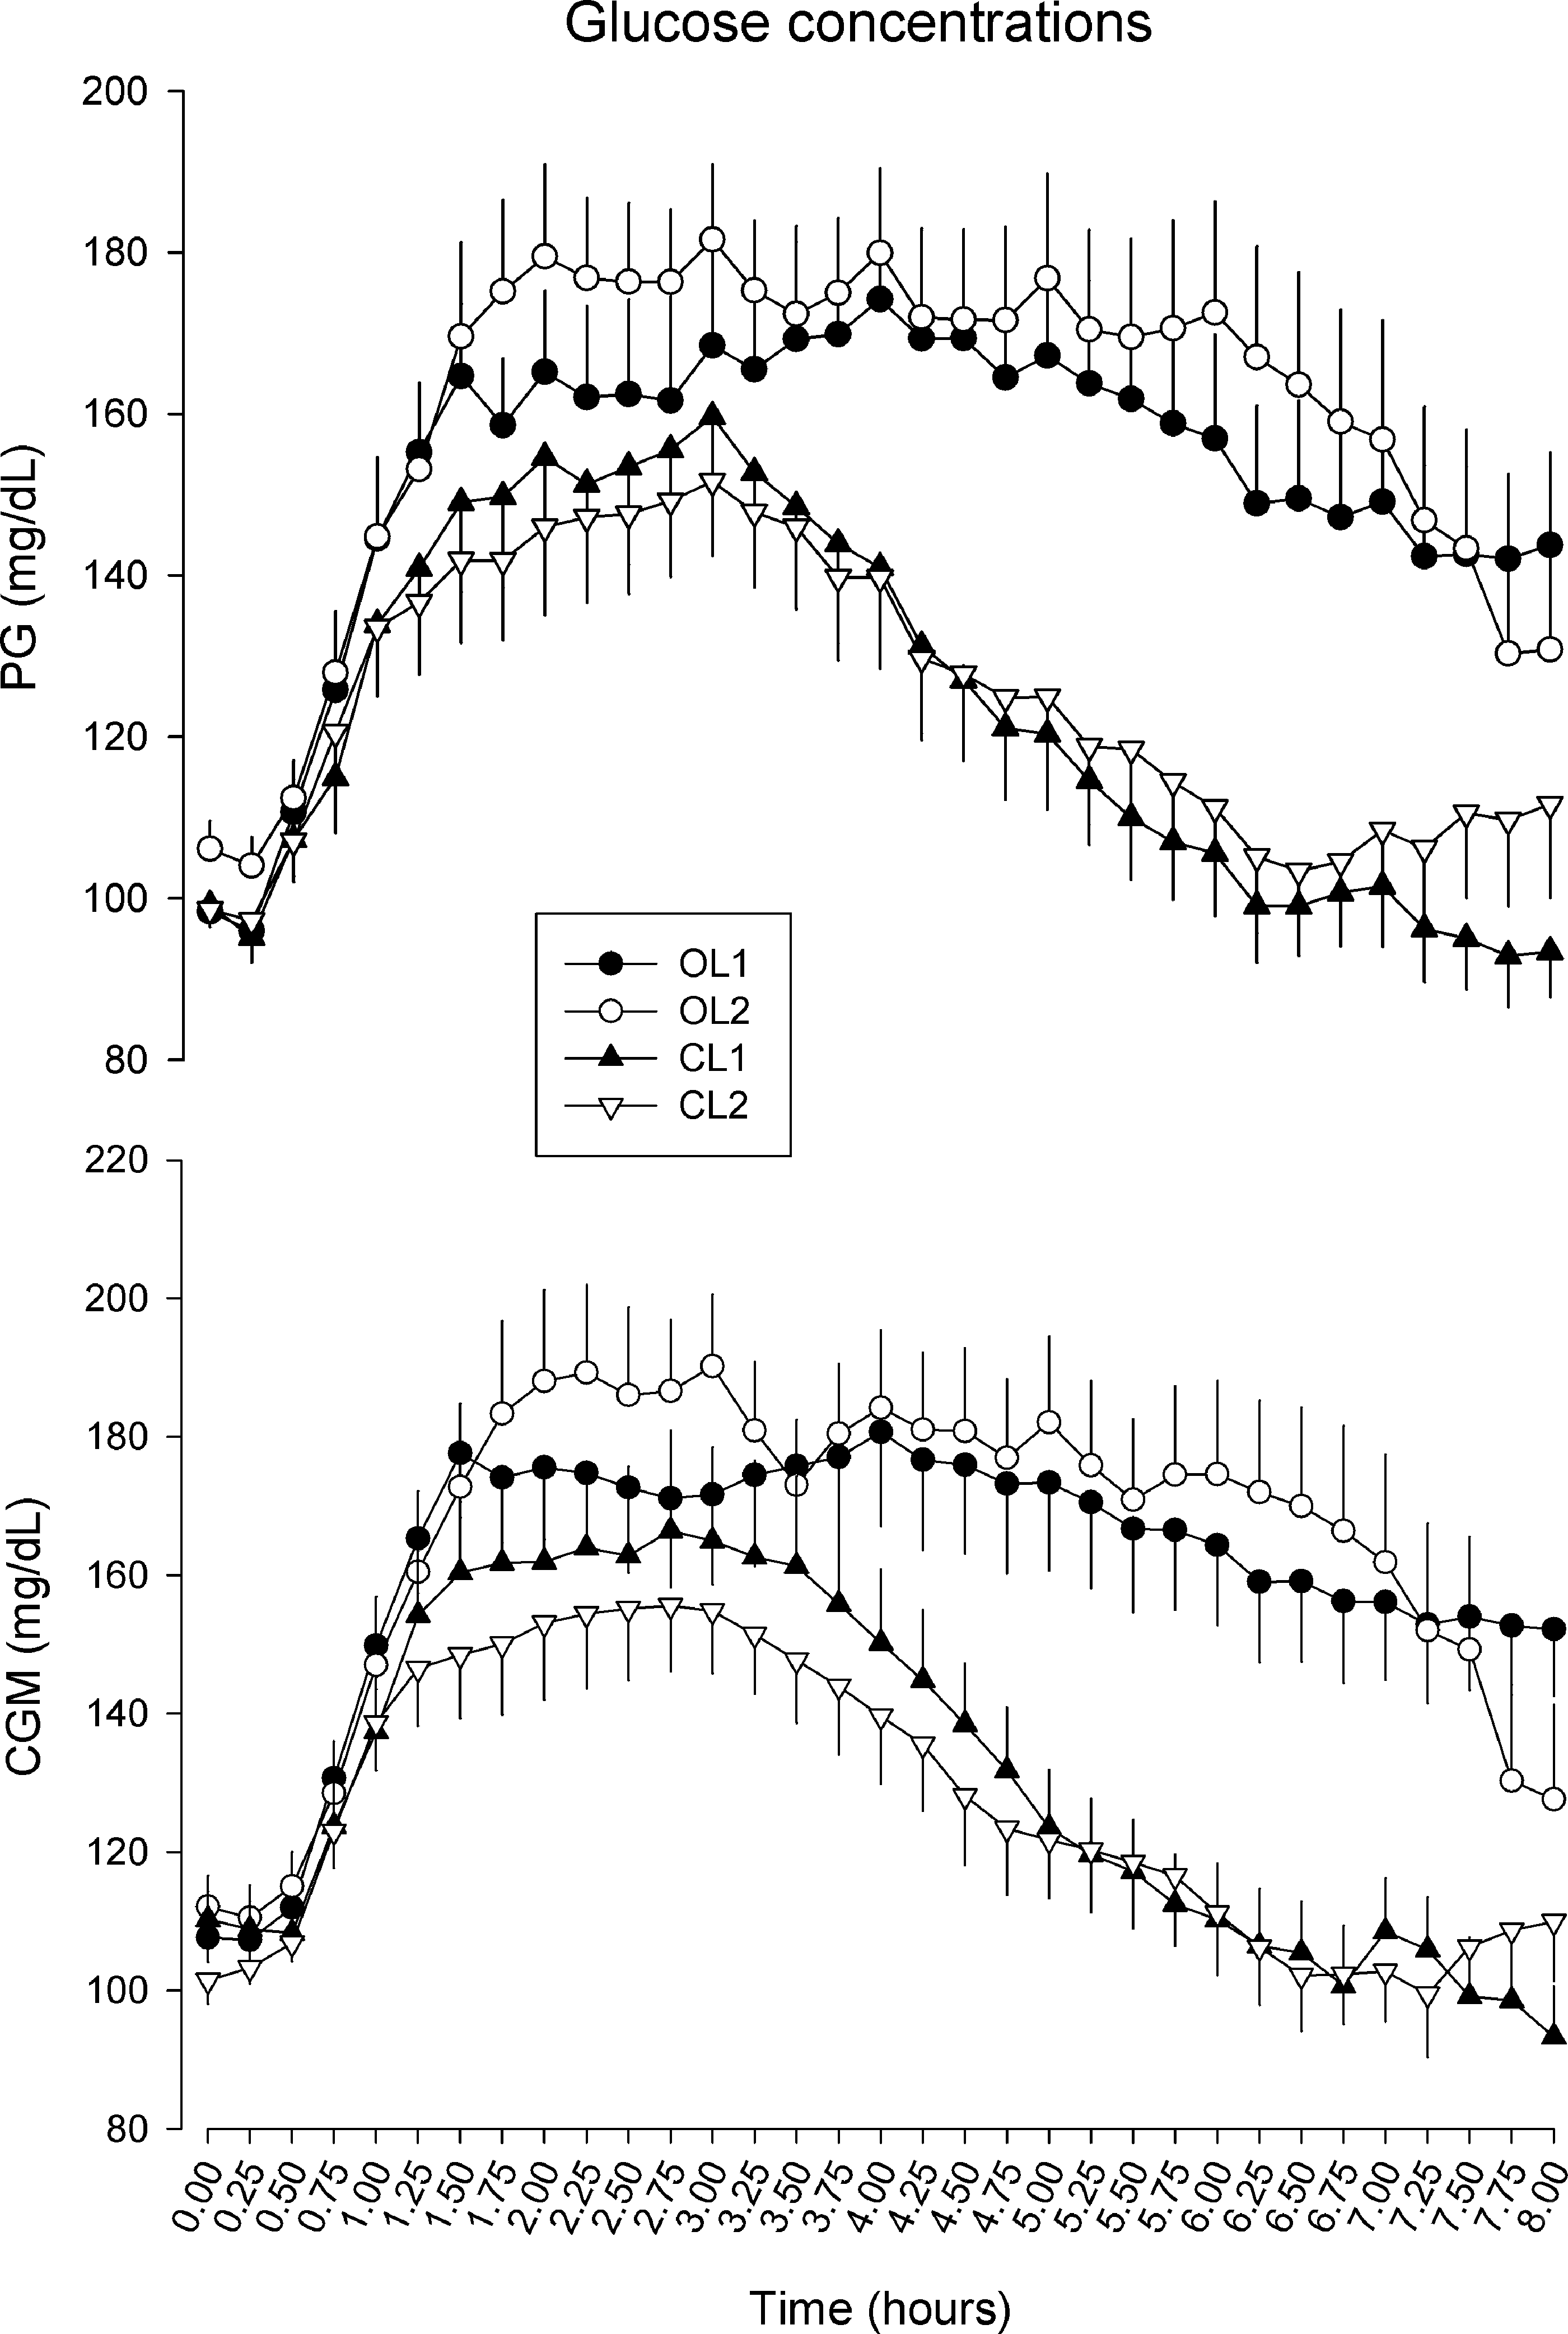
Mean ± SE of plasma and CGM glucose concentrations. Control was significantly improved with CL compared with OL. CGM, continuous glucose monitoring; CL, closed loop; OL, open loop; SE, standard error of the mean.
CVs were calculated either with PG or CGM measurements, yielding similar results. Wilcoxon signed rank sum test was used for the comparison.
CGM, continuous glucose monitoring; CL, closed loop; CV, coefficient of variation; OL, open loop; PG, plasma glucose.
Time spent in range 70–180 mg/dL, calculated either in PG or CGM values, was significantly greater (80% vs. 64% PG; 78.8% vs. 60.5% CGM, P < 0.05) in CL compared to OL, without any significant difference in the time spent in hypoglycemia (6.1% vs. 3.2% PG; 5.2% vs. 1.9% CGM, P < 0.05) (Table 2). In addition, Cmax was significantly lower in CL studies either considering PG (OL 217.1 ± 67.0 vs. CL 183.3 ± 63.9, P = 0.00029) or CGM data (OL 227.4 ± 66.7 vs. CL 196.2 ± 59.4, P < 0.0001), without any difference between CL (CL1 = CL2) or OL (OL1 = OL2) studies (P = NS for post hoc analysis).
P-value < 0.05.
Safety—hypoglycemic episodes
The mean amount of oral glucose given to recover from mild hypoglycemic episodes did not differ between studies (OL 7.2 ± 17.7 g vs. CL 12.8 ± 17.9 g, P = 0.121). Although numerically greater, the percentage of studies in which oral glucose was needed (40% vs. 22.5%), as well as the mean number of rescues (0.825 ± 1.20 vs. 0.5 ± 1.18, P = 0.054) was not significantly different in CL compared to OL studies. Moreover, percentage of time below 54 mg/dL was not different (3.3% in CL vs. 2.3 in OL studies; P > 0.05). A shift from primary to secondary CGM was infrequent and also, there was no need to feed the CL using reference data.
Insulin dose
The median total insulin dose during the 8 h of the study (CL 0.204; IQR: 0.181–0.245 vs. OL 0.196; IQR: 0.163–0.249 U/kg; P < 0.001) was significantly higher in CL compared to OL studies (Fig. 2). However, the mean global difference in daily doses was numerically small with a size effect of 2.2%. The overall ratio of basal to prandial insulin during the experiments was 44.6%/55.4% in OL versus 45.3%/54.7% in CL studies.

Bolus (U/kg) and basal insulin dose [U/(kg·h)].
Conclusions
Our study shows that the novel SMRC-based CL algorithm improved glucose control consistently and safely across the early and late PP phase without increasing hypoglycemia risk. Glucose variability was relatively small in both study arms and was not improved in CL compared to standard treatment.
Improvement of PP hyperglycemia avoiding late hypoglycemia is one of the main challenges of all the groups involved in AP research. Intrapatient variability, errors in glucose sensor measurements, and, mainly, the delay in the control action are some of the limiting barriers. However, to our knowledge, studies comparing OL versus CL more than once and only during the PP period in controlled conditions are very scarce.
Many hybrid blood glucose control systems include a feed-forward action as a full standard bolus or a portion of the bolus for safety reasons. To reduce PP peaks induced by large meals or foods with a large glycemic index, Walsh and Roberts 20 proposed the delivery of a “superbolus”, increasing the standard bolus and then reducing the basal insulin rate over a period of time. However, direct demonstration of the effectiveness of this approach has not been provided in the OL or CL setting.
An OL approximation to the superbolus is the so-called iBolus, a methodology for CGM-based calculation of the prandial insulin dose, which results, in most occasions, in a greater-than-usual bolus followed by a transient reduction of basal infusion. The iBolus was validated in a previous study 21 showing that the use of an OL “superbolus” is feasible and efficient when combined with a proper subsequent decrease of the basal insulin controlling small meals (40 g CHO).
Chase et al. 22 showed that adding 30% to insulin bolus calculated by I:CH ratio was the best option to control PP glycemic excursion in comparison to either a standard bolus or a bolus 15 min before the meal in CL studies. PP hyperglycemic excursions in that study were much higher than in our study (glucose peak 220 vs. 183 mg/dL, respectively), however, the study included adolescents and the meal was a breakfast. A different approach, focused on the reduction of the incidence of PP hypoglycemia, was adopted by Elleri et al. 23 They compared CL therapy with a 25% reduction of prandial boluses against standard prandial insulin boluses. However, hypoglycemia was very rare in both groups and no demonstration of greater safety was found.
Regarding our SMRC-based algorithm, it was previously evaluated in a cohort of 10 adult virtual patients in a 16-h protocol (8:00 to 24:00 h), including three meals in 10 days. With this algorithm, potentially severe hypoglycemic events (<50 mg/dL) were almost inexistent, the percentage of time <70 mg/dL was reduced more than a half, and there was not an increase in time >180 mg/dL. 13 Certainly, our study was intended to translate these in silico results into a clinical study protocol. The protocol was designed to evaluate the performance of a new CL algorithm in improving PP glycemic control (time spent in desired ranges) and intrasubject glucose variability. In our study, an augmented prandial bolus was given in the context of an SMRC CL system that limits insulin delivery when IOB is unacceptably high, independent of glycemic value. As a consequence, delivery of a “superbolus” was immediately translated into a basal infusion shutoff, due to the glucose target modulation triggered by the violation of the IOB limit by the bolus. Basal infusion was then restored, driven by the PID controller once IOB returned to values below limit. The main advantage of our CL system was that it significantly reduced both early and late PP hyperglycemia exposure (>50% reduction in time spent >180 mg/dL) without a significantly increased risk of hypoglycemia.
The critical point in the SMRC controller is the adjustment of the IOB limit. Too high values may cause the outer loop being inactive and ineffective, reducing the risk of hypoglycemia. On the other side, too small values can make the internal control loop irrelevant. A general tuning of the IOB limit will lead to different values according to different situations: PP state, exercise, night control, and so on. We would like to emphasize that due to its nature, the algorithm for CL control-based SMRC may be combined to main CL controllers of any nature, offering thus a generalized safety system to avoid overcorrection problems, including PP glucose control. An additional advantage of this approach is that the SMRC loop does not affect the structure of the inner controller, which could be designed independently. Finally, the SMRC loop may also allow a more aggressive tuning of the inner controller if necessary.
Glycemic variability was another objective of our study. From our results, our CL algorithm did not improve glucose variability. However, the analysis of temporal series showed that differences in PG values between the repeated CL studies were lower than those observed in the OL experiments, suggesting a higher reproducibility of CL results. Importantly, the efficacy of CL controllers against glucose variability has not been specifically evaluated in previous studies. For instance, the 48-h duration outpatient study published by Van Bon et al. included repeated meals, but they were not controlled regarding the composition and preprandial conditions, making comparisons with our study difficult. 2 Some recent long-term free-living studies have evaluated daytime glycemic variability. Although the PP periods were not systematically investigated in Thabit et al., 5 this study showed a reduction of interday daytime variability expressed as CV from 19% with OL to 16% with CL in the adult cohort. In contrast, the highly controlled conditions of our study (two to three times lower variability) probably preclude any improvement in variability.
The use of our CL controller was associated with a statistically significant increase in the total insulin dose (average 0.008 U/kg body weight). However, this increase does not seem clinically relevant and probably it is not enough to explain the beneficial effect observed on PP glucose excursions with CL, indirectly indicating that not only the total insulin dose but also how insulin infusion was implemented contribute to glucose control.
We are aware that our study has some limitations. It was designed and performed in a clinical research inpatient environment, including a manually implemented controller action in a current context of fully automatic control at-home studies to fulfill regulatory conditions before moving to an outpatient scenario. However, this was not in detriment of unreasonably higher sampling periods. Remark, for instance, the Florence system from Cambridge University, with extensive validation in inpatient and outpatient settings, uses 12 min as the sampling period, compared to 15 min in our case. 24 We used a single meal with a specific composition, which was given in a specific time frame of the day. This limits extrapolation of results to other meal compositions and daily life conditions.
In summary, our CL algorithm is able to effectively, consistently, and safely control the PP glycemic excursions, diminishing hyperglycemia in the postabsorptive state without a clinically meaningful increasing risk of hypoglycemia under controlled conditions in a feasibility study. Future studies, including those in transitional settings and also at home, are necessary to further validate our results in free daily life conditions.
Footnotes
Acknowledgments
We would like to thank Judith Viaplana, Sara Correa, and Geles Viguer for their technical support during the experiments. We also acknowledge the altruistic participation of the patients. This work was supported by the Spanish Ministry of Economy and Competitiveness through Grants DPI2013-46982-C2-1-R and DPI2013-46982-C2-2-R, and the EU through FEDER funds. C.Q. is the recipient of a grant from the Hospital Clínic i Universitari of Barcelona (“Ajut a la recerca Josep Font 2014-2017”).
Author Contributions
P.R. and C.Q. designed the project, performed the experiments, researched data, wrote the article, contributed to discussions, and reviewed/edited the article. V.M., A.C., F.L., and E.M. researched data and reviewed the article. M.G., F.J.A.-B., I.C., J.B., and J.V., designed the project, researched data, wrote the article, contributed to discussion, and reviewed/edited the article.
Author Disclosure Statement
No competing financial interests exist.