
Abstract
Background:
We aimed to compare closed-loop glucose control for people with type 1 diabetes undertaking high-intensity interval exercise (HIIE) versus moderate-intensity exercise (MIE).
Methods:
Adults with type 1 diabetes established on insulin pumps undertook HIIE and MIE stages in random order during automated insulin delivery via a closed-loop system (Medtronic). Frequent venous sampling for glucose, lactate, ketones, insulin, catecholamines, cortisol, growth hormone, and glucagon levels was performed. The primary outcome was plasma glucose <4.0 mmol/L for ≥15 min, from exercise commencement to 120 min postexercise. Secondary outcomes included continuous glucose monitoring and biochemical parameters.
Results:
Twelve adults (age mean ± standard deviation 40 ± 13 years) were recruited; all completed the study. Plasma glucose of one participant fell to 3.4 mmol/L following MIE completion; no glucose levels were <4.0 mmol/L for HIIE (primary outcome). There were no glucose excursions >15.0 mmol/L for either stage. Mean (±standard error) plasma glucose did not differ between stages pre-exercise; was higher during exercise in HIIE than MIE (11.3 ± 0.5 mmol/L vs. 9.7 ± 0.6 mmol/L, respectively; P < 0.001); and remained higher until 60 min postexercise. There were no differences in circulating free insulin before, during, or postexercise. During HIIE compared with MIE, there were greater increases in lactate (P < 0.001), catecholamines (all P < 0.05), and cortisol (P < 0.001). Ketones increased more with HIIE than MIE postexercise (P = 0.031).
Conclusions:
Preliminary findings suggest that closed-loop glucose control is safe for people undertaking HIIE and MIE. However, the management of the postexercise rise in ketones secondary to counter-regulatory hormone-induced insulin resistance observed with HIIE may represent a challenge for closed-loop systems.
Background
R
Metabolic responses to exercise can differ according to the type of exercise undertaken. 5 People with type 1 diabetes undertaking short, intense periods of exercise may experience increased glucose levels both during, and immediately following, exercise. 5 This may be attributed to an increase in circulating levels of glucose counter-regulatory hormones. 6 However, following the initial glucose elevations there is a risk of late-onset hypoglycemia, occurring up to 24–48 h postexercise, resulting from an increase in insulin sensitivity. 7 In contrast, exercise at moderate intensity can be associated with a risk of hypoglycemia during activity and in the postexercise recovery period, possibly because the counter-regulatory response is less pronounced. 6
An artificial pancreas or closed-loop insulin delivery system measures interstitial fluid glucose levels near-continuously, uses a computational algorithm to estimate the appropriate insulin dose to maintain glucose levels at target, and delivers the calculated dose of subcutaneous insulin. Closed-loop systems improve glycemia of people with type 1 diabetes compared with systems requiring manual insulin dosing decisions. 8 Nevertheless, the unpredictable and rapidly-changing insulin requirements associated with exercise remain challenging to closed-loop systems. 9
We hypothesized that metabolic control during closed-loop insulin delivery would differ when challenged by high-intensity interval exercise (HIIE) versus moderate-intensity exercise (MIE). The present study primarily aimed to examine the effectiveness of a closed-loop system to prevent hypoglycemia and maintain glucose in target range for adults with type 1 diabetes undertaking HIIE versus MIE, and secondarily investigated exercise-related metabolic changes in blood glucose, ketones, and lactate during closed loop, and assessed the association of changes in these parameters with observed changes in counter-regulatory hormone levels.
Methods
We conducted an open-label, two-stage, randomized, crossover study comparing metabolic profiles with HIIE versus MIE during closed-loop insulin delivery (ACTRN12615000137594;
Participants
Inclusion criteria were age >18 years, type 1 diabetes (fasting C-peptide <50 pmol/L) with HbA1c <9% (<75 mmol/mol), ability to undertake high-intensity exercise, insulin pump therapy for ≥6 months with established insulin delivery parameters, and CGM experience. Exclusion criteria included nephropathy (estimated glomerular filtration rate <60 mL min−1 1.73 m2), total daily insulin dose >150 units, diabetic ketoacidosis or steroid therapy within past 4 weeks, severe visual impairment, and pregnancy.
Closed-loop insulin delivery system
The investigational closed-loop system was a hybrid closed-loop system with a 4th generation sensor (MiniMed® 670G and Guardian® Sensor 3; Medtronic, Northridge, CA). The system measures interstitial fluid glucose levels and transmits the data in real-time for processing by a hybrid closed-loop algorithm, 10,11 which determines the insulin dose to be delivered to maintain the individual at glycemic target (6.7 mmol/L). The closed-loop system requires the total insulin daily dose over 48 h before activation is permitted. Sensor glucose, meal, and additional insulin delivery data are also used if available, but are not essential for closed-loop activation. The closed-loop algorithm has an option to temporarily increase the glucose target (this temporary target was 8.9 mmol/L for the first four participants and 8.3 mmol/L for subsequent participants following a software revision implemented for reasons unrelated to study outcomes). This is a time-based setting, where the user selects the duration that the temporary target remains activated (up to a maximum of 12 h), and which can be cancelled at any time. No other algorithm parameters are altered when the temporary increased target is engaged. Calibrations were performed with capillary blood glucose measured using a standardized blood glucose meter (CONTOUR® NEXT Link 2.4; Bayer Diabetes Care, Whippany, NJ).
Experimental protocol
Following a clinical assessment, each participant underwent a ramped exercise protocol on an upright cycle ergometer (Lode Excalibur, the Netherlands) until exhaustion. Breath-by-breath analysis of the volume and concentration of expired gases was achieved using an automated system (Jaeger Oxycon Pro, Germany) to determine maximal oxygen consumption (VO2 max) and anaerobic threshold (AT) by standardized criteria. 12 VO2 max and AT were then used to determine the experimental parameters used for the exercise interventions, as detailed below.
Participants were educated about the use of all functions of the study closed-loop system. The study insulin pump was programmed with the participant's usual basal and bolus delivery parameters. Two glucose sensors were inserted: an Enlite Enhanced Sensor (Medtronic) linked to the participant's own insulin pump, and a Medtronic fourth-generation sensor linked to the study pump. A run-in period of ≥6 days preceded each exercise study, during which participants undertook their usual daily activities, wore their own pump to deliver insulin, and wore the study pump which received sensor glucose information. The study pump was operated in open-loop mode, with insulin delivery programmed identically to the participant's own pump although without insulin delivered to the participant. Participants were instructed to perform ≥6 capillary blood glucose meter readings per day during run-in, and to input all glucose readings into the study pump.
Exercise protocols
Both exercise stages included a 45-min stationary bicycle exercise protocol of approximately equal energy expenditure. The HIIE protocol involved a 5-min warm-up at workload 25% VO2 max, followed by six 4 min intervals of exercise at an intensity mid-way between AT and VO2 max, followed by 2-min rest (with an additional 4-min rest between third and fourth repetitions). Rest was conducted at zero workload during which participants could choose to either remain stationary or to cycle against no resistance. The MIE protocol involved a 5-min warm-up at workload 25% VO2 max, followed by 40-min steady-state exercise at workload 70% of AT.
Exercise study days
Participants consumed a light breakfast (∼40 g carbohydrate) at ∼06:00 h, preceded by an insulin bolus through their own pump to account for the carbohydrate content of the meal. Following arrival at the trial center, insulin delivery was commenced through the study pump and the participant's own pump was disconnected. At ∼08:00 h, closed loop was activated. After 60 min in closed loop, 120 min pre-exercise, the temporary increased glucose target was activated until 15 min postexercise completion. A muesli bar containing 20 g carbohydrate was consumed 15 min before exercise if plasma glucose was ≤10 mmol/L for the first five participants; and this was revised to plasma glucose ≤8 mmol/L for subsequent participants. An insulin bolus was not administered with the pre-exercise carbohydrate. Exercise commenced 3 h after closed-loop activation in both stages. Nonarterialized venous samples were collected at 60-min intervals for the first 120 min following closed-loop activation, then at 15-min intervals from 60 min pre-exercise until 120 min post-exercise completion for measurement of glucose, lactate, ketones, free insulin, epinephrine, norepinephrine, dopamine, cortisol, growth hormone, and glucagon. Following sample collection, participants returned to using their own insulin pump.
Biochemical analyses
Plasma glucose and lactate were measured by a YSI analyzer (YSI 2300 STAT Plus Glucose Analyzer; YSI Life Sciences, Yellow Springs, OH). Glucose assay coefficients of variation (CVs) were as previously described 13 ; and lactate intra-assay CVs were 1.5% at 4.9 mmol/L, and 2.6% at 9.7 mmol/L.
Serum ketones were measured using a FreeStyle Optium Neo Ketone Meter and β-ketone test strips (Abbott Diabetes Care, Alameda, CA). Intra-assay CV as reported by the manufacturer was 3.8% at 1.5 mmol/L.
Plasma anti-insulin antibodies and free insulin concentrations were measured through radioimmunoassay as previously described. 13 Adrenaline, noradrenaline, and dopamine were measured on heparinized plasma with a sodium metabisulfite additive, by high-performance liquid chromatography on an Ultimate 3000, Dionex (Thermo Fisher Scientific, Waltham, MA) as previously described. 14 Glucagon was measured on heparinized plasma collected with aprotinin using the Glucagon RIA Kit, with inter-assay CV 7.3% at 18.7 pmol/L, and 6.4% at 41 pmol/L (Millipore, Billerica, MA). Serum cortisol was quantified immunometrically by chemiluminescence (Thermo Fisher Scientific). The inter-assay CV was 6.0% at 95 nmol/L, and 3.4% at 449 nmol/L. Serum growth hormone was quantified immunometrically by chemiluminescence with the IMMULITE® 2000 Systems Analyzer (Siemens Healthcare Diagnostics, UK). The inter-assay CV was 6.5% at 2.5 mcg/L and 4.2% at 7.9 mcg/L.
Statistical analysis
Analyses conducted were exploratory, with an absence of available data allowing calculations of statistical power. Analyses were undertaken and figures created using STATA Version 14.0 (StataCorp, College Station, TX) and GraphPad Prism version 7.00 (GraphPad, La Jolla, CA). Descriptive statistics were used to describe parameters of interest. The primary outcome of interest was YSI plasma glucose <4.0 mmol/L for at least 15 min, from exercise commencement to 120 min post-exercise. Secondary outcomes relating to CGM parameters, including total% time spent in target glycemia (4–10 mmol/L), hypoglycemia (<4.0 mmol/L), and hyperglycemia (>10.0 mmol/L) for the predetermined study phases (pre-exercise, exercise, and post-exercise), and the positive incremental area under the sensor glucose curve (AUC), 15 were compared using the Student's paired t-tests with Bonferroni correction. Biochemical parameter levels were compared between HIIE and MIE during the three phases (pre-exercise, during exercise, and post-exercise) using two-way repeated-measures analysis of variance and Student's paired t-tests with Bonferroni correction where appropriate. A surrogate marker of insulin resistance (plasma glucose/plasma-free insulin) 16 was used. The level of statistical significance was set at two-tailed P < 0.05. Results are presented as mean ± standard error, unless otherwise specified.
Results
Nine women and three men were approached and assessed for eligibility. All qualified for inclusion, undertook the study, and completed the study protocol. Participant clinical characteristics are summarized in Table 1; all participants had normal awareness of hypoglycemia with Gold scores ≤3. 17 There were five exercise bouts involving the first five participants (two MIE and three HIIE), where 20 g carbohydrate was administered pre-exercise for plasma glucose ≤10 mmol/L. For the remaining participants, one (HIIE) required carbohydrate administration, where plasma glucose was ≤8 mmol/L pre-exercise as per the amended protocol.
Continuous data are presented as mean ± standard deviation. Categorical data are presented as frequency (%).
GFR, glomerular filtration rate.
Glucose levels
Regarding the primary outcome of interest, during MIE one participant had a plasma glucose of 3.8 mmol/L with symptomatic hypoglycemia at the completion of exercise, reaching plasma glucose nadir 3.4 mmol/L 15 min post-exercise, and was treated with 30 g oral carbohydrate twice over 20 min. There were no plasma glucose levels <4.0 mmol/L for HIIE. No CGM glucose values were <4.0 mmol/L for either HIIE or MIE.
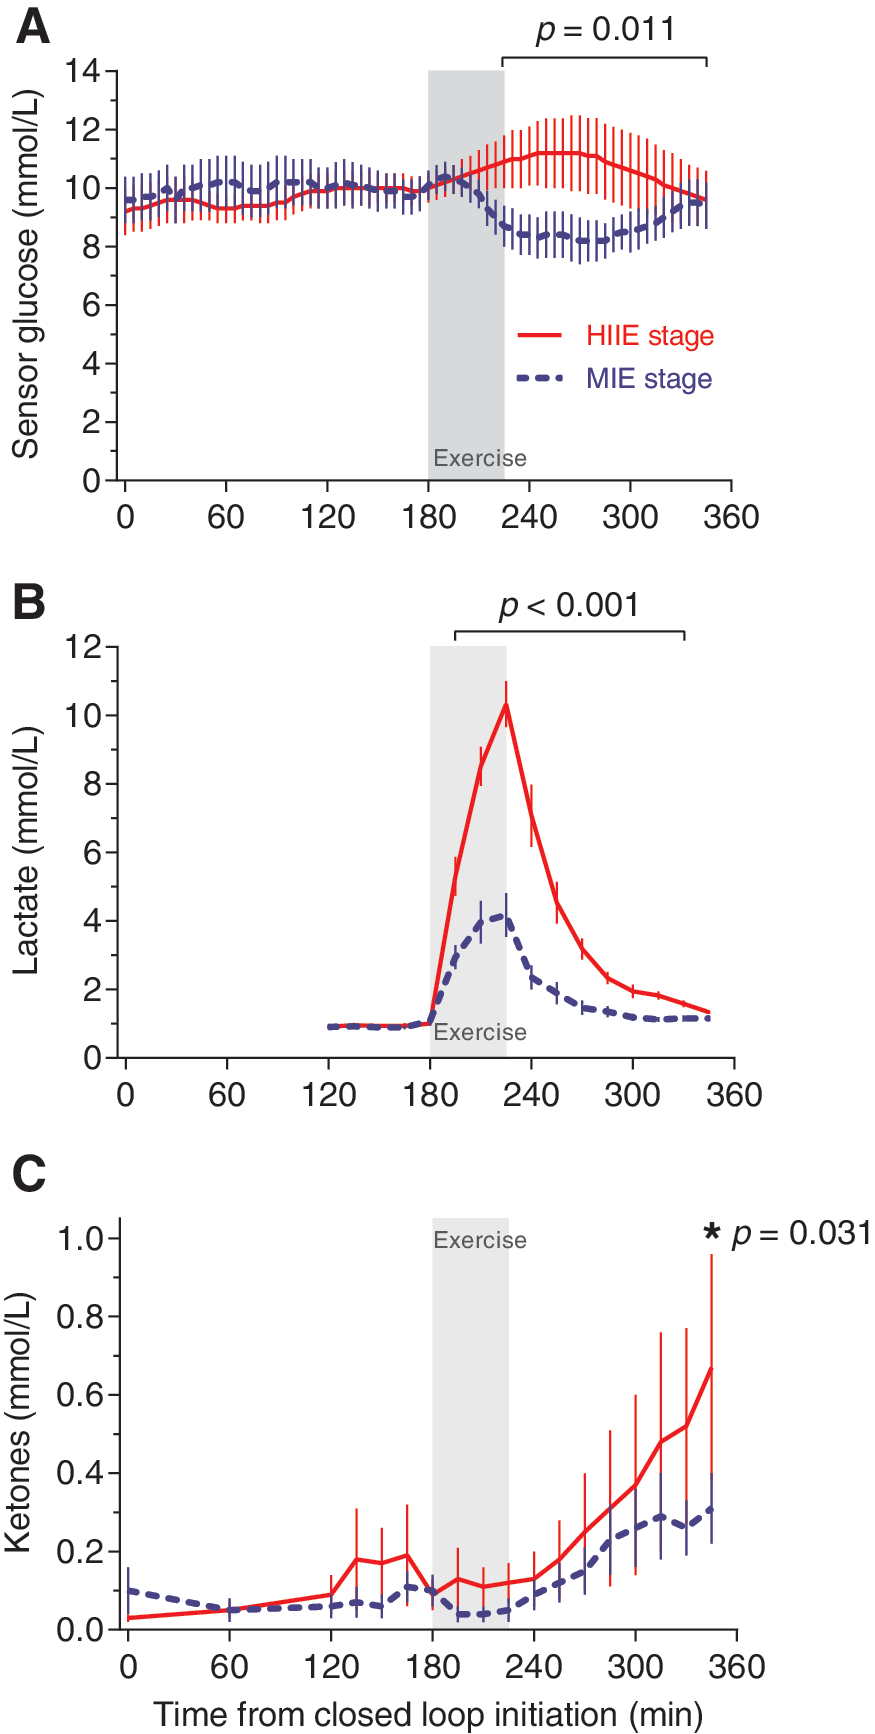
Plasma glucose was not different pre-exercise for HIIE versus MIE (9.9 ± 0.6 mmol/L vs. 9.9 ± 0.7 mmol/L, respectively; P = 0.39). During exercise, it increased progressively for HIIE and reduced for MIE (P < 0.001 for interaction). Mean plasma glucose was greater 30 min after commencement of exercise during HIIE than MIE (11.3 ± 0.5 mmol/L vs. 9.7 ± 0.6 mmol/L, respectively; P < 0.001), and remained higher at 60 min postexercise completion (11.1 ± 1.3 mmol/L vs. 8.9 ± 0.8 mmol/L, respectively; P < 0.001).
Sensor glucose percent time-in-target range (4–10 mmol/L) did not differ significantly during HIIE versus MIE either pre-exercise (53.4 ± 1.7% vs. 51.6 ± 1.9%, respectively; P = 0.25), during exercise (45.0 ± 3.6% vs. 51.7 ± 3.8%, respectively; P = 0.60), or postexercise (54.5 ± 2.7% vs. 76.0 ± 1.9%, respectively; P = 0.17; Fig. 1A).
Profiles by study stage of
The positive incremental AUC of sensor glucose>10 mmol/L was not different for HIIE versus MIE either during the 180 min pre-exercise (121±8min.mmol/L vs. 195±9min.mmol/L, respectively; P = 0.11) or overall during the 45 min of exercise (50±5min.mmol/L vs. 30±3min.mmol/L; P = 0.22). In contrast, during the 120 min post-exercise, the AUC of sensor glucose >10 mmol/L was higher after HIIE than MIE (238±18min.mmol/L vs. 54±7min.mmol/L, respectively; P = 0.011).
Lactate levels
Plasma lactate was not different at baseline for HIIE versus MIE (0.9 ± 0.1 mmol/L vs. 0.9 ± 0.0 mmol/L, respectively; P = 0.50; Fig. 1B). The difference between the two stages became significant 15 min after commencement of exercise (P < 0.001 for interaction), with a greater increment from baseline during HIIE compared with MIE (6.2 ± 0.4 mmol/L vs. 3.0 ± 0.4 mmol/L, respectively; P < 0.001). Following exercise completion, there was a rapid reduction of lactate during both stages (P < 0.001), with a mean difference between HIIE versus MIE of 1.1 ± 0.5 mmol/L (P = 0.031) at 60 min following exercise completion.
Ketone levels
The increment in serum ketones was greater after HIIE than MIE, reaching significance at the end of the observation period, when the stages continued to diverge (P = 0.031 at 120 min following exercise completion; Fig. 1C).
Insulin delivery and circulating free insulin levels
The insulin delivery rate (Fig. 2A) did not differ for HIIE versus MIE pre-exercise (1.14 ± 0.12 units/h vs. 1.00 ± 0.12 units/h, respectively; P = 0.34), during exercise (1.14 ± 0.21 units/h vs. 1.00 ± 0.14 units/h, respectively; P = 0.39), or post-exercise (1.33 ± 0.19 units/h vs. 1.05 ± 0.15 units/h, respectively; P = 0.08).

Profiles by study stage of
Circulating free insulin levels (Fig. 2B) were similar for HIIE versus MIE pre-exercise (76 ± 7 pmol/L vs. 77 ± 8 pmol/L, respectively; P = 0.87), during exercise (75 ± 11 pmol/L vs. 82 ± 9 pmol/L, respectively; P = 0.35), and post-exercise (74 ± 6 pmol/L vs. 71 ± 8 pmol/L, respectively; P = 0.60).
The ratio of plasma glucose/plasma-free insulin (Fig. 2C) was similar for HIIE and MIE pre-exercise (1.0 ± 0.1 × 10⁹ vs. 1.0 ± 0.1 × 10⁹, respectively; P = 0.90), though was significantly greater during exercise and at 15 min post-exercise for HIIE compared with MIE (1.4 ± 0.2 × 10⁹ vs. 0.9 ± 0.2 × 10⁹, respectively; P = 0.031).
Glucose counter-regulatory hormones
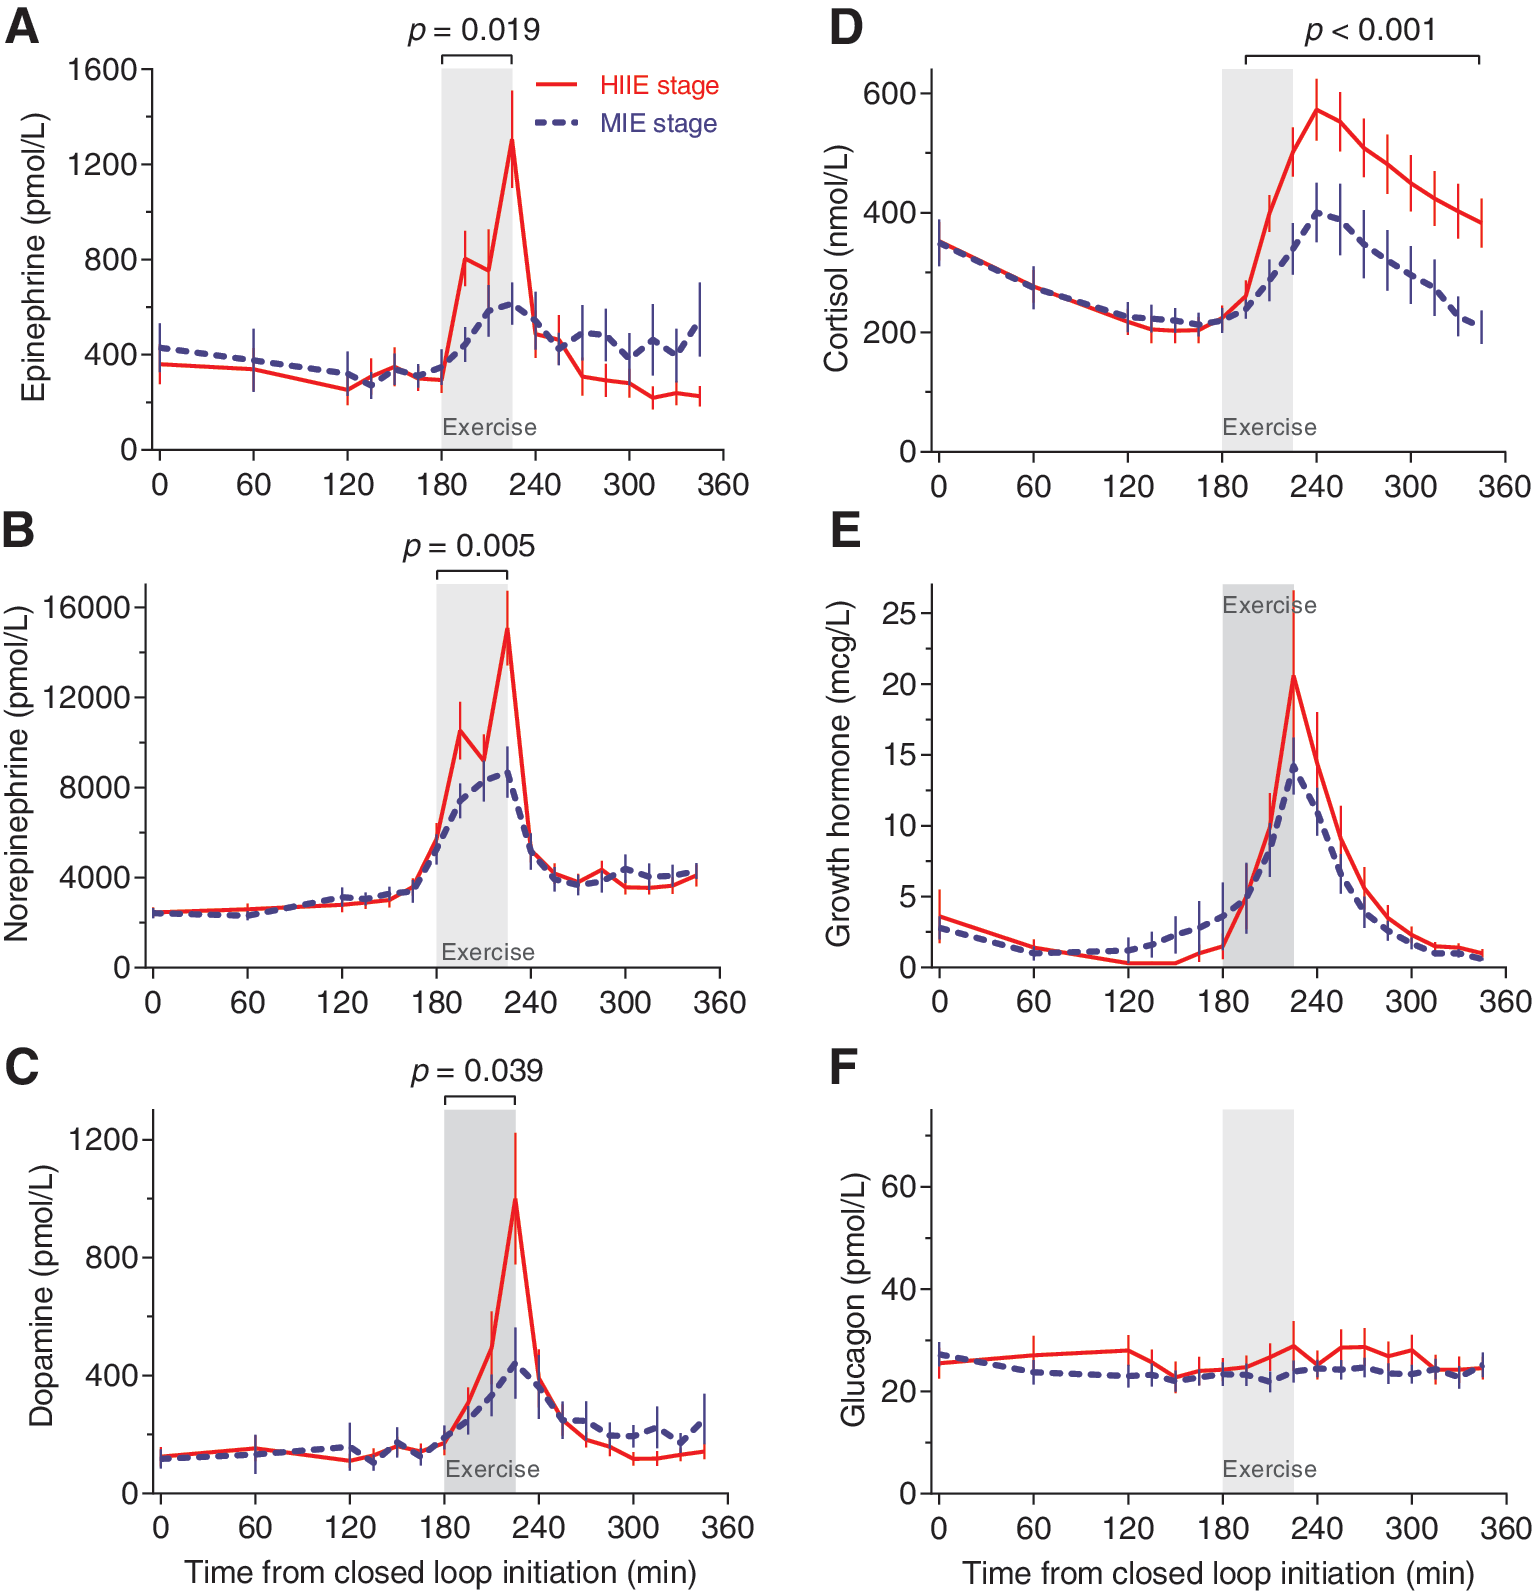
Catecholamine levels (epinephrine, norepinephrine, and dopamine) were similar for HIIE and MIE before exercise (Fig. 3A–C). During exercise, epinephrine increased with both regimens, although the increase was greater for HIIE than MIE (777 ± 110 pmol/L vs. 498 ± 80 pmol/L, respectively; P = 0.019) as was the case with norepinephrine (10,024 ± 872 pmol/L vs. 7416 ± 686 pmol/L, respectively; P = 0.005), and dopamine (491 ± 88 pmol/L vs. 304 ± 59 pmol/L, respectively; P = 0.039).
Profiles by study stage of
There were no differences in pre-exercise cortisol levels between HIIE versus MIE (243 ± 23 nmol/L vs. 251 ± 26 nmol/L, respectively; P = 0.77), but the increment in cortisol was greater with HIIE than MIE during exercise (338 ± 23 nmol/L vs. 272 ± 22 nmol/L, respectively; P < 0.001) and post-exercise (472 ± 46 nmol/L vs. 328 ± 54 nmol/L, respectively; P < 0.001; Fig. 3D).
Growth hormone levels were similar at rest (Fig. 3E). The increase in growth hormone with HIIE versus MIE did not differ (pre-exercise: 1.1 ± 0.4 mcg/L vs. 1.9 ± 0.7 mcg/L, respectively; P = 0.68, during exercise: 9.2 ± 1.9 mcg/L vs. 7.7 ± 1.8 mcg/L, respectively; P = 0.23, post-exercise: 4.8 ± 1.2 mcg/L vs. 3.6 ± 0.8 mcg/L, respectively; P = 0.13).
Glucagon levels did not change from baseline with either HIIE or MIE (Fig. 3F)
Sensor performance and unplanned closed-loop exits
Sensor mean absolute relative difference (MARD) ± standard error of the mean versus reference plasma glucose was 9.2% ± 0.4% (432 paired readings). During exercise, MARD was 10.5% ± 1.5% for HIIE (n = 48) and 9.9% ± 1.6% MIE (n = 48). There were no unplanned exits from closed loop.
Conclusions
This study evaluated the relative performance of a hybrid closed-loop system, when challenged by HIIE and MIE, in adults with type 1 diabetes. There were no concerns regarding safety. A single episode of mild hypoglycemia was observed immediately post-MIE, and none was observed with HIIE. There were no episodes of severe hyperglycemia in either HIIE or MIE stages. The other principal study findings were: during closed-loop insulin delivery HIIE resulted in higher glucose levels and greater hyperglycemic exposure (as reflected by AUC >10 mmol/L) than MIE; a delayed rise in ketone levels, that was greater for HIIE than MIE, was observed; and elevations of counter-regulatory hormones were greater during HIIE, which may have impacted metabolic control through changes in insulin sensitivity despite closed-loop control.
To our knowledge, the majority of previous studies have incorporated moderate-intensity, predominantly aerobic, exercise protocols. 18 –21 This is the first study using a closed-loop insulin delivery system to have explored mechanisms responsible for differences in metabolic control during exercise of differing intensities.
Exercise poses unique challenges to people with type 1 diabetes, as variations in the intensity and duration of exercise can have wide-ranging effects on insulin requirements and glucose utilization. 22 While MIE reduces glucose levels both during and immediately following exercise, high-intensity exercise can increase glucose levels in the short term due to the release of counter-regulatory hormones. 14 We compared changes in metabolic parameters during HIIE vs. MIE with closed-loop insulin delivery using exercise protocols designed to have similar energy expenditure.
Differences in lactate levels confirmed that a greater proportion of HIIE occurred above the AT compared with MIE. A single episode of mild hypoglycemia was observed during MIE, and only modest excursions of hyperglycemia were observed during HIIE. There were no issues relating to safety in either exercise stage as reflected by the absence of severe hypoglycemia, sustained marked elevations in glucose above 15 mmol/L, and ketoacidosis. However, it should be recognized that there are differences in artificial pancreas control algorithms and caution should be taken in extending the observations from this study to other closed-loop systems.
A modest increase in glucose starting immediately post-exercise commencement was observed during HIIE. Insulin delivered by the closed-loop system and plasma-free insulin during study stages did not differ significantly. Differences between the HIIE and MIE plasma glucose/plasma-free insulin ratio, indicated that insulin resistance increased for the former group shortly after exercise commencement. This increase in insulin resistance coincided with and could account for the observed rise in glucose with HIIE and may have also contributed to the delayed rise in ketones.
The hybrid closed-loop algorithm employed in this study was primarily designed to prevent over-delivery of insulin to minimize hypoglycemia. 10,11 Infused insulin permissible by the control algorithm was capped by a maximum allowable delivery limit, which in combination with the raised glucose set-point may have been maladaptive for some of the participants in a setting of increased insulin resistance associated with HIIE.
Based upon our observations, we hypothesize that the observed increases in glucose and ketones were due to an increase in insulin resistance mediated predominantly by catecholamines and cortisol. Growth hormone elevations may also be a contributing factor, although would not explain the differences observed between HIIE and MIE, as levels of this hormone did not differ between the two exercise intensities.
Glucagon is unlikely to have played a major role, as there was no increase from baseline observed during either study stage. Our findings are in keeping with those of Shetty et al. in a group with type 1 diabetes managed with multiple daily injections or standard insulin pump therapy. 23 They also did not demonstrate increases in glucagon, with exercise protocols of increasing intensity while reporting increase in catecholamines, cortisol, and growth hormone. A likely explanation for the absence of a glucagon rise was the impaired glucagon secretion characteristic of adults with long-standing type 1 diabetes. 24 The mean duration of diabetes for the study participants was 24 years, and while islet alpha-cell function was not formally assessed, many would have been expected to have impaired glucagon secretion.
At present, closed-loop system control algorithms autonomously and continuously modulate insulin delivery in response to changes in real-time interstitial glucose, with the aim of minimizing hyper- and hypoglycemic excursions. 8 –10,20,21 In addition, current algorithms also account for the residual activity of insulin which has already been delivered when determining future insulin requirements. 10 Recent studies have demonstrated the glycemic benefits of closed-loop versus open-loop insulin delivery for people with type 1 diabetes. 8,25,26 However, there remain limitations to current closed-loop systems and strategies proposed to minimize hypoglycemia with exercise. These limitations are a consequence of the pharmacokinetics and pharmacodynamics of subcutaneously delivered rapid-acting insulin, which are characterized by a delayed onset of action and clearance of this hormone. 13,27 This was reflected in the minor insignificant changes in circulating free insulin levels observed in this study during and in the short term following exercise.
An additional contributing factor to the absence of a reduction in circulating free insulin with closed-loop delivery during exercise may have been the increased subcutaneous blood flow with exercise enhancing insulin absorption. 13 Finally, the complex carbohydrate taken by the small number of participants pre-exercise may have resulted in a minor increase in circulating glucose immediately before the onset of exercise, attenuating any reduction in insulin delivery by the closed-loop system. Therefore initiating a reduction in subcutaneous insulin delivery immediately before exercise may not allow sufficient time to prevent hypoglycemia due to the persistence of activity from insulin that has already been delivered and limitations in the counter-regulatory hormone response in people with type 1 diabetes. Conversely, the increase in closed-loop glucose target 2 h pre-exercise, as implemented in the present study, while appropriate for MIE, may have been counter-productive for HIIE and contributed to the observed mild hyperglycemia and postexercise ketosis.
The closed-loop system used in this study delivered insulin alone. A recent report by Taleb et al. indicated that a bihormonal approach, incorporating insulin and glucagon delivery, while not abolishing hypoglycemia during exercise, may minimize its occurrence. 21 The exercise protocols employed in the Taleb study were predominantly aerobic in nature, corresponding with MIE in this study.
However, it should be noted that a bihormonal approach may be particularly maladaptive with HIIE as the post-exercise fall in glucose would result not only in a reduction in delivered insulin, but also stimulate glucagon delivery which would be expected to have a greater adverse impact upon the ketosis than a closed-loop system delivering insulin alone. We suggest that under these circumstances the only appropriate response to minimize ketosis is carbohydrate ingestion although this has yet to be formally tested. Incorporating novel additional inputs to supplement the measurement of glucose, for example from sensors measuring lactate, ketones, and kinetic parameters, may assist an automated system to provide appropriate alerts.
Strengths of this study include the randomized, crossover design. The exercise regimens were standardized and implemented in a controlled setting, using VO2 max to determine AT and individualize exercise regimens accordingly. Lactate measurements subsequently provided an objective assessment distinguishing between the two exercise intensities. The investigational devices were standardized, and detailed biochemical profiles were assessed.
There are study limitations. This was an exploratory study with limited data for power calculations. The number of participants was small and lack of statistical significance, therefore, does not exclude an association. While HIIE and MIE protocols were equated for energy expenditure in the study to strengthen the analyses, we do acknowledge that in a “real-life” setting, high-intensity exercise is often of shorter duration. There were minor protocol amendments relating to the temporary increased glucose target (necessitated by a software upgrade unrelated to the conduct of this study), and cut-off for extra carbohydrate pre-exercise, which may have had a minor influence upon the glucose profiles, but would not have effected counter-regulatory hormone responses or ketone body formation.
The short duration of closed loop did not enable assessment of the risk of late-onset hypoglycemia, or full evaluation of the development of ketosis postexercise. Further research is required. In addition, the majority of participants were not at a plateau glucose level at the commencement of closed loop, with mean starting glucose of 9.5 mmol/L. This may have predisposed to hyperglycemia in the HIIE stage, and increased the risk of hypoglycemia in the MIE stage, due to insulin being delivered to bring glucose down to the target of 8.3 mmol/L just before exercise commencing. Nevertheless, in clinical practice, very few individuals have the luxury of embarking upon exercise with glucose levels at a steady state and most would not defer exercise due to a glucose level of 9.5 mmol/L.
Optimizing metabolic control, both during and after exercise, remains a high priority for people with type 1 diabetes and their clinicians. Our findings address current gaps in published literature with regard to closed-loop systems and different exercise intensities, and may better inform clinical practice and guide further exploration into improving closed-loop systems as highlighted above.
In conclusion, even with the application of closed-loop technology, HIIE and MIE still had a differential impact on plasma glucose levels. Although, the incidence of hypoglycemia during and immediately following both HIIE and MIE was minimal, and hyperglycemic excursions were limited, mean glucose and ketone levels increased with HIIE. These observations reflect the consequence of the limitations associated with subcutaneous insulin delivery and the reliance on glucose measurements alone as inputs into a closed-loop system. The next generation of closed-loop systems may benefit from the incorporation of additional inputs such as lactate, ketone, and kinetic measurements.
Footnotes
Acknowledgments
The authors thank all the volunteers for their participation and enthusiasm. They acknowledge the assistance of Judith Gooley, Varuni Obeyesekere, Wade Brownlee, and Tanya Wilson with processing and analyzing the biochemical samples, and Dr. Sara Vogrin for assistance with the statistical analysis. This project was funded by a St Vincent's Hospital Melbourne Research Endowment Fund Grant. S.A.M. is supported by a University of Melbourne postgraduate scholarship. A.L.G. is supported by a Career Development Scholarship from the National Health and Medical Research Council and a Future Leaders Fellowship from the National Heart Foundation of Australia. A.J.J. is supported by a Sydney Medical School Fellowship from the University of Sydney.
Authors' Contributions
D.C.J. contributed to study design, participant recruitment, protocol implementation, data collection, and data analysis. S.A.M. and D.N.O. conceived the study and were involved in all aspects of the study. J.C.H. contributed to study design, participant recruitment, protocol implementation, and data collection. A.L.G. and T.J.R. contributed to study design, protocol implementation, and interpretation of data. A.J.J. contributed to study design and protocol implementation. G.M.W. contributed to data analysis. R.J.M. contributed to protocol implementation. A.R., B.G., and N.K. provided technical support. All authors were involved in drafting the article (D.C.J., S.A.M., D.N.O.) or revising it critically for important intellectual content (J.C.H., A.L.G., A.J.J., G.M.W., R.J.M., T.J.R., A.R., B.G., N.K.). All authors approved the final article version. D.C.J. and D.N.O. are the guarantors of this work.
Author Disclosure Statement
S.A.M. has received travel support from Novo Nordisk. A.J.J. is on an advisory board for Medtronic and has received honoraria from Medtronic. R.J.M. has received research funding and travel support from Novo Nordisk. A.R., B.G., N.K. are employees of Medtronic. D.N.O. has been on advisory boards, received honoraria and research support from Novo Nordisk and Medtronic. All other authors declare that there is no duality of interest associated with their contribution to this article.