




Abstract
Background:
SAR342434 is a biosimilar follow-on of insulin lispro-Humalog®. This study aimed to show similar efficacy, safety, and immunogenicity of SAR342434 (SAR-Lis) versus insulin lispro-Humalog (Ly-Lis) in adult patients with type 1 diabetes (T1DM) treated with multiple daily injections while using basal insulin glargine (Lantus®; GLA-100).
Materials and Methods:
SORELLA-1 was a randomized, open-label phase 3 study (NCT02273180). Patients completing the 6-month main study continued on SAR-Lis or Ly-Lis, as randomized, for a 6-month safety extension. Assessments included change in HbA1c, fasting plasma glucose (FPG), seven-point self-monitored plasma glucose (SMPG) profiles, hypoglycemic events, treatment-emergent adverse events (TEAEs), and anti-insulin antibodies (AIAs).
Results:
Five hundred seven patients were randomized (SAR-Lis n = 253; Ly-Lis n = 254). Least square (LS) mean (SEM) change in glycosylated hemoglobin (HbA1c) (baseline to week 26; primary endpoint) was similar in both treatment groups (SAR-Lis: −0.42% [0.051]; Ly-Lis: −0.47% [0.050]). Noninferiority at prespecified 0.3% noninferiority margin and inverse noninferiority were demonstrated (LS mean difference of SAR-Lis vs. Ly-Lis: 0.06% [95% confidence interval: −0.084 to 0.197]). At week 52 (end of extension period) versus week 26, a small HbA1c increase was observed in both groups. FPG and seven-point SMPG profile changes, including postprandial glucose excursions, were similar between groups. At week 52, similar changes in mean daily mealtime and basal insulin doses were observed. Hypoglycemia, TEAEs, and AIAs (incidence, prevalence) did not differ between groups.
Conclusions:
Results from this controlled study in patients with T1DM also using GLA-100 support similar efficacy and long-term safety (including immunogenicity) of SAR-Lis and Ly-Lis.
Introduction
I
Insulin lispro (rDNA origin) is homologous to human insulin with the exception of the penultimate lysine and proline residues on the C-terminal end of the B-chain at B28 and B29, which are reversed. This modification does not alter insulin receptor binding, but results in a more rapid onset of action for this analog insulin. It is the active ingredient of Humalog® (Lilly; Ly-Lis) that is indicated to improve glycemic control in adults and children with diabetes mellitus. It has been approved and marketed in the European Union (EU) and in the United States (US) and many other countries worldwide since 1996 and is used in the treatment of both patients with T1DM and type 2 diabetes. SAR342434 (SAR-Lis) has the same amino acid sequence and corresponding structure as the reference product, the originator's insulin lispro.
SAR-Lis has been developed as a similar biological medicinal product to Ly-Lis (100 U/mL) in accordance with relevant US and EU guidelines, including the EU guidelines for similar biological medicinal products as well as indication-specific guidelines. 5 –9 SAR-Lis was shown to be highly similar to Ly-Lis through physicochemical analyses, in vitro and in vivo nonclinical studies. Similar pharmacokinetic (PK) exposure and pharmacodynamic (PD) activity were demonstrated for SAR-Lis in both Ly-Lis approved in the European Union and Ly-Lis approved in the United States as well as between Ly-Lis US and Ly-Lis EU in a PK/PD study in patients with T1DM using the euglycemic clamp technique. 10
This study presents the results of the multinational, open-label, randomized, controlled phase 3 study (SORELLA 1), comparing the efficacy and safety of SAR-Lis and the reference drug Ly-Lis (100 U/mL) in patients with T1DM.
Study design and subjects
SORELLA 1 was a multicenter, two-arm, parallel-group, open-label phase 3 study in patients with T1DM who were treated before screening with MDI of insulin lispro or insulin aspart in combination with GLA-100 and who were randomized (1:1) to SAR-Lis or Ly-Lis both in combination with GLA-100. The study consisted of a 26-week main study period, including the evaluation of the primary efficacy endpoint, and a 26-week safety extension period. The primary efficacy objective was to demonstrate noninferiority of SAR-Lis versus Ly-Lis in terms of HbA1c change from baseline to week 26 at a noninferiority margin of 0.3% in adult patients with T1DM also using GLA-100. The study was approved by relevant review boards/ethics committees and was performed in accordance with the Declaration of Helsinki and the International Conference on Harmonisation guidelines. All participants provided written informed consent. Registration in
Eligible patients were ≥18 years of age with T1DM diagnosed for at least 12 months at the time of the screening visit (C-peptide and antibodies, such as antiglutamic acid decarboxylase antibodies, were considered supportive, but were not used to establish diagnosis), with HbA1c in the range of 7%–10%, and treated with GLA-100 as basal insulin and insulin lispro (Humalog/Liprolog®) or insulin aspart (NovoLog/NovoRapid) as rapid-acting mealtime insulin in an MDI regimen for at least 6 months. Excluded were patients with body–mass index (BMI) ≥35 kg/m2, noninsulin antidiabetic treatments or the use of CSII, history of severe hypoglycemia requiring treatment by emergency room admission, and poor metabolic control requiring hospitalization, all in the last 6 months before screening.
A total of 480 randomized patients were planned. Randomization was stratified by HbA1c obtained at the screening visit (<8.0%, ≥8.0%), prior use of Humalog/Liprolog (Yes, No), and geographical region (Non-Japan, Japan). The patients were randomized (1:1) to either SAR-Lis or Ly-Lis plus GLA-100.
The comparator drug in the study was Ly-Lis. Patients randomized to Ly-Lis received US- or EU-approved Ly-Lis, depending on the location of their study site. Based on the similarity between Ly-Lis US and Ly-Lis EU shown in the PK/PD study, 10 data from both insulins were pooled in the comparator group of this study.
Clinical visits were scheduled for screening, randomization (day 1), weeks 4, 8, 12, 20, and 26 (6-month endpoint), and weeks 40 and 52 (12-month endpoint). Study medications were dispensed on day 1 and weeks 4, 8, 12, 20, 26, and 40. Self-monitored plasma glucose (SMPG) and insulin dose data were obtained from the patient's diary at each visit when compliance was checked by reviewing the patient's diary and counting/collecting used and unused pens. The starting dose of SAR-Lis or Ly-Lis was a unit-to-unit conversion from the Humalog/Liprolog or Novolog/NovoRapid dose used before the trial. SAR-Lis and Ly-Lis were to be injected subcutaneously (SC) immediately before meal intake using an insulin pen. Occasional postprandial injections soon after meal intake were permitted if deemed necessary and if allowed by the national product label for Ly-Lis. Mealtime insulin dose was adjusted for a target range at 2-h postprandial plasma glucose of 120–160 mg/dL (6.7–8.9 mmol/L). The starting dose of GLA-100 was the same as the prestudy dose. GLA-100 was injected SC once daily at the same time as before the study using a SoloSTAR® pen; dose adjustments were made to achieve a fasting, prebreakfast plasma glucose of 80–130 mg/dL (4.4–7.2 mmol/L). No formal titration algorithm was recommended for basal insulin, and patients were instructed to use dosage self-adjustment of rapid-acting insulin analogs according to local guidelines to achieve target glucose while avoiding hypoglycemia.
Efficacy and safety assessments
HbA1c and fasting plasma glucose (FPG) were determined in a central laboratory blinded for treatment (Covance, Indianapolis, IN) at screening (HbA1c only), randomization (day 1), week 12, week 26 (6-month endpoint), week 40, and week 52 (12-month endpoint). Determination of seven-point SMPG was done premeal and 2-h postmeal for breakfast, lunch, and dinner and at bedtime and had to be performed on at least 2 days in the week before randomization (day 1), week 12, week 26 (6-month endpoint), week 40, and week 52 (12-month endpoint) using the Bluetooth-enabled glucometer myGlucoHealth (Entra Health Systems, San Diego, CA) and transferred through Bluetooth to the electronic diary (e-diary; CRF Health, Plymouth Meeting, PA). SMPG data were analyzed when at least five of the seven SMPG measurements requested were available for at least one profile in the requested timeframe before a visit. Hypoglycemic events and insulin doses were to be documented by the patient in the e-diary. SMPG data and patient-reported data in the e-diary were electronically transferred to the vendor web-based portal.
Blood samples for determination of anti-insulin antibodies (AIAs) were taken at baseline, week 4, week 12, week 26, and during the extension period at week 40 and week 52. Anti-SAR-Lis antibodies were determined employing a validated radioimmunoprecipitation assay 11 in a central laboratory blinded for treatment. The assay was validated in agreement with recent literature. 11
Adverse events, including hypersensitivity events and injection site reactions, were documented at each visit. Further safety monitoring included hematology and clinical chemistry, as well as body weight.
An Allergic Reaction Assessment Committee (ARAC) consisted of four experts: three who were board certified in allergy and clinical immunology and reviewed all hypersensitivity reactions reported on a specific allergic reaction AE form or identified by MedDRA search and one who was certified in diabetes mellitus and reviewed all cases of potential effects of AIAs on efficacy (insulin dose, HbA1c) and safety (hypoglycemia, injection site, and hypersensitivity reaction).
Outcomes
Efficacy outcomes included change from baseline in HbA1c, FPG, and seven-point SMPG profiles and postprandial plasma glucose excursions (difference between 2-h postprandial and preprandial plasma glucose values from seven-point SMPG profiles). The primary efficacy endpoint was the change in HbA1c from baseline to week 26. Safety outcomes included the percentage of participants reporting at least one hypoglycemic event, hypoglycemic event rates, the occurrence of treatment-emergent adverse events (TEAEs), including hypersensitivity and injection site reactions, and change in body weight and in clinical laboratory and hematology parameters. Hypersensitivity events and injection site reactions were identified using specific MedDRA codes. TEAEs were defined as events that occurred, worsened, or became serious from first investigational medicinal product (IMP) intake up to 1 day after last IMP intake.
Hypoglycemia was categorized based on the ADA definitions. 12 Documented hypoglycemia was defined as plasma glucose ≤70 mg/dL (3.9 mmol/L) and using the lower threshold of plasma glucose of <54 mg/dL (3.0 mmol/L). Nocturnal hypoglycemia was defined as any hypoglycemia that occurred between 00:00 and 05:59 hours. Severe hypoglycemia was an event requiring assistance of another person to actively administer carbohydrate, glucagon, or other resuscitative actions. Severe hypoglycemia associated with seizure, unconsciousness, or coma was to be reported as a serious adverse event (SAE).
Immunogenicity was assessed by incidence (patients newly positive postbaseline [treatment induced] or with ≥4-fold increase in titer [treatment boosted], i.e., patients with treatment-emergent AIAs) and prevalence (patients with at least one positive sample at baseline or postbaseline) of AIAs and using sample status, titer, and cross-reactivity to human insulin, insulin glargine, and insulin glargine M1 metabolite.
Data analyses and statistics
Efficacy analyses were performed in the intent-to-treat (ITT) population defined as all randomized participants, irrespective of compliance with the study protocol and procedures.
Noninferiority on the primary efficacy endpoint (change in HbA1c from baseline to week 26) was tested at the prespecified 0.3% margin, with an α level of 0.025 (one-sided). If noninferiority of SAR-Lis over Ly-Lis was demonstrated, using a hierarchical step-down testing procedure, the inverse noninferiority of Ly-Lis over SAR-Lis was tested. Least square (LS) means were obtained from a mixed-effect model for repeated measures (MMRM) using all available postbaseline HbA1c data, adjusted on treatment, randomization strata, visit, treatment-by-visit interaction, baseline, and baseline-by-visit interaction, and with an unstructured correlation matrix to model the within-patient errors. Parameters were estimated using the restricted maximum likelihood method with the Newton–Raphson algorithm, and denominator degrees of freedom were estimated using Satterthwaite's approximation.
A sample size of 480 patients (240 patients/arm) was calculated based on the primary analysis to ensure that the upper bound of the two-sided 95% confidence interval (CI) for the adjusted mean difference between SAR-Lis and Ly-Lis would not exceed 0.3% HbA1c with at least 90% power. This calculation assumes a common standard deviation of 1.0% and a true difference in HbA1c between the treatment groups of zero.
All other efficacy, safety, and immunogenicity analyses were descriptive and presented for the 12-month period only.
Safety analyses were based on the safety population, namely all participants randomized and exposed to at least one dose of IMP, regardless of the amount of treatment administered.
AIA analyses were based on the AIA population, defined as all patients from the safety population with at least one AIA sample available for analysis during the 12-month on-treatment period (from first IMP intake up to 1 day after last IMP intake).
All analyses were conducted using SAS Enterprise Guide, version 5.1.
Results
Patient characteristics
A total of 507 patients with T1DM were randomized to SAR-Lis (n = 253) or to Ly-Lis (n = 254); 506 patients were exposed to IMP (safety population) (Fig. 1). The ITT population (efficacy population) included a total of 507 patients.

Patient disposition. aPercent calculated versus the number of randomized patients; bIncludes serious hypoglycemia reported as SAEs; cFor nonserious events. SAE, serious adverse event.
Overall, 480 patients (94.7%) of the randomized population completed the 26-week treatment period, and 461 patients (90.9%) completed the 52-week treatment period. A similar number of patients in each treatment group discontinued the study treatment prematurely (SAR-Lis: 26/253 [10.3%]; Ly-Lis 19/254 [7.5%]). The most common reason was “other,” which included patient decision or consent withdrawal.
Baseline demographic characteristics were balanced between the treatment groups (Table 1), except for the group of elderly (≥65 years) and overweight (BMI ≥25 to <30 kg/m2), with more patients in the SAR-Lis group, although differences between the treatment groups were small. The mean age of the study population was 43.0 years, 44/507 (8.7%) patients were ≥65 years. The mean BMI at baseline was 26.0 kg/m2, with 92/507 (18.1%) patients having a BMI ≥30 kg/m2; 60.9% of the patients had screening HbA1c ≥8.0%. Disease characteristics (Table 2) showed that the mean duration of diabetes before start of the study was 19.05 years; in 74.8% of the patients, the diagnosis was known for ≥10 years. At study entry, all patients were using GLA-100 as basal insulin, and 60.6% of the patients had used insulin lispro (Humalog/Liprolog) within the last 6 months before screening. The baseline mean daily total insulin dose was 0.705 U/kg/day in the SAR-Lis group and 0.685 U/kg/day in the Ly-Lis group, with mean daily basal insulin dose of 0.340 U/kg/day in the SAR-Lis group and 0.330 U/kg/day in the Ly-Lis group and mean daily bolus insulin dose of 0.364 U/kg/day in the SAR-Lis group and 0.355 in the Ly-Lis group (Table 3).
For patients included in the primary efficacy analysis.
HbA1c, glycosylated hemoglobin; SD, standard deviation; T1DM, type 1 diabetes.
MMRM with treatment group (SAR-Lis, Ly-Lis), randomization strata of screening HbA1c (<8.0, ≥8.0%), prior use of Humalog (Yes, No), geographical region (Japan, Non-Japan), visit (week 12, week 26, week 40, and week 52), and treatment-by-visit interaction as fixed categorical effects and baseline value and baseline value-by-visit interaction as continuous fixed covariates.
CI, confidence interval; LS, least square; MMRM, mixed-effect model for repeated measures; SD, standard deviation; SEM, standard error of the mean.
Mean HbA1c at baseline was similar in both treatment groups for patients included in the efficacy analysis (SAR-Lis: 8.08%; Ly-Lis: 8.00%) (Table 3).
Changes in the daily mealtime and basal insulin dose were small in both treatment groups during the 12-month period (Fig. 2A): mean mealtime doses at week 52 were 0.377 U/kg/day in the SAR-Lis group and 0.357 U/kg/day in the Ly-Lis group, and mean basal insulin doses at week 52 were 0.377 U/kg/day in the SAR-Lis group and 0.343 U/kg/day in the Ly-Lis group (Table 3).
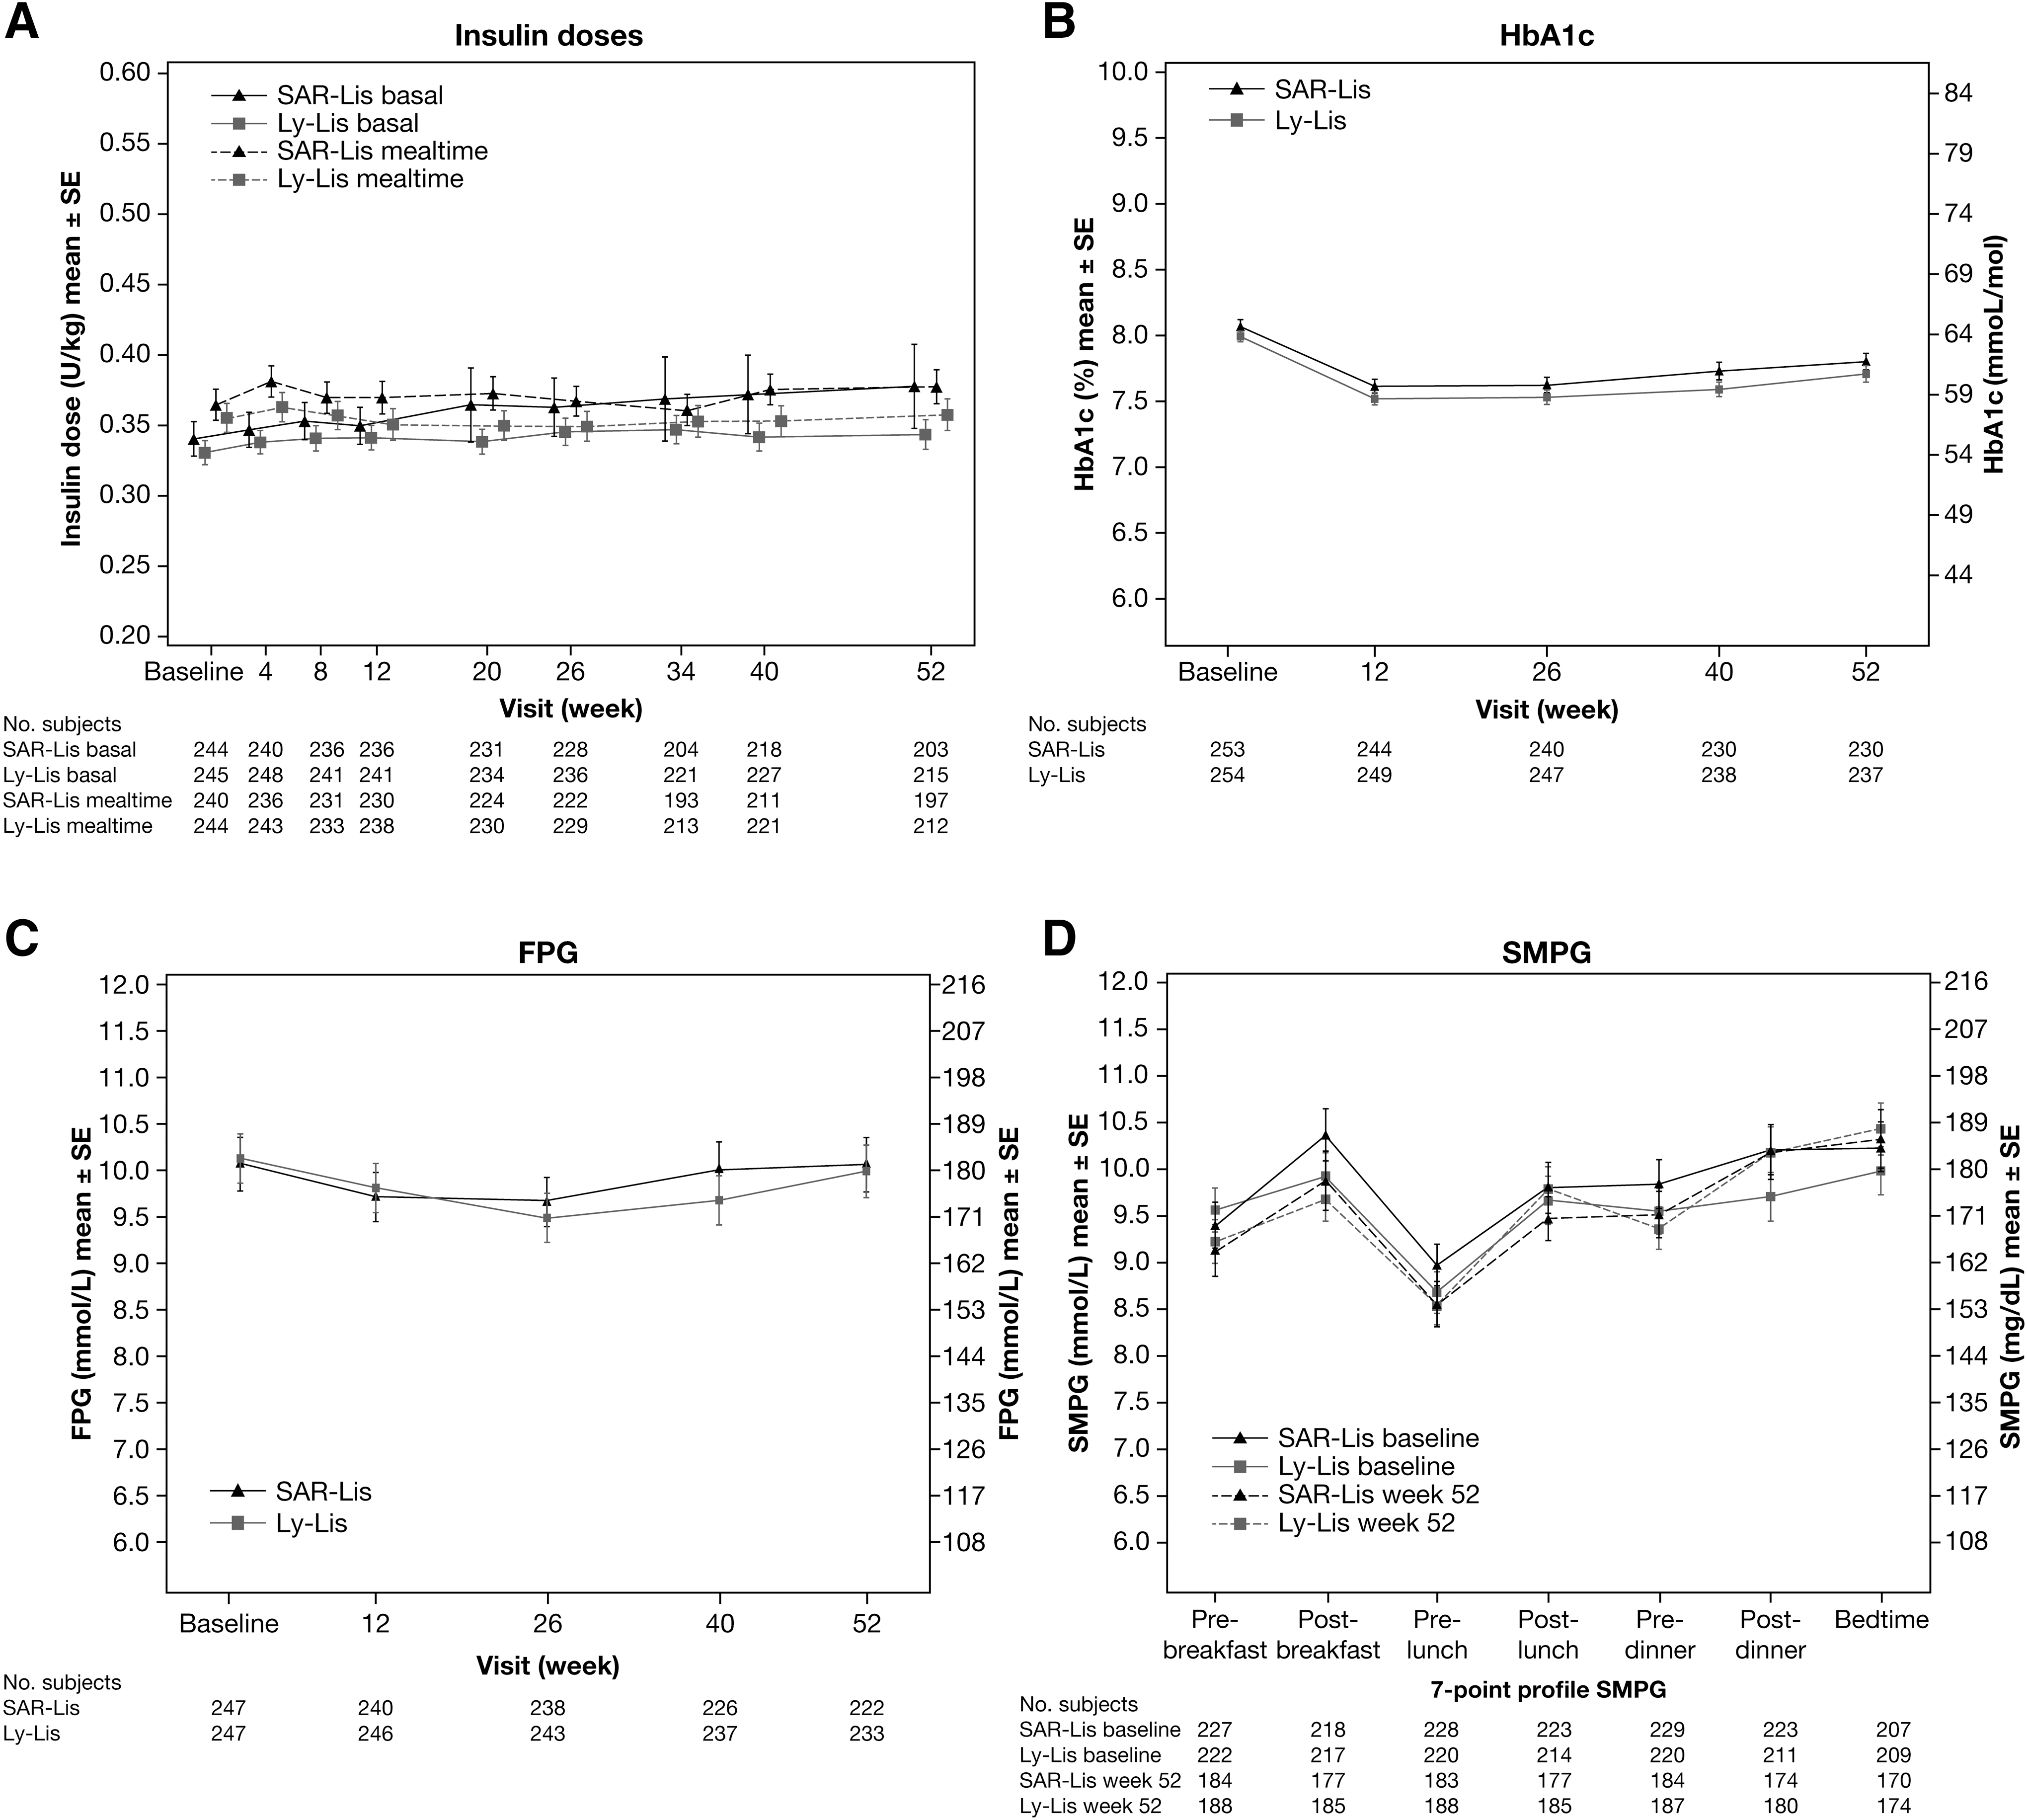
Average daily basal and mealtime insulin doses (U/kg)
Efficacy
For the primary endpoint, the mean HbA1c decreased similarly in the SAR-Lis and Ly-Lis treatment groups from baseline to week 26 (Fig. 2B).The LS mean change in HbA1c from baseline to week 26 using MMRM analysis was similar in both treatment groups (−0.42% [SE: 0.051] on SAR-Lis; −0.47% [SE: 0.050] on Ly-Lis). The LS mean difference between SAR-Lis and Ly-Lis was 0.06% (95% CI: −0.084 to 0.197). Noninferiority of SAR-Lis versus Ly-Lis was demonstrated since the upper bound of the 95% CI of the between-group difference was lower than the predefined noninferiority margin of 0.3%. The inverse noninferiority of Ly-Lis versus SAR-Lis was also demonstrated. In both treatment groups, the decrease in HbA1c occurred in the first 12 weeks of the study, HbA1c remaining stable thereafter up to week 26.
During the 6-month extension period, efficacy was maintained, although a small increase in HbA1c occurred similarly in the SAR-Lis and Ly-Lis groups between week 26 and week 52. The LS mean change in HbA1c from baseline to week 52 using MMRM analysis was similar in both treatment groups (−0.22 [SE: 0.057] on SAR-Lis; −0.30 [SE: 0.056] on Ly-Lis). The LS mean difference between SAR-Lis and Ly-Lis was 0.07% (95% CI: −0.084 to 0.232) (Table 3).
FPG (central laboratory) had decreased in both treatment groups similarly throughout the study (Fig. 2C). At week 52, the LS mean change (SE) for SAR-Lis was −0.07 mmol/L (0.278) and −0.12 mmol/L (0.273) for Ly-Lis; LS mean difference of SAR-Lis versus Ly-Lis was 0.05 (95% CI: −0.712 to 0.819) (Table 3).
The seven-point SMPG profiles of SAR-Lis and Ly-Lis patients had improved at week 52 compared with baseline at all time points except for the Ly-Lis group at postdinner and for both groups at bedtime (Fig. 2D). The LS mean difference (95% CI) between SAR-Lis and Ly-Lis for postprandial glucose excursions after breakfast, lunch, and dinner was 0.41 (−0.469 to 1.293) mmol/L, −0.19 [−1.134 to 0.757] mmol/L, and 0.12 (−0.827 to 1.070) mmol/L, respectively (Table 3). The mean change (SD) from baseline in bedtime plasma glucose for SAR-Lis was 0.09 (4.64) mmol/L and 0.08 (4.72) mmol/L for Ly-Lis (Table 3).
In the SORELLA 1 study, the subgroup analyses based on baseline data in obese patients with BMI ≥30 kg/m2 versus <30 kg/m2, by diabetes duration (≥10 years vs. <10 years), in the elderly (≥65 years vs. <75 years), and by ethnicity were consistent with the total patient population. 13
Safety
In both treatment groups, almost all patients had at least one episode of hypoglycemia (regardless of the category) (Table 4), and similar percentages of patients reported nocturnal hypoglycemia (00:00–05:59 h) in the SAR-Lis group and the Ly-Lis group (regardless of the category) (Table 5). Severe hypoglycemia was reported by a similar number of patients with SAR-Lis (34/252 [13.5%]) and Ly-Lis (34/254 [13.4%]). No difference was seen between the treatment groups for the number of patients with severe nocturnal hypoglycemia (SAR-Lis, 9/252 [3.6%]; Ly-Lis 10/254 [3.9%]). All other predefined categories (in percentages) of hypoglycemia were similar in SAR-Lis and Ly-Lis-treated patients (Tables 4 and 5).
Sensitivity analysis excluding the patient who reported 122 events requiring assistance.
No significant difference between treatment groups.
No significant difference between treatment groups.
The number of hypoglycemic events per patient-year of exposure during the 52-week treatment period was similar for both treatment groups for all types of hypoglycemia, with the exception of an increased severe hypoglycemic event rate of 0.73 in the SAR-Lis group compared with 0.28 in the Ly-Lis group (Table 4). The difference in overall event rates was due to a single patient, who had reported 122 events requiring assistance during the 12-month on-treatment period, 119/122 events during the 6-month main study period. Several factors may have contributed to this patient's frequent low blood glucose, including gastroparesis (admitted to by the patient while on-study), frequently missed meals, self-adjustment of both basal and prandial insulin doses (sometimes without prior site knowledge), bipolar disorder (diagnosed while on-study), and achievement of tight glucose control (HbA1c was 7.4% at week 26 and 6.8% at week 40). Post hoc sensitivity analyses excluding this patient did not show differences between groups in the number of severe hypoglycemic events per patient-year of exposure (0.22 for SAR-Lis; 0.28 for Ly-Lis) (Table 4). The event rate for severe nocturnal hypoglycemia was low and similar in the SAR-Lis group (0.09) and the Ly-Lis group (0.07) (Table 5). Figure 3 shows the hourly event rate of patients reporting severe and/or confirmed hypoglycemia (SMPG ≤70 mg/dL) over the course of the day. Most hypoglycemic events were observed between 7 am and midnight with small peaks around each meal. There were no relevant differences in event rates between the two groups. Symptoms indicating severe neuroglycopenia, such as unconsciousness, coma, or seizure, were reported by five patients in the SAR-Lis group and by seven patients in the Ly-Lis group. All patients with severe hypoglycemia had prompt recovery further to corrective treatment. Hypoglycemia was reported as an SAE by 3 (1.2%) patients in the SAR-Lis group and by 4 (1.6%) patients of the Ly-Lis group.
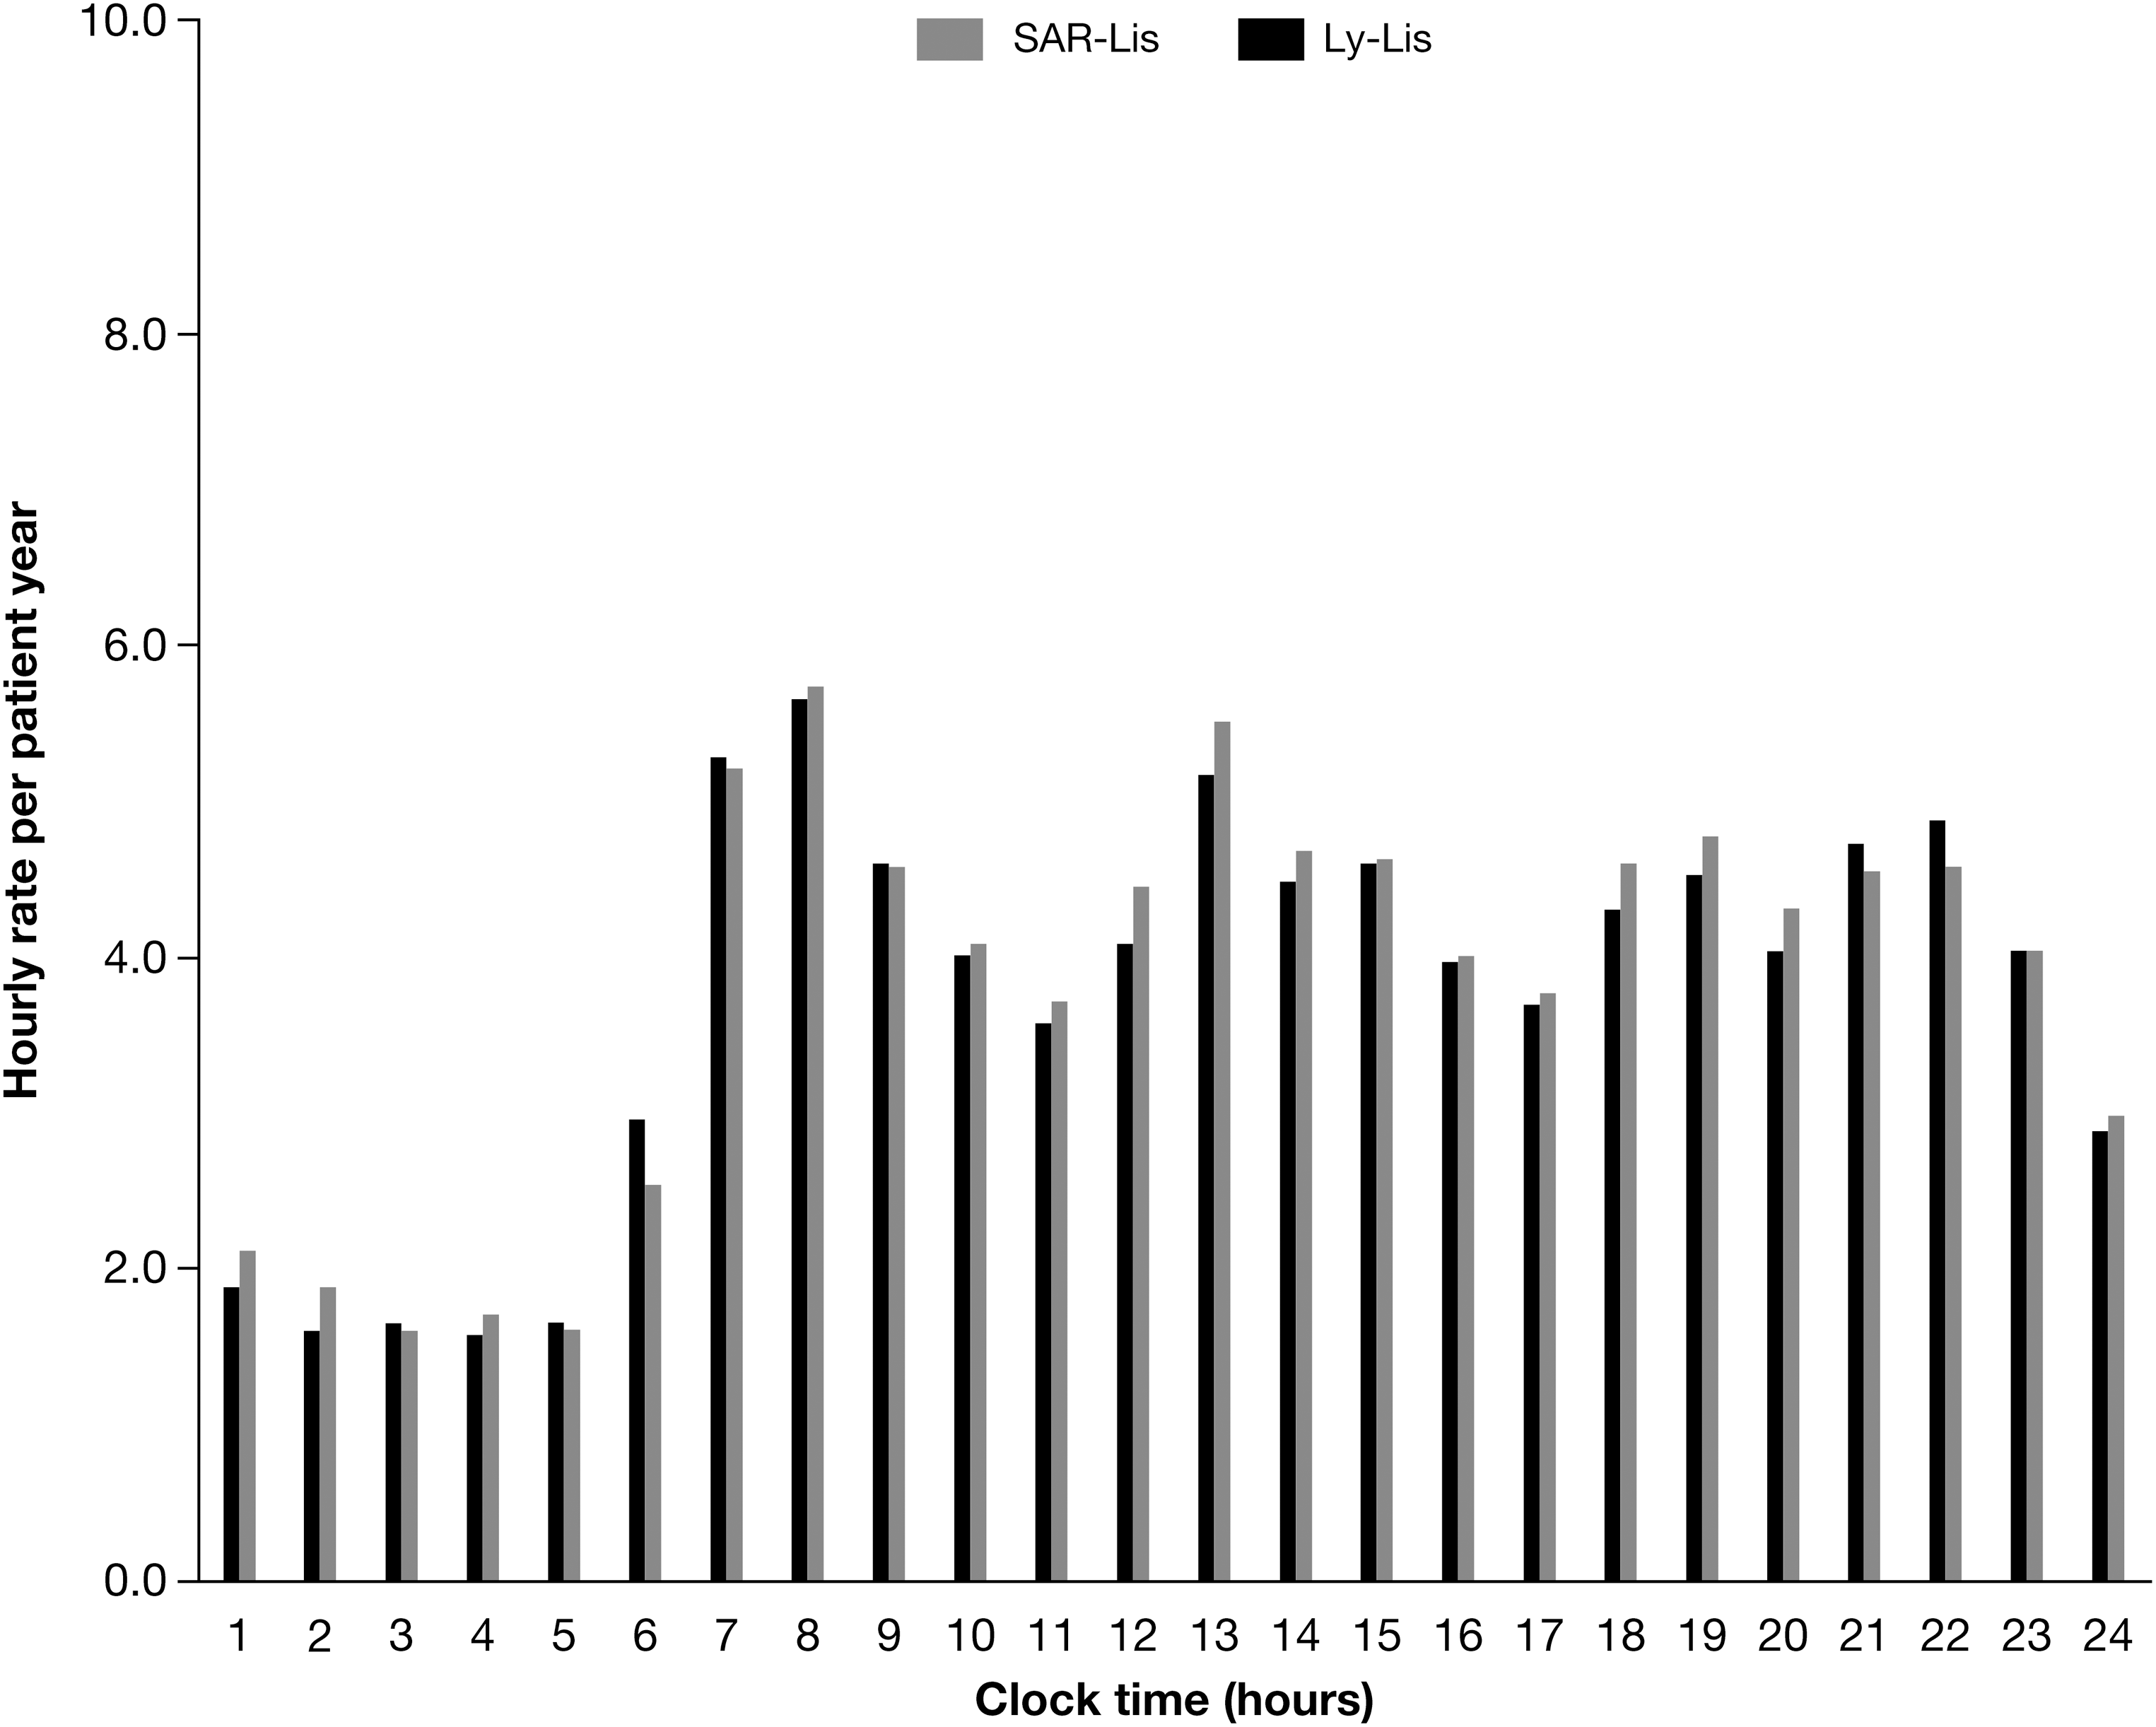
Hourly rate of severe and/or confirmed hypoglycemia ≤3.9 mmol/L (70 mg/dL) per patient-year during the 52-week on-treatment period in the safety population.
A similar percentage of patients in the SAR-Lis and Ly-Lis groups reported any TEAEs (SAR-Lis: 137/252 [54.4%]; Ly-Lis: 141/254 [55.5%]), the most common of which was nasopharyngitis (SAR-Lis: 33/252 [13.1%]; Ly-Lis: 28/254 [11.0%]). A low number of patients reported serious TEAEs (SAR-Lis: 20/252 [7.9%]; Ly-Lis: 19/254 [7.5%]), the most common of which was hypoglycemic unconsciousness (6 [2.4%] in both treatment groups). Two patients in each treatment group (0.8%) reported TEAEs leading to permanent IMP discontinuation. There was one death in the SAR-Lis treatment group during the 52-week treatment period due to a cardiovascular event not associated with hypoglycemia and not related to the study drug (Table 6).
IMP, investigational medicinal product; SAE, serious adverse event; TEAE, treatment-emergent adverse event.
Body weight increase from baseline to week 52 was small and similar in the SAR-Lis group (mean change 1.35 kg) and in the Ly-Lis group (mean change 1.42 kg) (Table 7). No clinically meaningful changes from baseline were observed in clinical laboratory and hematology parameters and no differences between the two treatment groups occurred.
Immunogenicity
Similar percentages of patients in both treatment groups were positive for AIAs at baseline (SAR-Lis: 47.6%; Ly-Lis: 49.2%) (Table 8). The percentages of patients with a treatment-emergent AIA response (i.e., treatment-boosted or treatment-induced AIAs; incidence) were similar in both groups (SAR-Lis: 56/248 [22.6%]; Ly-Lis: 61/252 [24.2%]). Over the 12-month period, percentages of patients positive for AIAs remained relatively stable similarly in both treatment groups: at week 52, 44.8% of SAR-Lis patients and 47.2% of Ly-Lis patients were AIA positive. Similar percentages of patients in the SAR-Lis group (155/248; 62.5%) and in the Ly-Lis group (159/252; 63.1%) were positive for AIAs at least at one time point between baseline and week 52 (prevalence). Cross-reactivity with human insulin, insulin glargine, and insulin glargine M1 metabolite was high and consistent between treatment groups.
Prevalence: patients with at least one positive AIA sample at baseline or postbaseline.
Incidence: patients with newly positive AIA postbaseline (treatment induced) or with ≥4-fold increase in titer (treatment boosted) (i.e., patients with treatment-emergent AIAs).
AIA, anti-insulin antibody.
No relationship was observed between the individual maximal AIA titers and the change in total insulin dose, HbA1c, hypoglycemia, injection site, and hypersensitivity reactions.
A low number of patients in both treatment groups reported hypersensitivity reactions (SAR-Lis: 15/252 [6.0%]; Ly-Lis: 16/254 [6.3%]) and very few patients reported injection site reactions (SAR-Lis: 3/252 [1.2%]; Ly-Lis: 3/254 [1.2%]), both were similarly distributed between the two groups (Table 7). Most events were mild or moderate in intensity and resolved while treatment was ongoing. Of the 34 potential hypersensitivity reactions reported by 31 patients in either treatment group, only two events (urticaria; allergic rhinitis) in the Ly-Lis group were adjudicated as allergic reactions by the ARAC, none were considered as related to IMP.
Discussion
Biosimilar insulins, including rapid-acting insulins, may have the potential to reduce diabetes treatment costs, increase the accessibility of insulin treatment, and expand the number of insulin brands available for those with diabetes. To the best of our knowledge, we report the first study evaluating the long-term (1 year) use of a biosimilar rapid-acting insulin (insulin lispro) analog in patients with T1DM. Similar efficacy in terms of changes in HbA1c levels was noted between treatment groups at the primary endpoint at week 26 and throughout the 6-month extension period up to week 52. The FPG and seven-point SMPG profiles were similar between treatment groups except for some small differences at certain time points, which were not considered clinically relevant. All hypoglycemic events were similar in both treatment groups, across all ADA categories.
The original registration studies with Ly-Lis showed altered efficacy of Ly-Lis in obese patients and thus FDA mandated Eli Lilly to do postmarketing studies in obese patients after the product was approved by the FDA in August of 1996. 13 In the SORELLA 1 study, the subgroup analyses based on baseline data in obese patients with BMI ≥30 kg/m2 versus <30 kg/m2, by diabetes duration (≥10 years vs. <10 years), in the elderly (<65 vs. ≥65 to <75 years), and by ethnicity were consistent with the total patient population. 14 In particular, the incidence of hypoglycemia was comparable between treatments for the subgroups, including the incidence of severe hypoglycemia.
One-year data on follow-on biologics are needed to evaluate the safety, including immunogenicity, of the new product. Thus, the 26-week extension period was necessary for collection of safety data, including immunogenicity data up to 52 weeks. The results did not show any clinically relevant differences between the treatment groups in safety measures such as incidence or rate of hypoglycemia for any category of hypoglycemia and TEAEs or SAEs. Similar percentages of patients reported hypersensitivity events, and incidence and prevalence of AIAs were similar in the SAR-Lis and Ly-Lis groups. There were no cases of allergic reactions associated with increased AIA titers.
Limitations to the study include the study population and the open-label design. The study population was largely adult white Caucasian. SAR-Lis was similarly effective and well tolerated with a similar safety profile as Ly-Lis in patients with T1DM from ethnic subgroups such as black, Asian/Oriental, and Hispanic treated for 6 months. However, these subgroups had low numbers of patients and results should be interpreted with caution. The open-label study design was chosen as prefilled, disposable, pen injection devices for SAR-Lis and Ly-Lis could not be made indistinguishable. However, outcome assessments were determined based on objectively collected data determined by central laboratories blinded to the study treatment.
Conclusions
The efficacy and safety results of this randomized controlled study comparing SAR-Lis and the reference drug Ly-Lis in patients with T1DM also using GLA-100 support similar efficacy and safety of SAR-Lis and Ly-Lis.
Footnotes
Acknowledgments
This study was funded by Sanofi. Graphics support was provided by Tom Claus, PhD, of PPSI, funded by Sanofi. Registration in
Author Disclosure Statement
S.K.G., Advisory Board Consulting fees: Medtronic, Roche, Merck, Lexicon, Novo-Nordisk, Sanofi, and Eli Lilly. Research Grants: Eli Lilly, Novo Nordisk, Merck, Lexicon, Medtronic, Dario, NCI, T1D Exchange, NIDDK, JDRF, and Sanofi. No stocks or equity in any device or pharmaceutical company. K.W.-P., employee and stockholder of Sanofi. M.R., employee and stockholder of Sanofi. S.P., employee and stockholder of Sanofi. K.J., investigator in clinical trials sponsored by Sanofi, Eli Lilly, Novo Nordisk, Merck, Bayer, and Pfizer.