
Abstract
Background:
Different reference methods are used for the accuracy assessment of continuous glucose monitoring (CGM) systems. The effect of using venous, arterialized-venous, or capillary reference measurements on CGM accuracy is unclear.
Methods:
We evaluated 21 individuals with type 1 diabetes using a capillary calibrated CGM system. Venous or arterialized-venous reference glucose samples were taken every 15 min at two separate visits and assessed per YSI 2300 STAT Plus. Arterialization was achieved by heated-hand technique. Capillary samples were collected hourly during the venous reference visit. The investigation sequence (venous or arterialized-venous) was randomized. Effectiveness of arterialization was measured by comparing free venous oxygen pressure (PO2) of both visit days. Primary endpoint was the median absolute relative difference (ARD).
Results:
Median ARD using arterialized-venous reference samples was not different from venous samples (point estimated difference 0.52%, P = 0.181). When comparing the three reference methods, median ARD was also not different over the full glycemic range (venous 9.0% [n = 681], arterialized-venous 8.3% [n = 684], and capillary 8.1% [n = 205], P = 0.216), nor over the separate glucose ranges. Arterialization was successful (PO2 venous 5.4 kPa vs. arterialized-venous 8.9 kPa, P < 0.001). Arterialized-venous glucose was significantly higher than venous glucose and numerically higher than capillary glucose (arterialized-venous 142 mg/dL vs. venous 129 mg/dL [P < 0.001] and vs. capillary 134 mg/dL [P = 0.231]). Inconvenience related to arterialization included transient mild edema and redness of the hand in 4 out of 21 (19%) patients.
Conclusions:
The use of venous, arterialized-venous, or capillary reference measurements did not significantly impact CGM accuracy. Venous reference seems preferable due to its ease of operation.
Introduction
C
While venous glucose samples are most frequently used due to their ease of operation, capillary samples might be preferred from a physiological point of view since capillary glucose is also used for calibration of the CGM system in real life. Venous glucose concentration is lower than capillary glucose concentration, 12,17 –19 so using venous reference measurements could negatively impact reported CGM accuracy. 12 Capillary reference measurements are limited by the burden of frequent finger sticks needed to obtain those samples.
Although more demanding than venous reference measurements, arterialized-venous samples, obtained by heated-hand technique, are used to combine the ease of operation of venous sampling techniques with a glucose concentration more comparable to capillary samples. 20,21 Arterialization brings logistic challenges and imposes patient burden, while the effect of arterialized-venous samples as an alternative reference measurement on CGM accuracy assessment is unclear. This limits the comparability between accuracy reports and the ability of care providers to adequately advice their patients on use of this diabetes technology.
Thereby, the aim of this study is to assess the impact of using different glucose reference measurements (venous, arterialized-venous, or capillary) on the accuracy of a capillary calibrated CGM system, to provide evidence for a standardized method for the assessment of CGM systems.
Materials and Methods
This was an open-label randomized crossover study in patients with type 1 diabetes performed from July 8, 2016 to January 4, 2017. Participants were recruited from the Academic Medical Center (AMC, Amsterdam, the Netherlands). Eligible participants were adults aged 18 years or over with a diagnosis of type 1 diabetes, a body mass index below 35 kg/m2, and a hemoglobin A1c (HbA1c) below 10% (86 mmol/mol). Participants with pregnancy, a known adrenal gland disorder, panhypopituitarism, gastroparesis, migraine, epilepsy, ischemic heart disease, or a cardiovascular event in the year previous to study entry were not eligible. Participants were also not eligible if they used steroids or if they had difficult intravenous (IV) access as assessed by the investigators. Acetaminophen could not be used during the trial due to the known effect on enzymatic glucose assessment. 22 At screening a blood sample was taken for creatinine, potassium, alanine transaminase, hemoglobin, and HbA1c. The CGM system accuracy was tested during two in-clinic visits either using venous or arterialized-venous reference measurements. Additional capillary samples were taken during the venous visit.
The study was performed in accordance with the Declaration of Helsinki
23
and was approved by the institutional review board. Written and verbal informed consent was received before any study procedures were performed. The study was registered at
General procedures
Study personnel trained the participants to use the Dexcom G5 mobile CGM system (DG5M; Dexcom, San Diego, CA) and CONTOUR XT Blood Glucose Meter (BGM; Bayer AG, Leverkusen, Germany). The CGM sensor was placed by the participant under the guidance of the study personnel during the first in-clinic visit. Participants were asked to calibrate their CGM twice daily according to manufacturer's instructions, using capillary samples and the provided BGM. The alarm thresholds for hypoglycemia and hyperglycemia were set according to the participants' preferences. Participants were admitted to the research ward twice for a duration of 8 h between 2 and 6 days after CGM sensor implantation. To limit the impact of change in CGM accuracy over sensor lifetime on study outcomes, no more than 1 day between visits was allowed. The investigation sequence (venous or arterialized-venous reference sampling visit) was randomized using an online computer-generated allocation sequence with a 1:1 ratio (Castor EDC, Amsterdam, the Netherlands). Participants and study staff were aware of the allocation sequence due to the nature of the intervention.
Sampling visits
At 07:45 h the participants arrived after an overnight fast. An IV system was placed antegradely on the dorsal vein of hand. We chose anterograde cannulation since it is not known whether retrograde cannula placement truly differs from anterograde, and anterograde placement is more convenient and requires no additional training. 24,25 During the arterialization visit, the participant was asked to place the hand and half of the forearm in the heated-hand box, a thermoregulated box with a dry air temperature of 56°C. Ambient room temperature was maintained between 20°C and 22°C. The IV cannula was kept patent with continuous low flow of 0.9% sodium chloride. Glucose sampling started 30 min after placement of the hand in the heated-hand box. Venous or arterialized-venous glucose samples were taken every 15 min at the respective visit. We placed a two-way tap connector on the venous cannula with a 5 mL Luer Lock syringe on the distal tap and a 2 mL Luer Lock syringe on the proximal tap. We interrupted the continuous sodium chloride infusion to withdraw 5 mL diluted blood with the distal syringe and then used the proximal syringe to withdraw 1.5 mL undiluted blood for sampling purpose. The timing of the latter action was documented as “sampling time.” We reinjected the 5 mL diluted blood from the distal syringe to minimize blood loss. We injected the blood samples in the reaction vial, which contains anticoagulant, and centrifuged them. Samples were visually checked for dilution and hemolysis, and plasma glucose concentration was assessed with the YSI 2300 STAT Plus analyzer (YSI, Yellow Springs, OH). Capillary samples were taken during the venous reference visit on an hourly basis from any finger as preferred by the patient, simultaneously with venous samples, and were measured with the CONTOUR XT Series BGM. An additional capillary sample was taken 15 min after induction of hypoglycemia (glucose per YSI <70 mg/dL [3.9 mmol/L]). During both visits free (arterialized-)venous oxygen pressure (PO2) was measured 120 min after the start of glucose sampling to compare oxygen content and, thereby, assess arterialization effectiveness. At 8:30 h participants received a breakfast of their preference. Meals were kept identical between visits. Mealtime insulin bolus was delayed 30 min and increased with 80% to induce a period of hyperglycemia (>180 mg/dL [10 mmol/L]) followed by a period of hypoglycemia (45–70 mg/dL [2.5–3.9 mmol/L]) to assure sufficient samples over all glycemic ranges for assessment of CGM accuracy. 5,6,9 The insulin bolus was calculated with the participant's carbohydrate-to-insulin ratio following a predefined protocol. A correction insulin bolus was administered to participants who arrived with a fasting glucose >126 mg/dL (7.0 mmol/L). Participants received rescue carbohydrates if glucose was <45 mg/dL (2.5 mmol/L) at any moment during the study or earlier at the physicians' discretion. A medical doctor or supervised and trained research personnel was present during hypoglycemia induction to assure participant safety. Participants received lunch with their usual insulin bolus at 13:00 h. Participants left the clinical research center at 16:30 h while continuing to wear the CGM sensor until the end of the investigations. The CGM system was replaced in case sensor end-of-life, indicated by CGM display, was reached before the last study visit; visits were rescheduled if needed.
Outcomes
The primary endpoint was the difference in median absolute relative difference (ARD) between the CGM readings and reference measurements assessed with venous and arterialized-venous reference samples (both measured with the YSI glucose analyzer). Secondary analyses included the difference in median ARD as described above, but now for all three reference measurements (venous, arterialized-venous, and capillary). Outcomes were assessed over three different glucose ranges as follows: hypoglycemia <70 mg/dL (3.9 mmol/L), euglycemia 70–180 mg/dL (4.0–10.0 mmol/L), and hyperglycemia >180 mg/dL (10.0 mmol/L). Ranges were based on the respective reference method. Correlation coefficients between CGM readings and venous, arterialized-venous, and capillary reference samples were calculated. Assessment of clinical impact of differences in CGM accuracy was performed according to the ISO 15197:2013 criteria (percentage of paired data values within 15% of the reference values at glucose concentrations ≥100 mg/dL [5.6 mmol/L] or within ±15 mg/dL [0.83 mmol/L] for glucose concentrations ≤100 mg/dL [5.6 mmol/L] 26 ). Bland–Altman analysis with bias (mean difference between the CGM reading and reference glucose concentration) and limits of agreement (bias ±1.96 × standard deviation of the bias) was calculated. Other outcomes were mean difference in glucose concentration among venous, arterialized-venous, and capillary samples and difference in PO2 between venous and arterialized-venous visits. Successful arterialization was defined as a 2 kilopascal (kPa, 15 mmHg) higher PO2 at the arterialization visit. 20 A per protocol analysis excluding subjects with ineffective arterialization was planned. In addition, we assessed the effect of glucose rate of change (ROC) and success of arterialization on outcomes. Adverse events were registered.
Statistical analysis
Data analysis was based on the intention-to-treat principle. Data from all participants with at least one CGM reference pair for each reference method were included. Reference values were paired with CGM data by 1 minute linear interpolation between reported CGM values. 6,9 To reduce interdependency of data points, only CGM reference pairs at least 15 min apart from the next CGM reference pair were used for analysis. 27 BGM values used for (re-) calibration were not included in the accuracy analysis.
To detect a 1% difference in CGM accuracy (in terms of mean or median ARD) with 80% power, assuming a standard deviation of 6%, 654 independent samples were required. Consequently, 21 participants with 32 samples per visit day would provide sufficient data. To account for possible dropout, we needed 22 patients. Depending on the distribution, descriptive variables are presented as mean with standard deviation, median with interquartile range, or frequencies with percentages. Confidence intervals of the difference between outcomes were calculated; Hodges–Lehmann's procedure was used in case of non-Gaussian data. 28 Mann–Whitney U test was performed for two-sample non-Gaussian data; Kruskal–Wallis test for non-Gaussian data with more than two groups. Chi-square tests were used for the comparison of categorical variables. Impact of allocation sequence was investigated using a generalized estimating equation model. 29 All comparisons were conducted at a 0.05 level of significance using two-tailed tests. Statistical analysis was performed using IBM SPSS statistics version 23.0.0.3 (IBM Corp., Armonk, NY). Data were collected using Castor EDC.
Results
One participant withdrew informed consent after randomization due to scheduling issues, leaving 21 patients to successfully complete the study (Fig. 1). Baseline characteristics of the intention-to-treat cohort are shown in Table 1. Patients were on average 44 years old, with diabetes duration of 25 years and a HbA1c of 62 mmol/mol (7.8%). All but one patient used continuous insulin infusion. One out of 21 sensors was replaced due to failure before the first sampling visit.

Flow diagram of study participants.
For categorical variables data are number (%). For continuous variables data are mean ± standard deviation or median [interquartile range], depending on data distribution.
CSII, continuous subcutaneous insulin infusion; HbA1c, hemoglobin A1c; ITT, intention-to-treat; IU, international units; MDI, multiple daily injections.
The overall point estimated difference between median venous ARD and median arterialized-venous ARD was 0.52% (95% CI −0.24 to 1.29, P = 0.181, Table 2). Median ARD was not different between the three reference measurements over the full glycemic range: venous 9.0% [4.6–16.0], arterialized venous 8.3% [3.4–15.7], capillary 8.1% [3.6–13.8], (P = 0.216), nor over the various glucose ranges (Table 2). Correlation between CGM and references was high for all references with a Pearson correlation coefficient of 0.96 for the venous reference and 0.97 for both the arterialized-venous and capillary references. The ISO 2013 criteria were met in 77.8% for the venous reference, 77.9% for the arterialized-venous reference, and 82.9% for the capillary reference (P = 1.00). Results of Bland–Altman analysis were comparable between reference measurements (Fig. 2). No evidence was found for effect of allocation sequence on study outcomes.
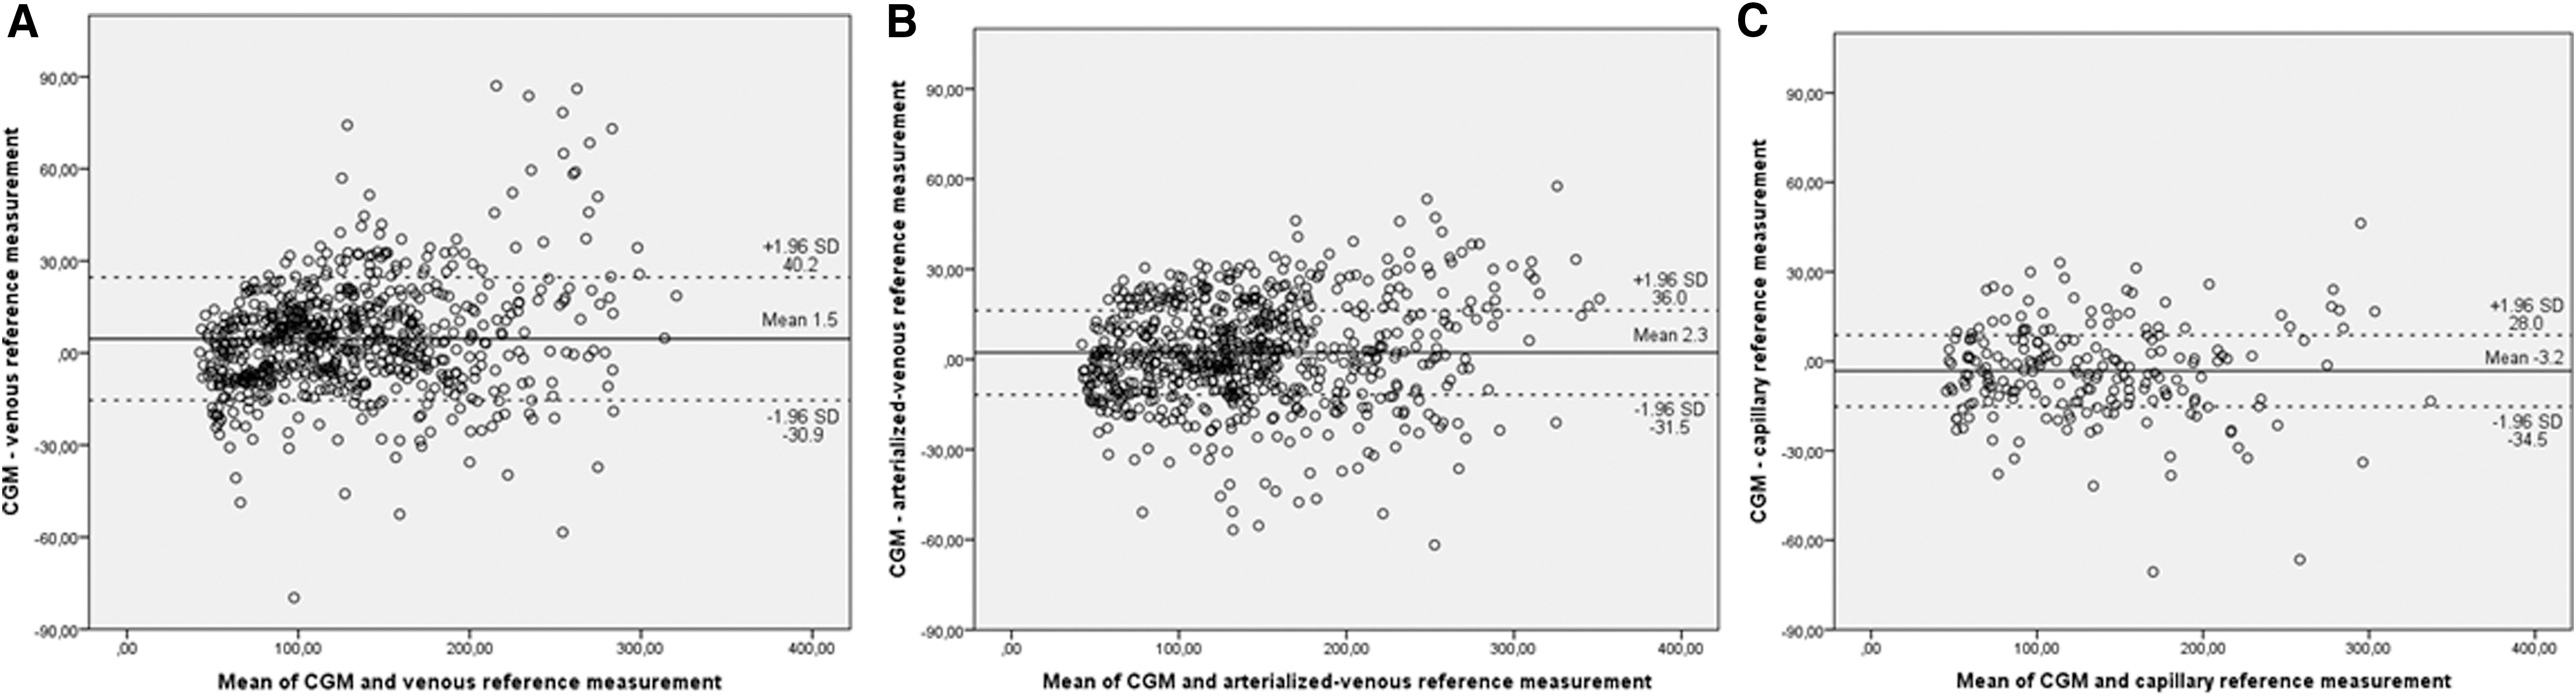
Bland–Altman analyses with mean and limits of agreement for venous
Data are mean ± standard deviation or median [interquartile range].
Point estimates and confidence intervals were obtained using Hodges–Lehmann's procedure. P-value for the difference between venous and arterialized-venous reference measurements by Mann–Whitney U test.
P-value for overall difference between venous, arterialized-venous, and capillary reference measurements by Kruskal–Wallis test.
AD, absolute difference; ARD, absolute relative difference; MARD, mean absolute relative difference.
Glucose concentration was different among reference measurements, as shown in Table 3. Arterialized-venous glucose concentration was significantly higher than venous glucose concentration (142 mg/dL vs. 129 mg/dL, P < 0.001) and numerically higher than capillary glucose concentration (142 mg/dL vs. 134 mg/dL, P = 0.231). This difference was also apparent in the euglycemic and hyperglycemic range, but disappeared in the hypoglycemic range. Glucose ROC varied per patient and per visit day (Table 4). However, mean ROC was similar, with 0.82 mg/(dL·min) on the venous sampling day and 0.89 mg/(dL·min) on the arterialized-venous sampling day [mean difference −0.07 mg/(dL·min); 95% CI −0.26 to 0.12, P = 0.434]. Table 5 shows the difference in median ARD between venous and arterialized-venous reference samples for five distinct ROC categories. Arterialization seemed to result in lower median ARD when glucose was stable or slightly increasing [ROC between −1 and 2 mg/(dL·min)]. However, the opposite effect was seen when glucose declined with more than 1 mg/(dL·min).
Data are mean ± standard deviation or median [interquartile range].
P-value for overall and separate difference between venous, arterialized-venous, and capillary reference measurements by Kruskal–Wallis test.
ROC, rate of change.
Data are displayed as median [interquartile range].
Point estimated difference with Hodges–Lehmann's procedure.
P-value of the difference by Mann–Whitney U test.
CI, confidence interval.
All patients showed higher PO2 when arterialization was performed with an overall 3.4 kPa higher PO2 (P < 0.001) at the arterialized-venous sample visit. In 5 out of 21 patients, the difference between venous and arterialized venous was <2 kPa, what we considered unsuccessful arterialization (Table 6). The per protocol analysis including only those participants with successful arterialization (n = 16) did not change study outcomes (Table 7). Adverse events related to the arterialization procedure included mild edema and redness of the hand in 4 out of 21 (19%) participants. No pain was reported. All adverse events resolved without medical intervention within hours after the visit.
Data are displayed as median [interquartile range].
Point estimated difference with Hodges–Lehmann procedure.
P-value of the difference by Mann–Whitney U test.
PO2, free venous oxygen pressure.
Data are displayed as median [interquartile range]. Successful arterialization was defined as a difference in free oxygen pressure >2 kPa.
Mean estimated difference with Hodges–Lehmann's procedure.
P-value of the difference by Mann–Whitney U test or independent sample t-test.
Discussion
Interstitial glucose can't be measured directly. While venous plasma glucose is most frequently used as a reference to assess CGM accuracy, capillary and arterialized-venous sampling techniques are accepted alternatives, both with some appealing features. We hypothesized that using different reference measurements would result in differences in accuracy metrics, but could not confirm this. Median ARD was not different between reference methods, neither over the full glycemic range nor over the various glucose ranges. Numerical differences in median ARD were nonsignificant and small, with the difference between venous and arterialized-venous reference amounting to 0.5%.
Capillary samples are normally used for calibration of the CGM, but finger sticks are painful and it is generally known that self-monitoring blood glucose measurements are less precise than YSI measurements. This makes capillary samples unfit as reference glucose. We confirmed the well-known gradient in glucose concentration going down from arterialized-venous to capillary and venous samples. The glucose concentration of venous samples was closest to capillary samples, favoring venous over arterialized-venous reference samples. Arterialization technique was effective as indicated by a higher mean PO2 and higher mean glucose concentration during arterialization compared to the venous sampling visit. While overall arterialization was successful, in 5 out of 21 patients the difference in PO2 was less than 2 kPa. Nevertheless, a per protocol analysis, including only participants with successful arterialization, did not change study outcomes; even more, median ARD between venous and arterialized-venous reference was identical when arterialization was successful. Furthermore, no clear definition of successful arterialization can be found in the literature, and the effectiveness of the procedure is most often not reported. Even though arterialization is cumbersome, once established blood sampling is usually easier. Five of the eight venous samples, in which venous glucose was >60 mg/dL higher than the CGM reading, were consecutive measurements from a patient in which we experienced difficulties with the blood drawings.
In a previous post hoc analysis we showed that using capillary reference measurements in a capillary calibrated CGM resulted in a significantly lower mean absolute relative difference compared to using venous reference measurements. 12 We could not confirm these findings in our present study specifically designed to investigate this issue. In the previous post hoc analysis both whole blood venous and capillary reference and capillary calibration glucose samples were measured using the HemoCue glucose analyzer (Ängelholm, Sweden), while we used the YSI for venous and BGM for capillary samples, since this is the standard and reflecting real life, respectively. In the current study, we collected almost 15 times as much paired samples and we measured plasma instead of whole blood glucose concentration. And, contrary to the previous study, we intentionally induced glucose change which is recommended when evaluating CGM, while we found no difference in rate of glucose change between venous and arterialized-venous sampling days. All these differences might contribute to the explanation for the difference between the two study outcomes.
With this study, we aimed to answer the practical question: “does use of different assessment methods impact measured CGM accuracy?” Therefore we chose commonly used assessment methods, including the YSI glucose analyzer for assessment of venous and arterialized-venous glucose concentrations and an accurate and widely available BGM (CONTOUR XT) for the assessment of capillary glucose. Due to known systemic (contralateral) effects of arterialization, 30 we had to sample venous and arterialized-venous glucose during separate visits, thereby creating different circumstances and glucose excursions for the different reference methods. We randomized the intervention sequence to prevent the occurrence of any order effect. By taking no more than 1 day between visits we have tried to limit the impact of change in accuracy over sensor lifetime between visits. At last, meals were kept equal among visit days, and insulin dosing was done following a predefined protocol, leading to an overall equal ROC among visit days. Arterialization had a positive effect on median ARD when ROC was between −1 and 2 mg/(dL·min), but a negative effect when ROC was less than −1 mg/(dL·min), indicating either random error or an effect depending upon increasing or decreasing glucose values. Moreover, a possible difference in ARD depending on ROC might be of little clinical value, since ROC cannot be predicted on forehand. We explored the influence of investigation sequence as a confounder but found no impact on study outcomes. We used a modern and accurate CGM system to reduce overall data noise when assessing the study outcome, but it cannot be ruled out that different outcomes could be found with other CGM systems.
In conclusion, in this study we investigated the impact of using different reference methods for the assessment of CGM accuracy. We found no evidence to suggest that any material difference exists. Due to more complex logistics and increased patient burden with arterialization and limitations to the number of capillary samples that can be taken, venous reference seems the preferable method.
Footnotes
Acknowledgments
The authors thank participants for their continued dedication during the study. The authors wish to acknowledge and thank the study personnel for their help in the successful execution of the study. This study was funded by Dexcom, San Diego, USA under an unrestricted research grant.
Disclaimer
The authors developed the study protocol with full academic freedom. Dexcom personnel did not participate in the study or data analysis nor had access to the data. The corresponding author had full access to all the data in the study and takes the final responsibility for the decision to submit for publication.
Author Disclosure Statement
J.K. received research support from Senseonics and Dexcom; J.H.D. received research support and is a consultant/advisor/speaker for Senseonics, Dexcom, Johnson & Johnson (Animas, LifeScan), and Roche Diagnostics. No other potential conflicts of interest relevant to this article are reported.