
Abstract
Background:
To determine the factors associated with hypoglycemia in patients with type 2 diabetes mellitus (T2DM) on insulin therapy.
Methods:
This retrospective study included 62 inpatients with T2DM on insulin therapy who underwent 5-day continuous glucose monitoring (CGM). We analyzed the relation between hypoglycemia (defined as blood glucose below 70 mg/dL, as determined by the CGM) and time spent in hypoglycemia with fasting blood glucose, mean blood glucose (MBG), standard deviation (SD), coefficient of variation, minimum blood glucose level, maximum blood glucose level, and the percent time spent with blood glucose levels of >180 mg/dL.
Results:
Twelve patients (19.4%) developed hypoglycemia, and most were maintained on mix insulin therapy alone. In the hypoglycemic group, MBG was lower and SD was higher, than in the non-hypoglycemic group, although HbA1c was not different. Multivariate logistic regression analysis identified MBG and SD as factors related to hypoglycemia. Receiver operating characteristic curve analysis showed that the optimal MBG and SD cutoff values for prediction of hypoglycemia were 150.9 and 41.1 mg/dL, respectively. When subjects were divided into four groups according to these values, time at blood glucose <70 mg/dL was longest, and total insulin dosage highest, in the MBG-low/SD-high group.
Conclusions:
MBG and SD of glucose levels were identified as significant and independent determinants of hypoglycemia in T2DM on insulin therapy. It is important to use the least insulin dose, with the target of minimizing glycemic variability, to achieve good glycemic control without hypoglycemia.
Background
I
Although HbA1c represents the mean blood glucose (MBG) over the past 1–2 months and is used as an index of chronic hyperglycemia, it does not accurately portray the frequency of hypoglycemia and diurnal variations in blood glucose. In Japan, patients who use insulin self-injection are allowed to self-monitor their blood glucose under the national health insurance coverage. However, it is difficult to accurately assess the overall changes in blood glucose over the 24-h period by self-monitoring of blood glucose. The continuous glucose monitoring (CGM) system has become available in recent years, as a tool for evaluating glycemic variability. The CGM system has been reported to be useful for the assessment of hypoglycemic status, particularly from midnight to early morning. 4,5 Using the CGM system, Gehlaut et al. 6 found that hypoglycemia was more common in T2DM patients than previously thought; 75% of their 108 patients developed asymptomatic hypoglycemia, and reported that the use of CGM resulted in treatment modifications to avoid hypoglycemia. Thus, glycemic control that can prevent severe hypoglycemia through the use of the CGM system may contribute to not only prevention of microangiopathy but also reduction of overall mortality.
There are only a few studies that employed CGM for assessment of blood glucose status and hypoglycemia in T2DM patients on insulin therapy. The purpose of this CGM-based retrospective study was to identify the factors associated with hypoglycemia in patients with T2DM on insulin therapy.
Methods
Patients
The subjects were patients with T2DM maintained on insulin therapy who had been admitted to our hospital and the affiliated hospitals between April 2010 and March 2016 for the purpose of glycemic control and diabetes education and in whom CGM (CGMS System Gold, Medtronic, Inc., Fridley, MN; and iPro™2, Medtronic MiniMed, Inc., Northridge, CA) was performed within 5 days of admission without changing medications. Patients with other types of diabetes, that is, type 1, hepatic, pancreatic, and gestational diabetes, and those on medications (steroid preparations) that could potentially affect glycemic variability, were excluded from the study. Each subject was hospitalized for the inpatient diabetes education program, which is designed to promote diabetes education, lifestyle changes, and better treatment outcome. In this program, patients learn about the benefits of diet, exercise, and other preventative measures, and the acute and chronic complications of diabetes. The CGM system used in this study measured blood glucose in a blinded manner, rather than in real-time, and data analysis was performed after disconnection of the device.
Study protocol
A retrospective cross-sectional study design was used. The 0–24 h CGM data recorded on Day 2 of monitoring, rather than those of Day 1, were analyzed, since the CGM system often does not provide stable data of blood glucose levels on the day that it is attached to the patient. With regard to diet during CGM, all patients were on 25–30 kcal/kg per ideal weight diet of 60% carbohydrates, 15%–20% lipids, and 20%–25% protein, except for patients with nephropathy at stage 3 or higher, who were on 30–35 kcal/kg per ideal weight diet of 60%–70% carbohydrates, 15%–20% lipids, and 15%–20% protein. The dietary contents were fixed during the CGM, and the subjects consumed the entire meal. The amount of exercise was constant during the same period. Breakfast was served at 7:00, lunch at 12:00, and dinner at 18:00. Bedtime was defined as 22:00.
Measurements of biochemical variables
The CGM devices used in this study continuously measure the glucose level in the interstitial fluids within the range of 40–400 mg/dL. The glucose level in the interstitial fluid determined with the sensor placed in the subcutaneous tissue is converted to electric signals. The glucose level is determined every 5 min, 288 times at maximum per day. The glucose level in the interstitial fluid is reported to correlate closely with the glucose level in venous blood. 7 CGM data on fasting blood glucose (FBG; blood glucose level at 7:00 am before breakfast), MBG, standard deviation (SD), coefficient of variation (CV), minimum blood glucose level, maximum blood glucose level, percent time at blood glucose levels higher than 180 mg/dL (time at >180/total time), and percent time at blood glucose levels below 70 mg/dL (time at <70/total time) were evaluated. Hypoglycemia was defined as blood glucose levels below 70 mg/dL. HbA1c (%) values obtained on admission were converted to National Glycohemoglobin Standardization Program (NGSP) system values and used for evaluation. The Japan Diabetes Society (JDS) levels were converted according to the following equation: HbA1c (NGSP) (%) = HbA1c (JDS) × 1.02 + 0.25 (%). 8 The estimated HbA1c was calculated using the MBG data from the CGM system, with estimated average blood glucose = 28.7 × HbA1c (%)–46.7. 9 The estimated glomerular filtration rate was calculated as 194 × serum creatinine level (mg/dL) −1.094 × age −0.287 for men, and as 194 × serum creatinine level (mg/dL) −1.094 × age −0.287 × 0.739 for women. The insulin preparations were classified into three types, that is, basal insulin, bolus insulin, and mix insulin. All other treatments used by the patients and their doses were recorded. No changes were made in the medications used for the treatment of T2DM during the 5-day CGM recording.
The study protocol was approved by the Ethics Review Committee of our institution. Although the CGM recording represented part of the clinical management and one of the purposes for admission to the hospital, each patient provided a signed consent form.
Statistical analysis
Data were expressed as mean ± standard deviation. Normal distribution of the data was assessed by the Shapiro–Wilk test, and two-group comparisons were conducted using the Student t-test for data with normal distribution, and the Mann–Whitney U test for data with skewed distribution pattern. The Fisher's exact probability test was used for categorical data when the cell of the expected value was 5 or less, whereas the chi-square test was used for other parameters. Patients were divided into those with hypoglycemia and those without hypoglycemia, and analyzed by univariate and multivariate logistic regression analysis. For this model, the step-up procedure was used after removing factors with multicollinearity calculated by Spearman's correlation analysis from those extracted at P < 0.25 on univariate logistic regression analysis. In multivariate analysis, the proportion of hypoglycemia was used as a dependent variable, and the independent variables were MBG, SD, presence/absence of basal insulin, presence/absence of bolus insulin, presence/absence of mix insulin, and total insulin dose; these factors were analyzed employing a stepwise procedure. A P value of <0.05 was used to denote the presence of a statistically significant difference. All analyses were conducted using the Statistical Program for Social Sciences software version 21.0 (IBM-SPSS, Armonk, NY).
Results
Patient demographics
The background characteristics of the subjects are listed in Table 1. The subjects were 62 patients (29 men and 33 women). Only 12 (19.4%) patients developed hypoglycemia (hypoglycemia group), while 50 (81.6%) did not (nonhypoglycemia group). FBG was significantly lower in the hypoglycemia group (P = 0.007). There was no difference in HbA1c between the two groups (P = 1.000). The total insulin dose tended to be higher in the hypoglycemia group (P = 0.090). The proportion of patients on mix insulin alone was significantly higher in the hypoglycemia group (P = 0.003). There was no significant difference in the rate of use of any oral antihyperglycemic drug between the two groups. None of the patients received glucagon-like peptide-1 receptors agonists.
Data are mean ± SD or n (%).
P values are for differences between hypoglycemia and nonhypoglycemia groups.
The Mann–Whitney U test was used to determine the association between hypoglycemia and nonhypoglycemia.
χ 2 test was used to determine the association between hypoglycemia and nonhypoglycemia.
HbA1c, hemoglobin A1c; eGFR, estimated glomerular filtration rate; CPR-index, C-peptide immunoreactivity index; SU, sulfonylurea; TZD, thiazolidinedione; BG, Biguanide; α-GI, α-glucosidase inhibitor; DPP4i, dipeptidyl peptidase-4 inhibitor; SGLT2i, sodium-glucose co-transporter 2 inhibitor.
CGM data
Table 2 shows the CGM data for the hypoglycemia and nonhypoglycemia groups. In the hypoglycemia group, MBG and minimum blood glucose levels were low, and SD and CV, reflecting blood glucose variations, were high. The percent time at hypoglycemia was also high. There was no significant difference in either the percent time at hyperglycemic or the maximum blood glucose level, between the two groups.
Data are mean ± SD or n (%). measured by the continuous glucose monitoring system.
The Mann–Whitney U test was used to determine the association between hypoglycemia and nonhypoglycemia.
MBG, mean blood glucose; SD, standard deviation; FBG, fasting blood glucose, at 7:00 am measured by the continuous glucose monitoring system; CV, coefficient of variation.
CGM, continuous glucose monitoring.
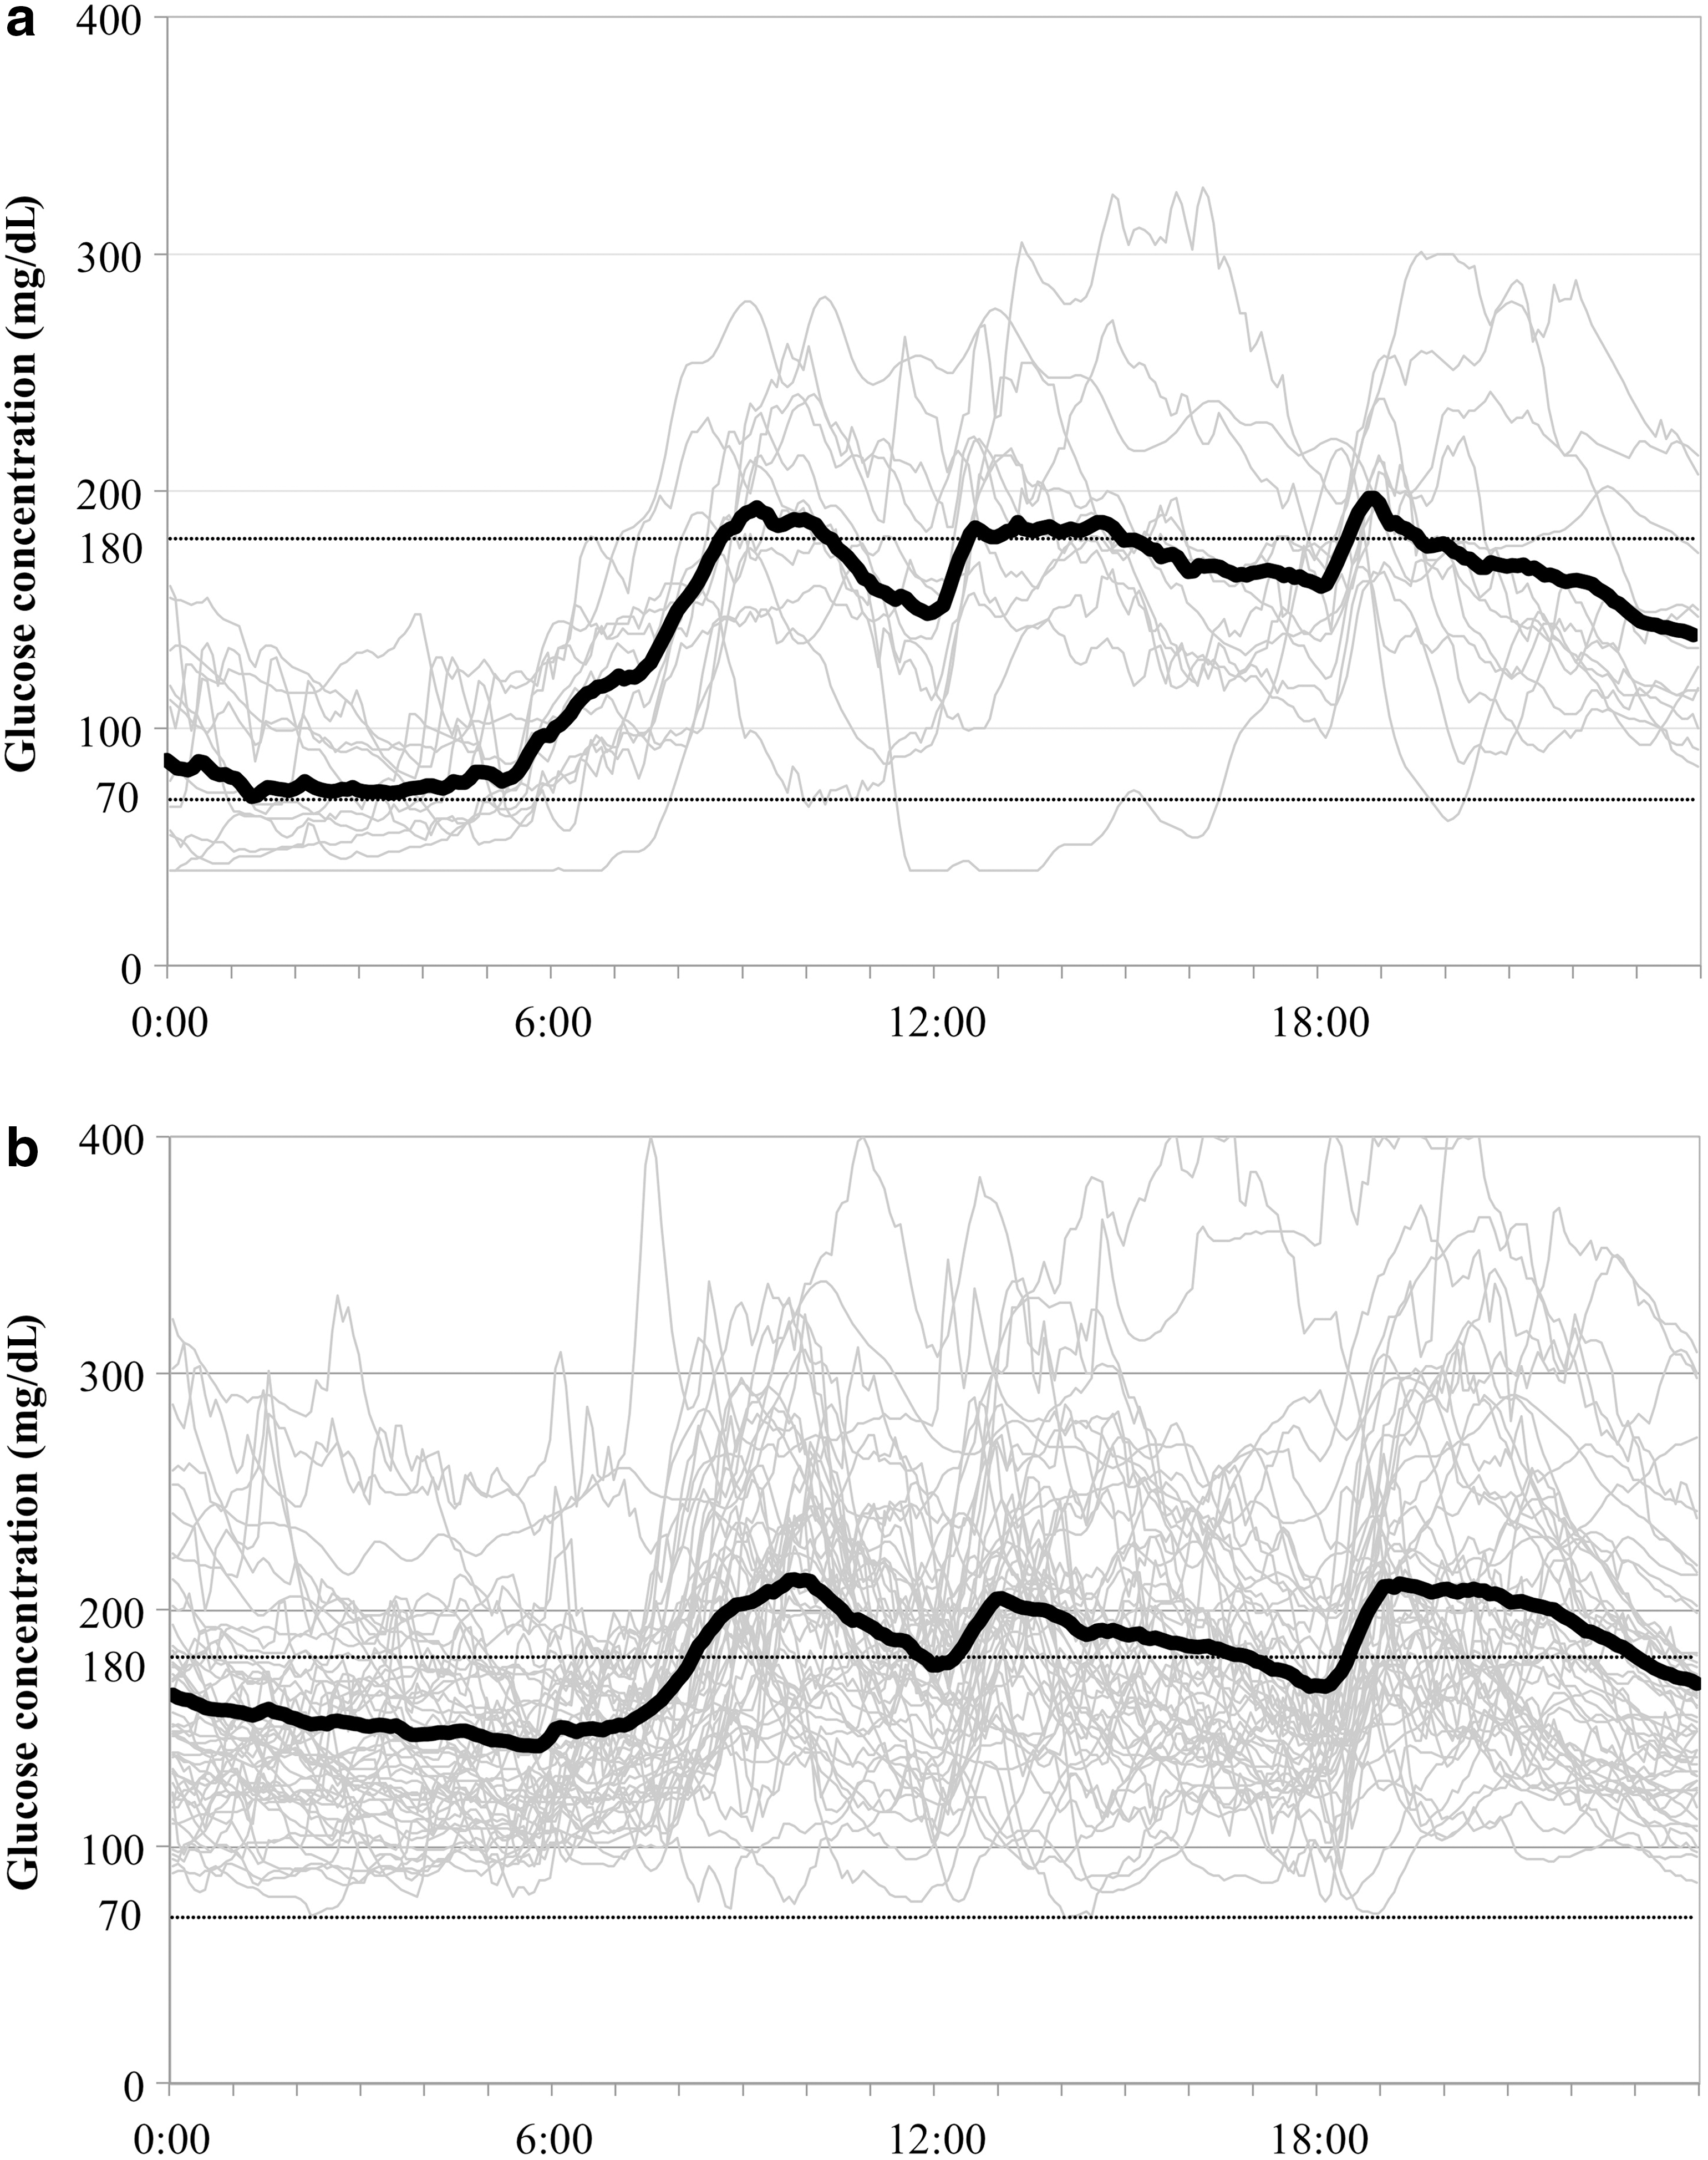
The CGM results of the 12 patients with hypoglycemia are shown in Figure 1. Hypoglycemia tended to occur during the period from 0:00 am to 7:00 am in all 12 patients, but none was aware of it. In only one patient, symptomatic (cold sweat, chills) hypoglycemia occurred before lunch. Although hypoglycemic symptoms disappeared in this patient immediately after ingesting 10 g of glucose and a full lunch meal, the CGM showed prolonged hypoglycemia.
Contributing Factors to Hypoglycemia
Multivariate logistic regression analysis identified MBG, SD, and CV as significant and independent factors that contributed to hypoglycemia (Table 3). To avoid multicollinearity, separate multivariate logistic regression analyses were performed for SD (model 1) and CV (model 2). The incidence of hypoglycemia was increased by 1.57 times (95% CI 1.21–2.99) for every 1 point increase in SD, and by 1.70 times (95% CI 1.29–2.95) for every 1 point increase in CV.
Model χ 2 test P < 0.001.
Gender, Age, Duration of diabetes, MBG, SD, CV, Basal, Bolus, Mix, and Total insulin dose were included in this multiple factor logistic regression.
MGB and SD were measured by the continuous glucose monitoring system.
Basal, basal insulin use (without bolus and mix insulin use); Bolus, bolus insulin use (without mix insulin use); Mix, mix insulin use.
Multivariate analysis using the stepwise procedure was carried out, employing the percent time at hypoglycemia as the dependent variable, and MBG, SD, use/no use of basal insulin, bolus insulin, mix insulin, and total insulin dose as the independent variables. The analysis identified MBG, SD, and the use of mix insulin as significant and independent determinants of hypoglycemia (Table 4).
Mutivariate stepwise regression analysis with Mean, SD, total insulin dosage (U/kg/day), using bolus, basal, and mix insulin as the independent variables.
MGB, SD, and FBG were measured by the continuous glucose monitoring system.
SE, standard error.
The area under the curve (AUC) and 95% CI were calculated from the receiver operating characteristic (ROC) curve, using the combination of the presence/absence of hypoglycemia and MBG, or the presence/absence of hypoglycemia and SD. Analysis of the ROC curve showed that the optimal cutoff value was 150.9 mg/dL (AUC = 0.718, 95% CI 0.557–0.880) for prediction of hypoglycemia by the MBG, and 41.1 mg/dL (AUC = 0.777, 95% CI 0.646–0.907) for prediction of hypoglycemia by the SD.
Using these cutoff values, all 62 patients were divided into the following four groups: (1) MBG-low/SD-low group (n = 17), (2) MBG-low/SD-high group (n = 6), (3) MBG-high/SD-low group (n = 17), and (4) MBG-high/SD-high group (n = 22) (Fig. 2). Comparison of the four groups showed significant differences in time at hypoglycemia and total daily insulin dosage. In the MBG-low/SD-high group, hypoglycemia was noted in all patients, and the percent time at hypoglycemia (19.9%) was the longest, and the total daily insulin dosage (43.5 U) was also the highest in this group (Fig. 2).

The mean-low/SD-high group spent the longest time at blood glucose of <70 mg/dL and used the highest daily dosage of insulin. The Kruskal–Wallis test was used to determine the association among the four groups.
Discussion
In this study, MBG and glycemic variability within the 24-h period were identified as significant and independent factors that contributed to the development of hypoglycemia in patients with T2DM on insulin therapy. Interestingly, short episodes of hypoglycemia, but also occasionally prolonged hypoglycemia, were recorded in all patients with low MBG level and exhibited wide variations in blood glucose values. The results also showed that the higher the daily total insulin dosage, the more frequent were the hypoglycemic episodes. The time spent in hypoglycemia was longer in patients on mix insulin.
The CGM system is an excellent tool for detecting hypoglycemia, and possible predictors of hypoglycemia determined by CGM have occasionally been reported. Pazos-Couselo et al. 10 demonstrated that the SD of CGM to be superior in detecting hypoglycemia, and Saisho et al. 11 reported that the combination of mean glucose and SD is useful for the prediction of hypoglycemia. In the present study, hypoglycemia was detected by CGM in 12 (19.4%) of 62 inpatients with T2DM who underwent CGM during insulin therapy. The results showed that hypoglycemia occurred in all patients who had low MBG levels and high SD. On the other hand, HbA1c was not selected as a background factor contributing to hypoglycemia, indicating that hypoglycemia cannot be predicted by HbA1c.
All subjects of the study were maintained on insulin therapy, but the use of mix insulin alone was particularly frequent in the hypoglycemia group. Ito et al. 12 reported that excessive administration of bolus insulin was associated with prolonged hypoglycemic time, independent of HbA1c. Our study confirmed the lack of correlation between HbA1c and hypoglycemic time. However, there was also no relationship between the dose of bolus insulin and hypoglycemia, and the use of mix insulin was identified as a contributing factor to the risk of hypoglycemia. McCall 13 reported that the use of mix insulin tended to cause hypoglycemia. The mix insulin preparations used by the patients of the present study were mostly mixed preparations of super rapid-acting insulin and neutral protamine Hagedorn (NPH) insulin. Given that nocturnal hypoglycemia occurred in patients of the hypoglycemic group, the NPH insulin component appears to be the most probable cause of hypoglycemia.
Based on the results of large-scale clinical studies such as UKPDS 14 and the Kumamoto study, 15 it is recommended that glycemic control be designed to achieve HbA1c values below 7% without inducing hypoglycemia. The current Japanese diabetes treatment guidelines 16 target an HbA1c of <7% to prevent complications, although the same guidelines recommend that this value be individually tailored, in consideration of age, duration of disease, organ damage, risk of hypoglycemia, support structures, and so on. According to a previous study employing CGM, 9 an HbA1c value of 7% corresponds to a MBG level of 154 mg/dL. In the present study that included patients on insulin therapy, hypoglycemia occurred in all patients with MBG level below 150.9 mg/dL and SD of ≥41.1 mg/dL, who had long hypoglycemic time relative to others. Thus, to achieve HbA1c values of <7% without hypoglycemia, we believe that a glycemic profile with smaller glycemic variability should be targeted by use of CGM, and that evaluation of glycemic variability should be incorporated into future guidelines.
The present study had several limitations. First, this was a retrospective study conducted at two different facilities involved in clinical care. Because the study was conducted in actual clinical settings, the insulin preparations and concomitant oral antihyperglycemic drugs used somewhat varied. Second, the number of subjects was only 62. It is necessary to conduct a prospective study on a larger population, which would allow a more accurate analysis. Furthermore, SMBG was not performed during the night. In addition, approximately 30% of the patients were on mix insulin therapy, which differs from the proportion in clinical practice. Finally, there is a difference between the estimated and measured HbA1c levels, which could be due to changes in meal size and exercise after hospitalization.
Our study identified two factors that contributed to episodic hypoglycemia in T2DM patients on insulin therapy; including MBG levels and glycemic variability. The results also showed that all patients with low MBG levels and marked glycemic variability developed hypoglycemia and spent relatively long time in hypoglycemia. Analysis of 24-h CGM recording also showed that high daily total insulin dosage is likely to be associated with hypoglycemia during the 24 h, and that relatively long time spent in hypoglycemia can be anticipated in patients using mix insulin preparations. When treating diabetic patients with insulin therapy, it is important to use the least possible dose of insulin, with the goal of minimizing glycemic variability, to achieve good glycemic control without inducing hypoglycemia.
Footnotes
Author Disclosure Statement
Y. Okada has received lecture fees from Novo Nordisk and Eli Lilly Japan. The other authors declare no conflict of interest.