
Abstract
Background:
Self-monitoring of blood glucose (SMBG) is important in diabetes therapy; however, not all SMBG systems are sufficiently accurate. In addition, some SMBG systems are influenced by the user's hematocrit value.
Methods:
System accuracy and hematocrit influence was evaluated for four SMBG systems with built-in insulin dose advisors (Accu-Chek® Aviva Expert [1], FreeStyle InsuLinx [2], FreeStyle Precision Neo [3], MyStar DoseCoach® [4]) based on International Organization for Standardization (ISO) 15197:2013 section 6.3 (system accuracy) and 6.4.3 (packed cell volume [hematocrit]) with three test strip lots for each system. Two different established comparison methods were used to investigate a possible impact of the comparison method on analytical performance data.
Results:
Two systems (2, 4) fulfilled ISO 15197:2013 accuracy criteria when the manufacturer's comparison measurement method was applied and showed with all three tested lots 97% to 99.5% of results within ±15 mg/dL and ±15% of the comparison measurement results at blood glucose (BG) concentrations <100 and ≥100 mg/dL, respectively, and 100% of results within consensus error grid zones A and B. Regarding hematocrit influences, two systems (3, 4) showed with all three tested lots ≤10 mg/dL and ≤10% difference between the test sample and the respective control sample for BG concentrations <100 and ≥100 mg/dL, respectively, when using the manufacturer's comparison measurement method.
Conclusions:
When using the manufacturer's comparison measurement method, two out of four SMBG systems fulfilled the minimum system accuracy requirements of ISO 15197:2013. In addition, varying hematocrit levels can affect measurement results with some SMBG systems with built-in insulin dose advisors.
Background
T
The International Organization for Standardization (ISO) standard 15197:2013 5 recommends test procedures and analytical performance requirements for SMBG systems, for example, concerning system accuracy. ISO 15197:2013 was harmonized in the European Union as EN ISO 15197:2015 6 with no changes regarding its requirements for performance studies. ISO 15197:2013 also includes the evaluation of influence quantities such as hematocrit and interferences (e.g., acetaminophen, ascorbic acid) that can affect the analytical performance of an SMBG system. Manufacturers usually apply the ISO 15197:2013 standard to obtain the Conformité Européenne (CE) mark for their system which is, in Europe, a minimum requirement for a product to be marketed.
Regarding system accuracy, at least 95% of the system's measurement results shall be within ±15 mg/dL of the results of the comparison method at blood glucose (BG) concentrations <100 mg/dL and within ±15% at BG concentrations ≥100 mg/dL (system accuracy criterion A), and at least 99% of results shall be within consensus error grid zones A and B (system accuracy criterion B). Compliance with system accuracy criteria must be shown for three different test strip lots.
Regarding hematocrit influences, ISO 15197:2013 defines that hematocrit effects are acceptable if the difference between the test sample and the respective control sample is ≤10 mg/dL and ≤10% for BG concentrations <100 and ≥100 mg/dL, respectively. Hematocrit influences shall be described in the instructions for use if the system exceeds these criteria.
In this study, system accuracy and hematocrit influence of four SMBG systems with built-in bolus advisors was assessed with three test strip lots each based on test procedures of ISO 15197:2013. Two established comparison measurement methods were used to investigate a possible influence of the comparison method on performance data.
Methods
The study was conducted from January to February 2016 at the Institut für Diabetes-Technologie Forschungs- und Entwicklungsgesellschaft mbH an der Universität Ulm (IDT), Germany, in compliance with the German Medical Devices Act. The study protocol was approved by the responsible Ethics Committee and the German Federal Institute for Drugs and Medical Devices. All participants signed informed consent before the study procedures. Test procedures were performed by trained study personnel based on the procedures described in detail in ISO 15197:2013.
Subjects
A number of 123 subjects (≥18 years) with diabetes mellitus type 1, type 2, or without diabetes were enrolled. For system accuracy evaluation, 118 subjects were included to obtain 100 evaluable data sets for each system. For hematocrit influence evaluation, 12 subjects were included to obtain data for each of the three specified concentration intervals. The study physician reviewed the subjects' anamnesis and medication, inclusion and exclusion criteria for study participation (e.g., pregnancy or lactation period, severe acute disease and/or chronic disease), and checked for interfering substances given in the manufacturer's labeling.
Test systems
In this study, four systems were evaluated: Accu-Chek® Aviva Expert (1), FreeStyle InsuLinx (2), FreeStyle Precision Neo (3), and MyStar DoseCoach® (4). System 4 had not been CE marked at the time of the study and was not yet introduced into the market. Test strip lots for this system (BGStar® test strips) and test strip lots for the other three systems were purchased from a local pharmacy. For each system, meters were obtained from the respective distributor. All meters displayed plasma equivalent glucose concentrations in mg/dL. The systems were adjusted, stored, and used following the manufacturer's labeling. Control measurements according to the manufacturer's instructions were performed daily before the test procedure and for each test strip vial to ensure the proper function of each system.
Comparison measurement methods
For each test system, comparison measurements were performed with two different methods/systems, a glucose oxidase (GOD) method (YSI 2300 STAT Plus glucose analyzer; YSI Incorporated, Yellow Springs, OH) and a hexokinase (HK) method (Cobas Integra® 400 plus; Roche Instrument Center, Rotkreuz, Switzerland). Comparison measurements were performed in duplicate with both comparison methods. Both methods provided BG values in mg/dL. For the YSI 2300 STAT Plus glucose analyzer and the Cobas Integra 400 plus instruments, conformity to the traceability requirements of ISO 17511 7 was confirmed by the manufacturers. Trueness and precision of the two analyzers were verified during the test procedures by regular internal and external quality control measures as required by the German national standard (Rili-BÄK). 8 In addition, daily quality control measurements were performed following IDT-internal standard operating procedures, and traceability to NIST SRM 965b was confirmed during the study. Bias and imprecision were ≤1.0% and ≤1.3%, respectively, for YSI 2300 STAT Plus and ≤0.6% and ≤1.0%, respectively, for Cobas Integra 400 Plus when using manufacturer-provided control materials. The manufacturer's comparison measurement method and/or the method used by the manufacturer for accuracy evaluation as indicated in the manufacturer's labeling is shown in Table 1.
GDH, Glucose dehydrogenase; GOD, glucose oxidase; HK, hexokinase.
Test procedures for system accuracy evaluation
System accuracy was evaluated for three lots of each system in a laboratory setting with controlled room temperature (20.1°C–23.2°C) and humidity (32.1%–54.3%) based on the procedures described in detail in ISO 15197:2013.
Before the measurement procedure, subjects were asked to wash and dry their hands. Samples were collected from the fingertip by skin puncture. Each system was tested on at least 100 capillary samples from different subjects. The hematocrit value of each sample was checked to be within 30% and 60% [based on the smallest range indicated in the manufacturer's labeling (Table 1)]. For this purpose, samples were collected in heparinized capillaries, the capillaries were centrifuged, and the hematocrit values were determined by using an alignment chart.
Measurements with each lot of a system were performed in duplicate on an individual sample, consecutively performed with two meters using test strips from the same vial. For each lot of a system, test strips from at least 10 different vials were used.
Samples were distributed according to ISO 15197:2013 into the following BG concentration categories over the clinically relevant BG concentration range: 5% ≤50 mg/dL, 15% >50 to 80 mg/dL, 20% >80 to 120 mg/dL, 30% >120 to 200 mg/dL, 15% >200 to 300 mg/dL, 10% >300 to 400 mg/dL, and 5% >400 mg/dL. Samples were assigned to the respective category according to the mean BG result of the respective comparison method. For BG concentrations >50 to ≤400 mg/dL, only unaltered samples were used. Adjusted samples could be used for BG concentrations <50 and >400 mg/dL. For this purpose, capillary blood samples were collected in lithium heparin tubes and adjustment of samples was performed by either incubation to allow for glycolysis or by glucose supplementation (stock solution: 40% glucose in 0.9% NaCl). In adjusted samples, the partial pressure of oxygen (pO2) was checked by using a blood gas analyzer (Opti™ Check; OPTI Medical Systems Incorporation, Roswell, GA) immediately after the test procedure to ensure a pO2 that is comparable to the pO2 in native capillary blood samples. 9
For unaltered samples, measurements were performed directly from the fingertip.
The measurement procedure was as follows: (1) Aliquots for measurements with the comparison methods were collected in lithium heparin tubes. (2) BG measurements with the four systems (one lot per system). (3) Aliquots for measurements with the comparison methods were collected in lithium heparin tubes. Aliquots were centrifuged and measurements were performed on separated plasma. The difference between the first (aliquot collected before the measurements with the test systems) and second (aliquot collected after the measurements with the test systems) comparison measurement result was checked to be ≤4 mg/dL at BG concentrations ≤100 mg/dL and ≤4% at BG concentrations >100 mg/dL to verify sample stability. Steps 1 to 3 were repeated for the other two test strip lots of each system.
A fresh drop of blood was generated before measurements with each system and before each aliquot collection for comparison measurements.
Adjusted samples were applied to the test strip directly from a syringe. Aliquots for comparison measurements were removed before and after the measurements with the four systems (three lots per system) and processed as described above.
Test procedures for evaluation of hematocrit influence
Hematocrit influence was evaluated for three lots of each system in a laboratory setting based on the procedures described in detail in ISO 15197:2013.
Venous samples were collected from different subjects for the following three glucose concentration categories based on ISO 15197:2013: 30–50 mg/dL, 96–144 mg/dL, and 280–420 mg/dL. Samples were assigned to the respective category according to the mean BG result of the respective comparison method. Glucose concentration was adjusted for the categories 30–50 and 280–420 mg/dL (adjustment as described above). The sample starting temperature was checked to be 23°C ± 5°C and maintained within ±3°C of the starting temperature during the test procedures.
For each glucose concentration category, individual samples with five different hematocrit levels were generated (Table 2). The highest and the lowest hematocrit levels were chosen according to the upper and lower limit of a system's acceptable range as indicated in the manufacturer's labeling (Table 1) and a mid-level sample with a hematocrit value of 42% ± 2% was generated. For adjustment of hematocrit values, an aliquot of the sample was centrifuged, plasma and packed cells were separated, and defined volumes of plasma, cells, and whole blood were mixed. The hematocrit value of each individual sample was determined in duplicate (as described above). In addition, the pO2 was checked in each individual sample (as described above).
Lowest and highest hematocrit levels represent the upper and lower limit of the acceptable range of a system as indicated in the manufacturer's labeling.
For each individual sample (combination of glucose concentration and hematocrit value), 10 consecutive measurements with each lot of a system were performed using 10 different meters. Before and after the measurements with one system (3 lots), measurements with the comparison methods were performed (as described above). Samples were applied to the test strip directly from a syringe. Each sample was measured within ≤8 h of sample collection.
Data analysis: system accuracy
Data exclusions
Data were excluded from analysis for the following reasons: the required number of samples in a BG concentration range was already reached; the sample probably contained endogenous or exogenous interferents; errors in sample handling; equipment failure; the test system provided no valid measurement result; the quality control measurement results obtained with the comparison method immediately before measuring blood samples were outside predefined limits; values of duplicate comparison measurements exceeded the acceptance criterion (coefficient of variation <5%) for duplicate measurements; the mean comparison measurement result was outside the test systems' measurement range; the difference between the first and second comparison measurements exceeded the acceptance criteria for sample stability (as defined above).
System accuracy analysis
For each system, 600 data (200 data for each lot) obtained from at least 100 capillary samples from different subjects were analyzed.
System accuracy was assessed for each lot individually by comparison of the test system's measurement results with the respective mean result of the comparison measurements (obtained from aliquots collected before and after the measurements with the system).
Based on ISO 15197:2013, the number and percentage of results within ±15 mg/dL of the mean comparison measurement result at BG concentrations <100 mg/dL and within ±15% at BG concentrations ≥100 mg/dL were calculated for each lot. The number of acceptable results at BG concentrations <100 mg/dL was added to the number of acceptable results at BG concentrations ≥100 mg/dL to determine the accuracy of an individual lot. For consensus error grid analysis, the number and percentage of results within zone A and B of each lot was calculated and acceptability of a system was determined by combining the results of the three lots.
For each system, accuracy results are presented based on ISO 15197:2013 in a table and as difference plots in which the differences between each individual system measurement result and the respective mean comparison result are shown. In addition, in the supplements, data are presented in rectangle target plots, 10 which is a new approach to a simplified and comprehensible visualization of the measurement accuracy of an SMBG system. Rectangle target plots may allow for easier visual inspection of lot-to-lot variability. 11
Bias analysis
The relative bias (%) of the measurement results was calculated for each lot of a system according to Bland and Altman
12
by using the following formula:
in which BG is a single measurement result, comparison is the mean result of the comparison measurements (obtained from samples collected before and after the measurements with the system), and n is the number of all BG measurement results. The relative bias is shown with 95% limits of agreement (≈ ± 1.96 × standard deviation).
Data analysis: hematocrit influence
Data exclusions
Data were excluded from analysis for the following reasons: the difference between the first and second comparison measurements exceeded the acceptance criteria for sample stability (as defined above); the pO2 was outside the acceptable range (55–100 mmHg); equipment failure; and error messages.
System 4 displayed multiple Error 4 messages (problem with blood sample) when measuring samples at glucose concentrations 280–420 mg/dL and with hematocrit levels 50% and 60%. According to the information provided in the manufacturer's labeling, extreme conditions or extremely high glucose concentrations could be the reason for Error 4 messages.
Additionally, the occurrence rate of Error 4 could be, at least in part, attributable to the preparation procedure described in ISO 15197:2013, clause 6.4.3 for hematocrit evaluation (according to this standard, venous blood is the preferred sample for the evaluation of hematocrit influence).
Analysis of hematocrit influence
Hematocrit influence was evaluated for each glucose concentration and for each lot of a system separately. The assessment of hematocrit influences is not clearly described in ISO 15197:2013 (differences in content between section 6.4.3.2 [acceptance criteria] and section 6.4.3.5 [data analysis and presentation of results]). In this study, hematocrit influences were assessed based on the requirements in section 6.4.3.5. For each individual sample (combination of glucose concentration and hematocrit value), the bias between the mean glucose result measured with the test system (mean of 10 measurements) and the mean result of the comparison measurements was calculated. For system 4, only data of 6 (lot 2) and 8 (lot 3) measurements with the test system were available at high glucose concentration 280–420 mg/dL with a hematocrit level of 60% (level 5). The reason for this was many Error 4 messages (see also data exclusions).
To assess the hematocrit influence for each glucose concentration, the difference between the bias at each hematocrit level and the bias at the mid level (42% ± 2%) was calculated (compensated bias).
Results
System accuracy
In this evaluation, system 2 and system 4 fulfilled ISO 15197:2013 accuracy criteria when the manufacturer's comparison method was applied and showed with all three tested lots at least 97% and 98% of results, respectively, within ±15 mg/dL and ±15% of the comparison measurement results at BG concentrations <100 and ≥100 mg/dL, respectively, and 100% of results within consensus error grid zones A and B (Table 3, Fig. 1, Supplementary Fig. S1; Supplementary Data available at
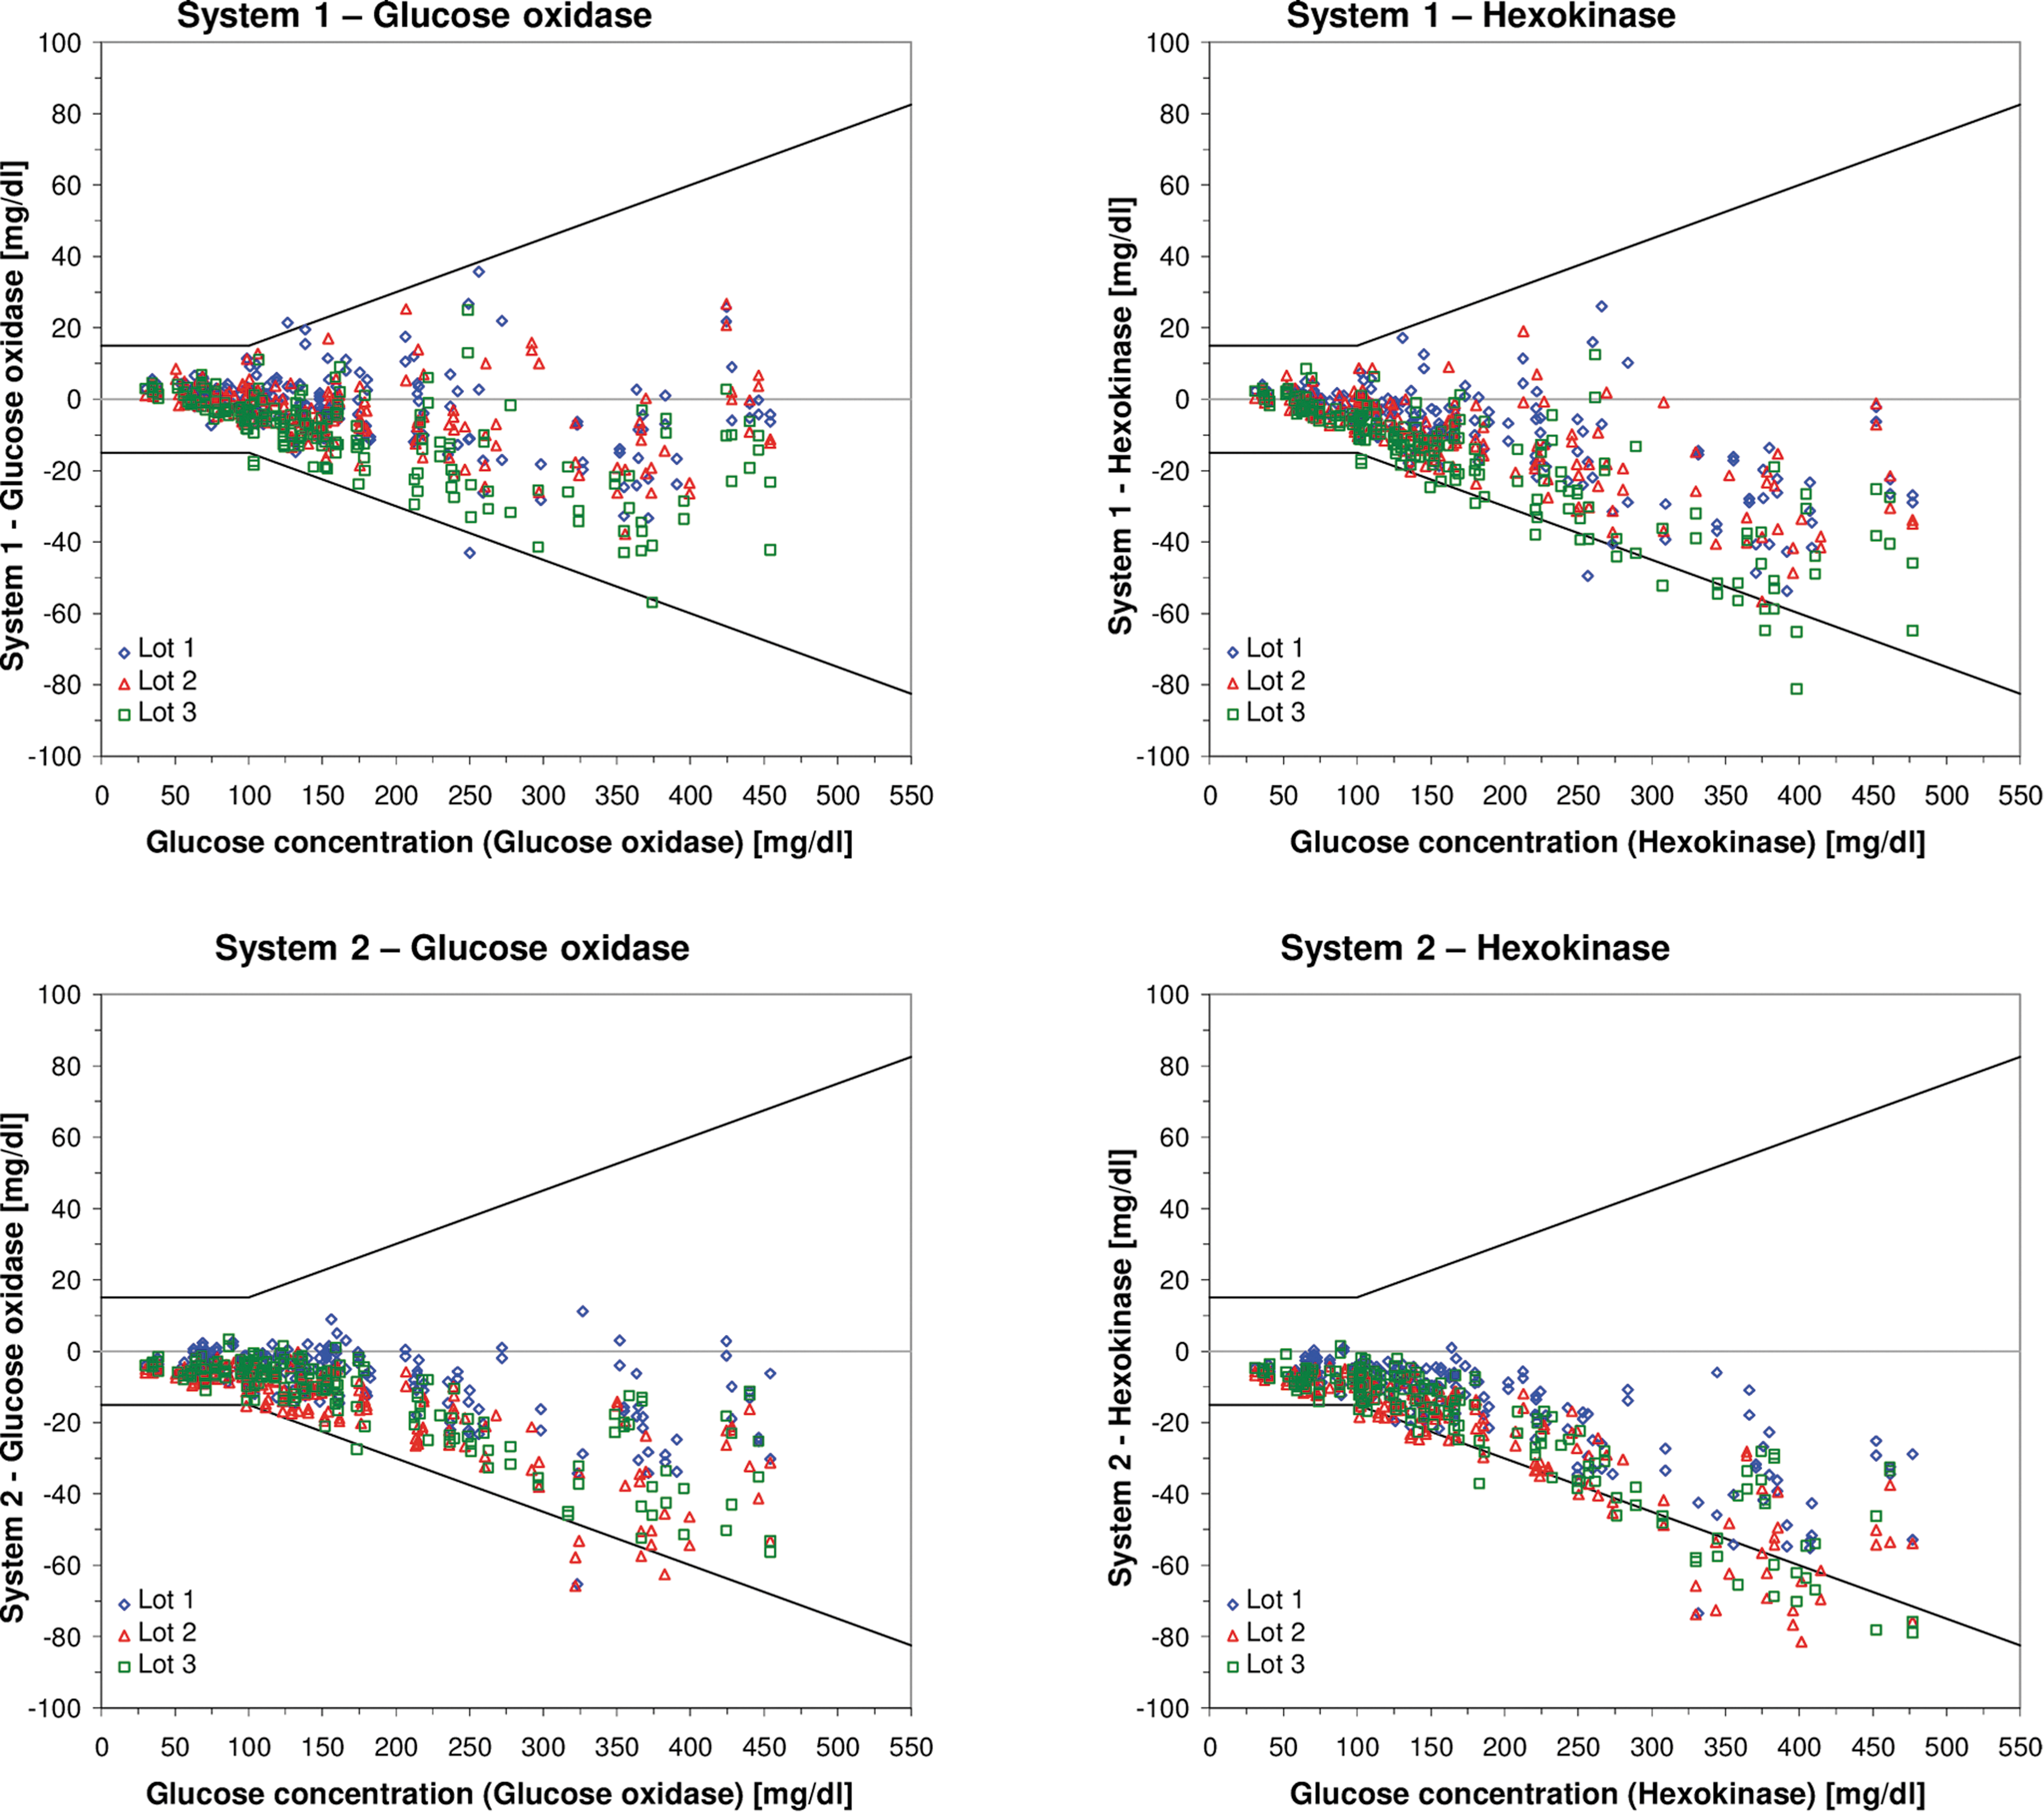
Difference plots for the four test systems when evaluated against the GOD method (left side) and when evaluated against the HK method (right side). GOD is the manufacturer’s comparison method for system 2, system 3, and system 4; HK is the manufacturer’s comparison method for system 1. The three test strip lots are displayed by different symbols (diamond: lot 1; triangle: lot 2; square: lot 3). ISO 15197:2013 system accuracy limits are displayed in solid lines. GOD, glucose oxidase; HK, hexokinase; ISO, International Organization for Standardization.
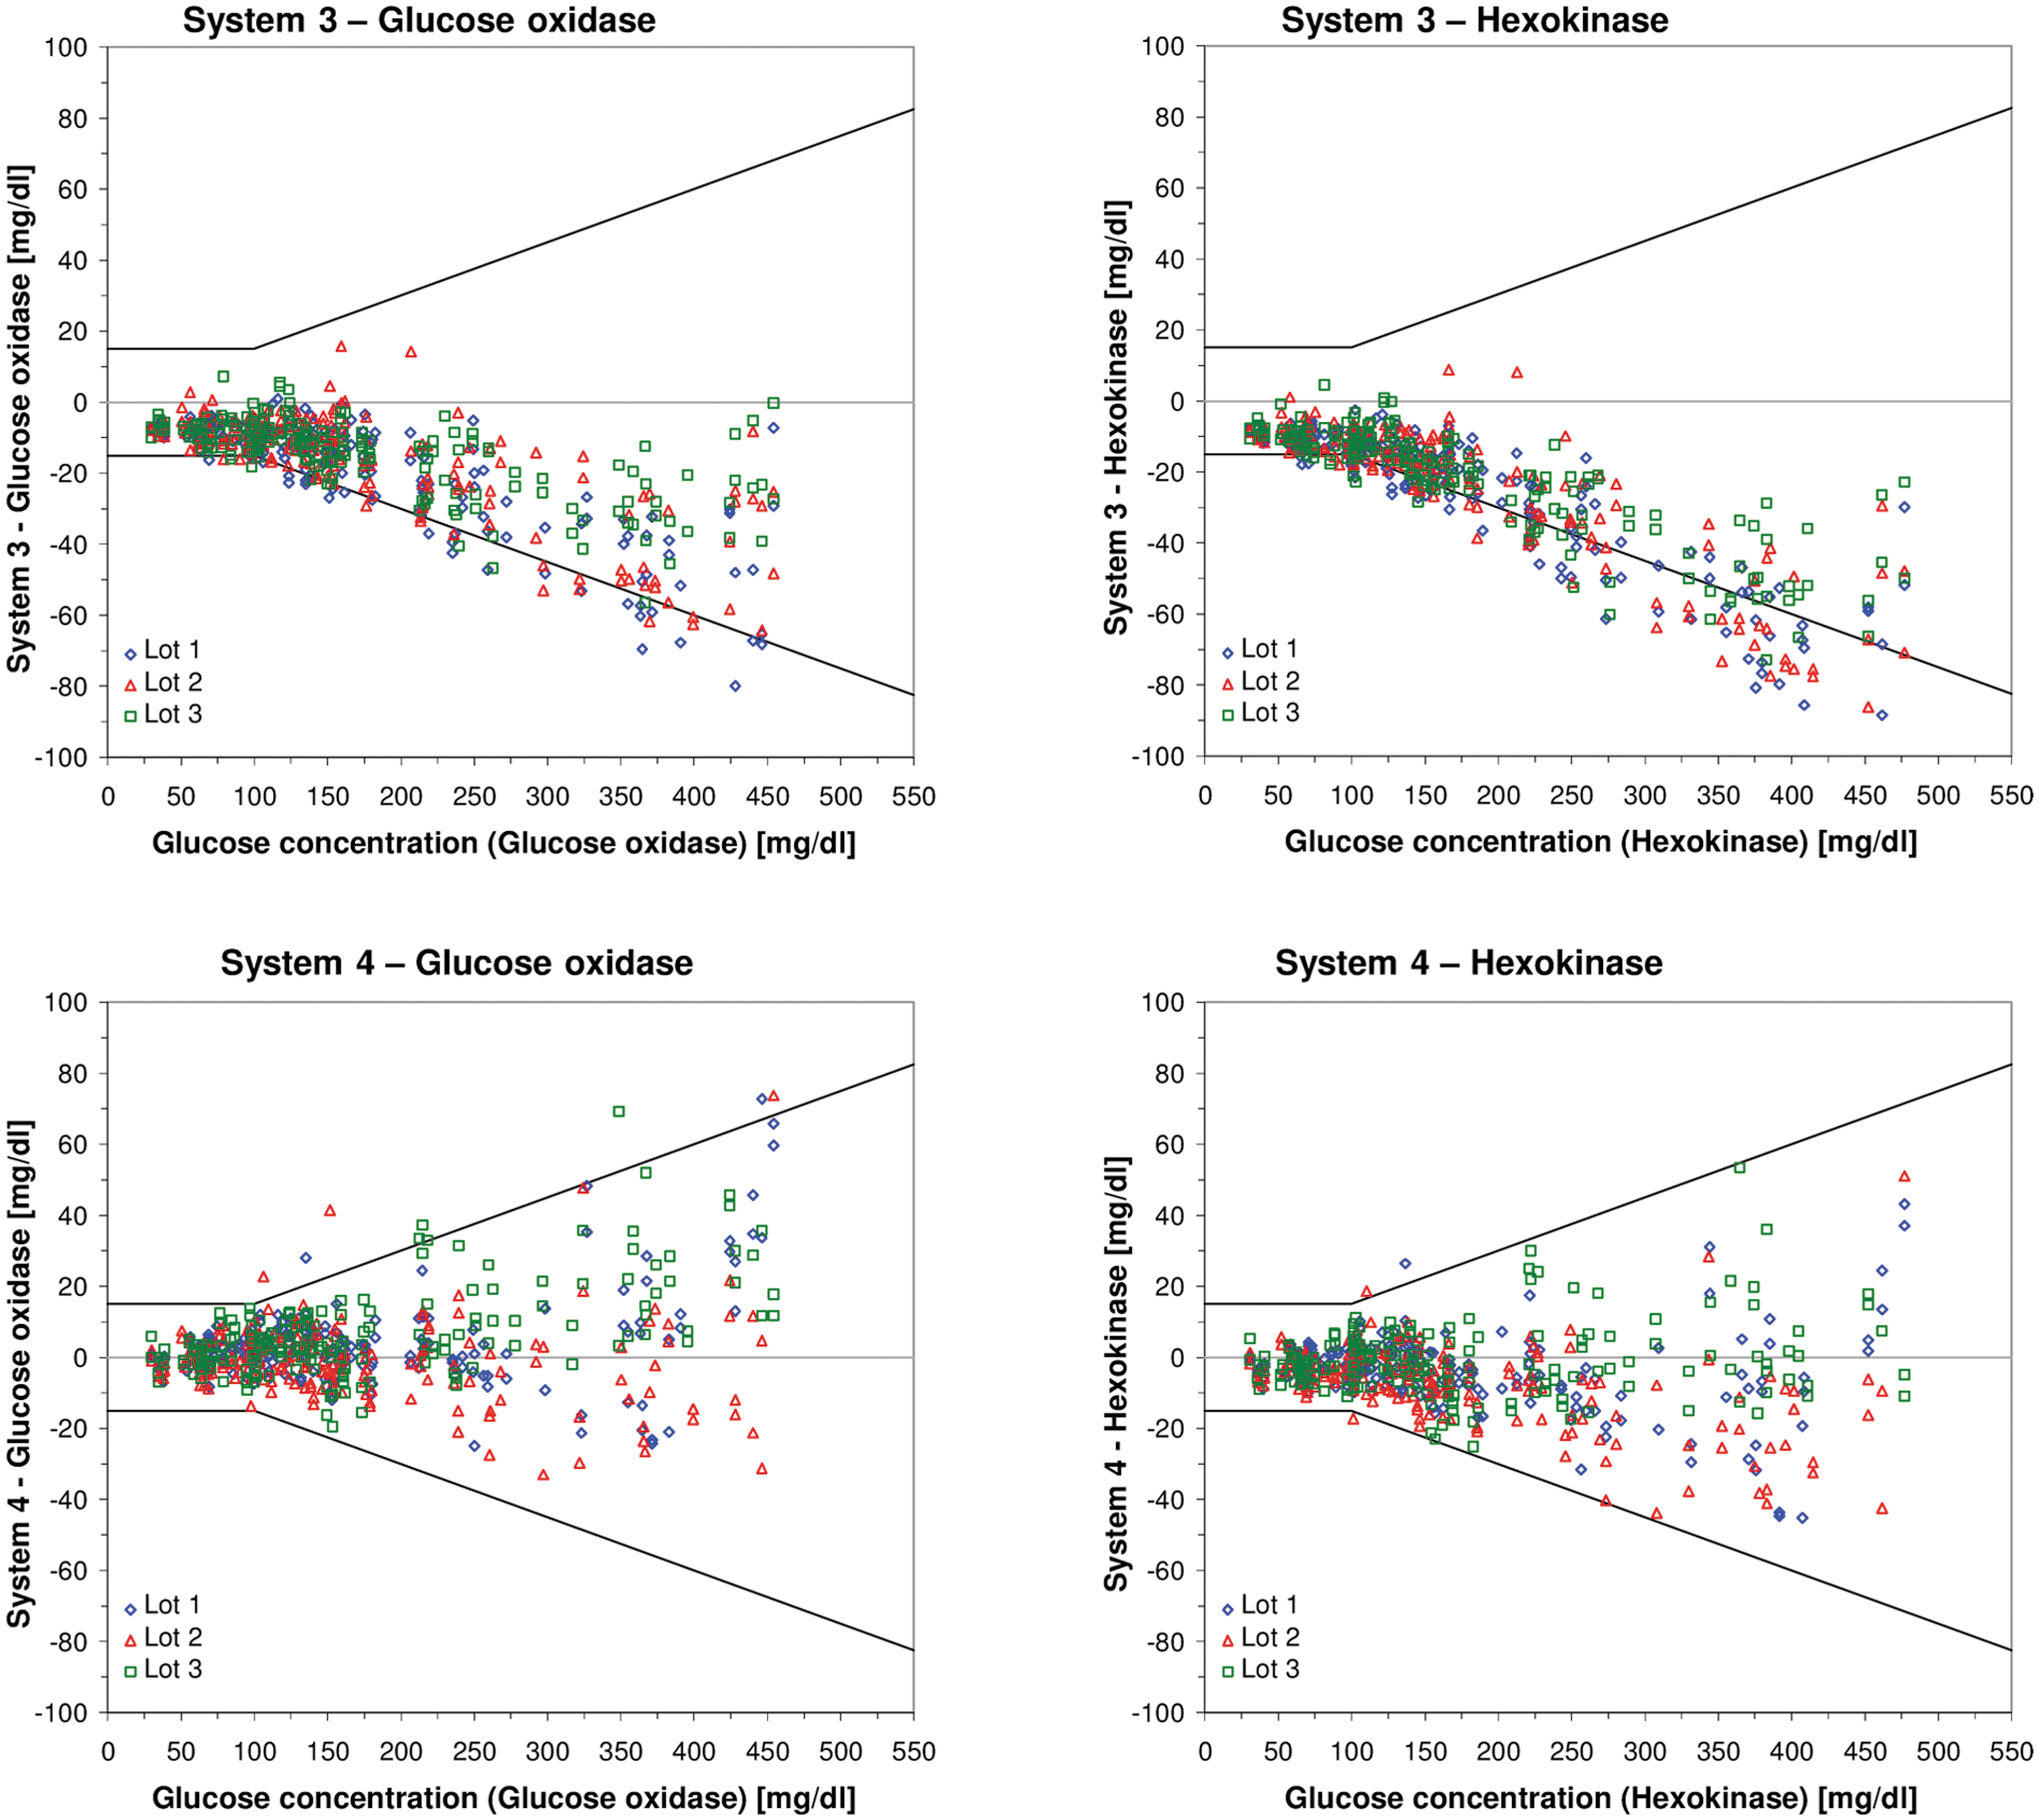
Results are shown for both comparison methods. Results from the analysis against the manufacturer's comparison method are shown in boldface.
ISO, International Organization for Standardization.
When evaluated against the manufacturer's comparison method, the relative bias of individual lots ranged from −12% (system 3) to +2.3% (system 4); the smallest relative bias was −0.8% (system 4) (Table 4, Supplementary Fig. S2). The maximum difference in bias between any of the three lots of a system ranged between 2.1% (system 3) and 4.6% (system 2) (Table 4). When evaluated against the alternative comparison method, the relative bias of individual lots ranged from −15.8% (system 3) to +0.0% (system 1) (Table 4, Supplementary Fig. S2). The maximum difference in bias between any of the three lots of a system ranged between 2.0% (system 3) and 4.5% (system 2) (Table 4).
Results from the analysis against the manufacturer's comparison method are shown in boldface.
Hematocrit influence
A complete presentation of results based on ISO 15197 is provided in Supplementary Tables S1 and S2, including the mean result of the comparison measurements, mean result and standard deviation of the measurements with the test system, the absolute and relative bias, and the absolute and relative compensated bias.
When evaluated against the manufacturer's comparison method, system 3 and system 4, and when evaluated against the alternative comparison method only system 3, showed with all three tested lots ≤10% difference (compensated bias) between the bias at each hematocrit level and the bias at the mid level at glucose concentrations ≥100 and ≤10 mg/dL at glucose concentrations <100 mg/dL (Fig. 2, Supplementary Tables S1 and S2).

For each test strip lot, the compensated bias (difference between the bias at each hematocrit level and the bias at the mid level [42% ± 2%]) was calculated for each of the three concentration categories (30–50, 96–144, and 280–420 mg/dL). Lines connecting individual data points are provided for a simplified visualization and do not represent measured data. Each system was tested within the labeled hematocrit range. The compensated bias was calculated when using the respective manufacturer's comparison measurement method (GOD is the manufacturer's comparison method for system 2, system 3, and system 4; HK is the manufacturer's comparison method for system 1). Solid gray lines show ≤10% and ≤10 mg/dL limits at glucose concentrations ≥100 mg/dL and at glucose concentrations <100 mg/dL, respectively.
Discussion
In this study, system accuracy and hematocrit influence of four SMBG systems with built-in insulin dose advisors were evaluated with three test strip lots each under standardized controlled laboratory conditions by using two established comparison methods/systems (GOD method/YSI 2300 STAT Plus glucose analyzer and HK method/Cobas Integra 400 plus). Two systems fulfilled with all three tested lots ISO 15197:2013 accuracy criteria when the manufacturer's comparison method was applied. Only one system fulfilled with all three tested lots ISO 15197:2013 accuracy criteria irrespective of the comparison method/system applied. ISO 15197:2013 allows the use of a comparison measurement procedure that conforms to traceability requirements of ISO 17511 7 for the evaluation of SMBG systems. For both systems used in our study for comparison measurements, compliance with traceability requirements was confirmed by the manufacturers. However, in two of the four tested SMBG systems, the comparison measurement method/system applied had a considerable impact as to whether the data obtained comply with ISO 15197:2013 accuracy criteria or not. Differences in accuracy data depending on the applied comparison method/system were also found in two previous ISO 15197-based studies performed at our institute. 13,14 Thus, the comparison method/system used in an evaluation may have a considerable influence whether a SMBG system complies with established standards or not, which became even more relevant with more stringent accuracy criteria of ISO 15197:2013. This influence might be reduced if manufacturers would adjust calibration of their reference methods. 15
For one system evaluated in this study, accuracy applying ISO 15197:2013 criteria was investigated in two recent publications. 16,17 However, testing procedures in these studies showed remarkable deviations to the ISO 15197:2013 standard, for example, regarding number of test strip lots, distribution in different BG concentration categories, and blood sample. The variability between multiple test strip lots used for the same system is an important aspect of a system's accuracy. ISO 15197:2013 stipulates that three different lots of a system shall be evaluated and that each lot must show at least 95% of results within the required limits. In this study, the systems showed differences in relative bias of 2.0% (system 3) to 4.6% (system 2) between the three lots. Lot-to-lot variations can have a decisive influence on accuracy data obtained for an SMBG system; thus, regular and standardized evaluations of each released test strip lot are important to ensure constant adherence to established standards.
Patients on intensive insulin therapy using SMBG systems with built-in insulin dose advisors may trust in automatically calculated insulin doses. However, inaccuracies in an SMBG system's measurements may lead to incorrect calculations and false insulin dosing decisions which can worsen over time. 18,19 In a recent study at our institute, different SMBG systems were investigated with regard to system accuracy and possibly related calculated insulin dosing errors. 20 In this study, five out of six systems fulfilled ISO 15197 accuracy criteria. Although all systems showed 100% of the results within consensus error grid zones A and B, for some SMBG systems, considerable insulin dosing errors were calculated.
Another underestimated but important factor that can affect system accuracy is the blood sample's hematocrit value. 21 –25 The hematocrit is the relative packed cell volume in whole blood with reference ranges in adults between 36% and 48% (women) and 40%–53% (men) and in newborn between 40% and 70%. 26 In hospitalized patients, hematocrit values between 10% and 73% were observed. 27 Hematocrit influences on SMBG measurement results are considered in ISO 15197:2013, including testing procedures and acceptance criteria. However, data on hematocrit influences obtained in ISO 15197:2013-based studies are rare. In our study, hematocrit influences were evaluated for four SMBG systems based on ISO 15197:2013. When interpreting results of our study, it has to be taken into account that this study design has several limitations, which can contribute to the outcome of a given system, for example, the use of venous blood samples (system 1, 3, and 4 are only indicated for use with capillary blood samples), the investigation of only five different hematocrit levels (the TNO Prevention and Health quality guideline requires various hematocrit values in the manufacturer's indicated range with steps of 5% 28 ), and the inclusion of blood samples from only a small number of different subjects.
Although all four systems were tested within their labeled hematocrit range, only two systems showed with all three tested lots ≤10 mg/dL and ≤10% difference between the test sample and the respective control sample for BG concentrations <100 and ≥100 mg/dL, respectively, when the manufacturer's comparison method was used. According to ISO 15197:2013, hematocrit effects shall be described in the instructions for use if they exceed these limits (≤10 mg/dL and ≤10%). In our study, hematocrit influences became particularly relevant at low hematocrit levels (10%, 15%) and middle and higher glucose concentrations (96–420 mg/dL). Other studies also showed that hematocrit influences depend on the glucose concentration. 22,29 Three of the tested systems often showed overestimated glucose measurements at low hematocrit levels and underestimated glucose measurements at high hematocrit levels. Varying BG measurements with increasing or decreasing hematocrit levels were often reported in studies investigating hematocrit effects. 21,22,25 Hematocrit changes may alter blood viscosity and decrease or increase the diffusion into the reaction chamber of the test strip. 29,30 Today, many SMBG systems have compensation mechanisms to correct the measurement for hematocrit interferences. 23,24,30
In conclusion, results of our study showed that not all SMBG systems with integrated insulin dose advisors fulfilled accuracy criteria of ISO 15197:2013 with each available test strip lot. However, accurate measurements with each test strip lot of an SMBG system are required to allow for adequate insulin dosing decisions. Results of our study also indicate that the comparison method/system may have an influence on system accuracy data. Therefore, a harmonized calibration of comparison methods/systems used for the calibration/evaluation of SMBG systems to a higher order standard is important to provide comparable information about SMBG system accuracy. Regarding measurements with some SMBG systems, variations in hematocrit levels are an underestimated but important error source. Therefore, in patients with increased or decreased hematocrit values, SMBG systems should be carefully chosen by physicians and medical professionals.
Footnotes
Acknowledgments
The authors would like to thank the study personnel and other employees of the IDT who conducted the study and helped preparing the article. This study was funded by Sanofi.
Author Disclosure Statement
G.F. is General Manager of the IDT (Institut für Diabetes-Technologie Forschungs- und Entwicklungsgesellschaft mbH an der Universität Ulm, Ulm, Germany), which carries out clinical studies on the evaluation of BG meters and medical devices for diabetes therapy on its own initiative and on behalf of various companies. GF/IDT have received speakers' honoraria or consulting fees from Abbott, Ascensia, Bayer, Berlin-Chemie, Becton-Dickinson, Dexcom, LifeScan, Menarini Diagnostics, Novo Nordisk, Roche, Sanofi, Sensile, and Ypsomed. N.J., A.B., S.P., C.L., and C.H. have disclosed that they are employees of IDT. A.B. and F.F. are employees of Sanofi-Aventis Deutschland GmbH.
References
Supplementary Material
Please find the following supplemental material available below.
For Open Access articles published under a Creative Commons License, all supplemental material carries the same license as the article it is associated with.
For non-Open Access articles published, all supplemental material carries a non-exclusive license, and permission requests for re-use of supplemental material or any part of supplemental material shall be sent directly to the copyright owner as specified in the copyright notice associated with the article.