
Abstract
Background:
Glycemic variability (GV) can be used to assess glycemic control in diabetes, but there is no clear consensus concerning the methods to use for its assessment. Methodological differences have resulted in differences in the outcome of GV metrics used in research studies, controversies over clinical impact, and an absence of integration into routine care.
Aim:
To identify the indicators of GV most meaningful for clinicians, patients, and clinical researchers.
Materials and Methods:
Continuous glucose monitoring data were collected during the first 3 months of a pediatric diabetes clinical trial (Start-In!; n = 142). We used principal component analysis (PCA) to analyze weekly averages for 22 parameters relating to GV.
Results:
PCA identified five groups of parameters and three components explaining 85.7% of the variance. These components represented the amplitude, direction (hypoglycemia vs. hyperglycemia), and timing (within-day vs. between-days) of glucose excursions.
Conclusions:
This study provides elements that could make GV parameters more useful in clinical practice and research. No single parameter was sufficient to represent the complexity of GV, but it was possible to restrict the number of indicators required. The five groups of parameters identified by PCA could facilitate the choice of the most relevant outcomes for GV analysis in pediatric diabetes according to the purpose of the analysis (e.g., exploration of GV associated with hypo- or hyperglycemia, with short- or long-term periodicity, or GV in its entirety).
Introduction
B
The impact of glycemic variability (GV) in critically ill patients and in patients with diabetes 2 highlights the importance of quantifying GV as an independent parameter during evaluations of the quality of glycemic control in patients with diabetes. 3 –5 Such measurements are particularly important in the pediatric population, because GV is greater in children, and particularly in toddlers and adolescents. 6 Fluctuations of glucose concentration are associated with a risk of acute complications, such as severe hypoglycemia. 7,8 Several studies have identified GV as a risk factor for microvascular complications, regardless of HbA1c levels, 9 but this suggestion remains controversial. 2,3,10,11 GV has recently been shown to be associated with changes in brain structure and function in young children with type 1 diabetes, 12 and may well have a clinically relevant impact on quality of life. 13
Unstable BG concentrations were initially described in the 1970s, in observations of subjects in extreme clinical situations. 14 –16 Over the past three decades, several indices have been developed, based on 24-h profiles for the self-monitoring of BG concentrations, for evaluating the distribution of glycemia (mean BG, standard deviation [SD], coefficient of variation [CV], median, interquartile range [IQR], J-index 17 ), the amplitude of fluctuations (mean amplitude of glycemic excursions [MAGE] 15 and lability index [LI] 18 ), the day-to-day reproducibility of BG profiles (mean of daily difference [MODD] 16 ), quality scores for glucose control (mean value [M value], 14 the glycemic risk assessment diabetes equation [GRADE] 19 ), or predicting the risk of an acute event (low blood glucose index [LBGI], 20,21 high blood glucose index [HBGI], 20,21 and average daily risk range [ADRR] 22 ).
The advent of continuous glucose monitoring (CGM) devices should improve diabetes care. 23 In cases of GV, these devices can provide information for existing parameters 22,24,25 and for the development of new parameters, through a dynamic approach to the measurement of BG level fluctuations over several days (BG rate of change [BG rate], 24,26 continuous overall net glycemic action [CONGA], 27 and SD within days [SDw], SD between daily means [SDdm], and SD between time points [SDb hh:mm]). 28
However, the number of parameters available for GV assessment is continually increasing, and there is no clear consensus concerning their use in practice. 3,4 GV outcomes differ considerably between studies. 29 Moreover, both observational studies evaluating the impact of GV on vascular complications and clinical trials evaluating the effect of treatment (insulin therapy, carbohydrate counting, and use of CGM) on GV have generated conflicting results. 30,31 There is, therefore, a need to find ways to simplify the evaluation and quantification of GV, while describing this phenomenon as completely as possible.
We aimed to identify the indicators of GV most useful for clinicians, patients, and clinical researchers. Principal component analysis (PCA) is an exploratory method for data analysis that can be used to explore an entire set of parameters without the need for prior assumptions. We therefore used PCA to analyze the contribution of 22 GV parameters from the first 3 months of the Start-In! clinical trial.
Materials and Methods
Data were collected in a 1-year, randomized prospective multicenter trial carried out in France (Start-In!: Study of Augmented Real-Time Insulin Therapy in Pediatrics, NCT00949221,
Twenty-two GV indices, validated with CGM data, were retained. Each GV parameter was calculated weekly, for the first 12 weeks of the study. We defined a valid week as a week with at least 1400 interstitial glucose determinations (i.e., 70% of the 2016 determinations per week expected) and 14 BG calibrations (i.e., 2 per day).
Seventeen of the parameters were considered to be “descriptive” and the other five were considered to be “risk indicators”.
32
The descriptive parameters assessed GV over time, through the determination of glucose distribution (mean BG, SD, CV, J-index,
17
median, IQR, SDw, SDb 01:00, SDdm
28
), glucose fluctuations (MAGE,
15,25
LI,
18
BG-rate
24,26
) or the reproducibility of glucose levels (MODD,
16
CONGAn
27
—here CONGA 1, 2, 4 and 24). The risk indicators scored GV to evaluate the quality of glycemic control (M-value [M100],
14
GRADE
19
) or to predict acute metabolic events, such as hypoglycemia (LBGI
20,24
), hyperglycemia (HBGI
24
) or both (ADRR
22
). The methods by which these parameters were calculated from CGM data are detailed in the Supplementary Table S1; Supplementary Data are available at
For descriptive analyses of the distribution of GV parameter values, we calculated the mean and the SD. The relationships between GV parameters were explored by determining Pearson's correlation coefficient. These analyses were performed for the first valid week of data for each patient. The strength of the correlation was assessed by calculating the ρ coefficient and was classified as very strong (ρ ≥ 0.80), strong (0.60–0.79), moderate (0.40–0.59), weak (0.20–0.39) or very weak (<0.20). 33
We carried out a PCA, with correlation matrices, to study the GV phenomenon. PCA is an exploratory statistical method used to summarize the internal structure of datasets containing several variables and to elucidate the relationships between variables and dominant trends. It involves identifying major components in the form of linear combinations of the initial variables. The principal components (PCs) should capture as much of the information provided by the dataset as possible, to facilitate extraction of the structure underlying the phenomenon studied. Using the Kaiser criterion, we retained components with an eigenvalue of at least 1. 34 PCA was initially performed for the dataset of each week, to check the stability of the results over time (Supplementary Table S2). We then merged the data for all 12 weeks, for PCA on the entire dataset.
All analyses were performed with SAS 9.4. (SAS Institute, Cary, NC).
Results
Population and dataset
In total, 151 subjects were included in the Start-In! study between September 2009 and April 2011; 142 completed the first 12 weeks of follow-up and presented at least 1 valid week of data. These subjects had a mean age of 11.8 (SD = 3.7) years and a mean HbA1c level at baseline of 8.6% (SD = 0.7; 70 mmol/mol). More than 70% of the 1704 possible weeks of data for these patients (n = 1197) were considered valid, corresponding to 8.4 (SD = 3.3) valid weeks of data per patient.
Descriptive analysis and correlation
The distributions of the 22 GV indicators at baseline are presented in Table 1, and Pearson's correlation coefficients are presented in the Appendix. Most correlations between parameters were moderate to very strong (ρ ≥ 0.40), but the correlations of LBGI, SDb01:00 and the median with the other 19 parameters were weak or very weak for 17, 13 and 10 of the parameters, respectively.
Glucose concentration was measured in mmol/L. The data shown are means (SD). Distribution of GV indices at baseline in the Start-In! population: threshold values for risk indicators, identifying cases of poor glycemic control and a high risk of hyperglycemic events, concordant with the high median HbA1c level in this study population (8.6%, 70 mmol/mol).
ADRR, average daily risk range; BG, blood glucose; BG rate, blood glucose rate of change; CONGA, continuous overall net glycemic action; CV, coefficient of variation; GRADE, glycemic risk assessment diabetes equation; GV, glycemic variability; HBGI, high blood glucose index; IQR, interquartile range; LBGI, low blood glucose index; LI, lability index; MAGE, mean amplitude of glycemic excursion; MDI, multiple daily injections; MODD, mean of daily difference; M value, mean value; SD, standard deviation; SDb01:00; standard deviation between time points separated by 1 hour; SDdm, SD between daily means; SDw, standard deviation within days.
Principal component analysis
Three components accounted for 85.6% of the variance, with eigenvalues of at least 1 (Table 2). Five groups of indicators can be discerned on the three-dimensional projection (Fig. 1).
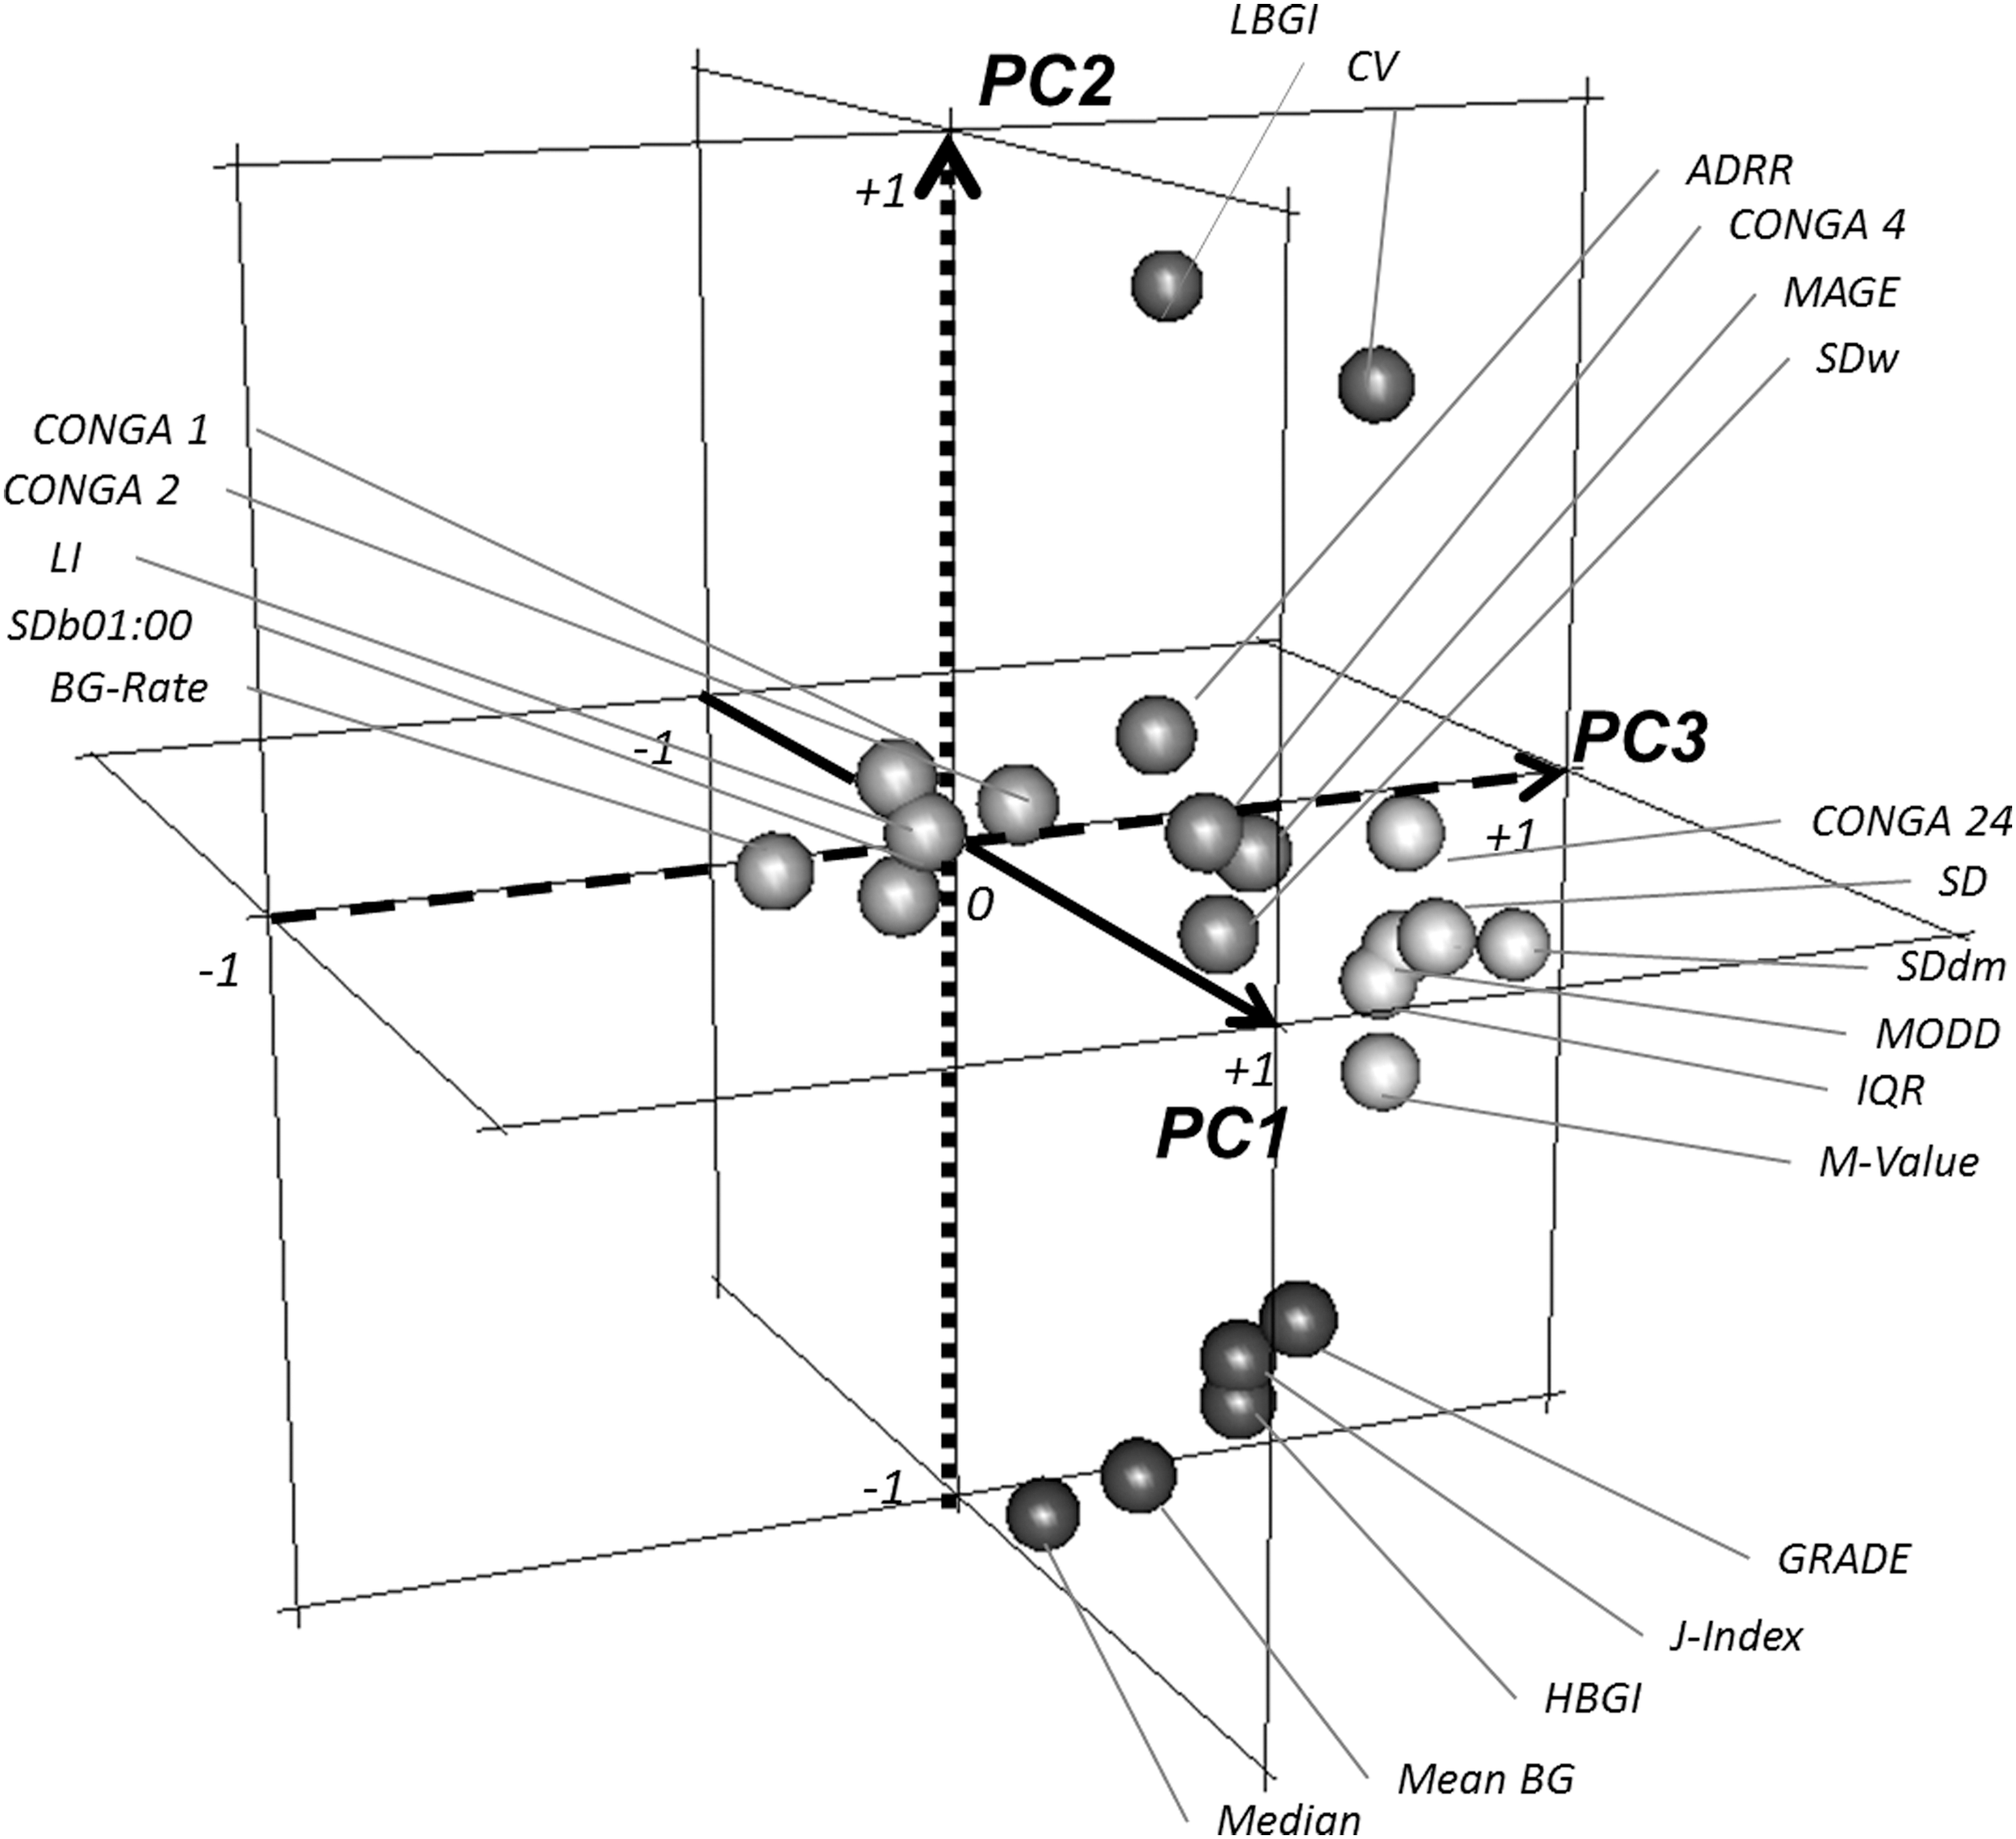
Three-dimensional representation of PCA loading values, with PC1 on the transverse axis, PC2 on the vertical axis, and PC3 on the horizontal axis. Three components defined five groups of parameters that were not differentiated for PC1 (transverse axis—solid line) because all loadings were close to 1; this component may be interpreted as representing the amplitude of glucose excursion. Two groups (dark gray) were identified on the basis of their loadings on PC2 (vertical axis—dotted line); this component corresponds to the direction of glucose excursions: hypoglycemia (top of the figure—LBGI and CV) or hyperglycemia (bottom of the figure—mean, median, J-index, GRADE, and HBGI). Three groups (light gray) were distinguished on the basis of their loadings on PC3 (horizontal axis—dashed line); this component corresponds to the timing of glucose excursions: short- (left of the figure—SDb01:00LI, LI, BG-rate, CONGA 1, and CONGA 2), medium- (middle of the figure—SDw, MAGE, CONGA 4, and ADRR), or long-term (right of the figure—SD, SDdm, MODD, CONGA 24, IQR, and M-value). ADRR, average daily risk range; BG, blood glucose; BG rate, blood glucose rate of change; CONGA, continuous overall net glycemic action; CV, coefficient of variation; GRADE, glycemic risk assessment diabetes equation; HBGI, high blood glucose index; IQR, interquartile range; LBGI, low blood glucose index; LI, lability index; MAGE, mean amplitude of glycemic excursion; MODD, mean of daily difference; M value, mean value; PC, principal component; PCA, principal component analysis; SD, standard deviation; SDb01:00; standard deviation between time points separated by 1 hour; SDdm; standard deviation between daily means; SDw, standard deviation within days.
Loading values which permit to cluster the GV parameters among the five groups are highlighted in bold.
PC, principal component.
Principal component 1 (PC1) was characterized by positive loading values between 0.55 and 1 for all but one parameter (LBGI 0.08). PC2 separated two groups: one with positive loading values ≥0.71 (LBGI and CV, related to hypoglycemia) and the other with negative loading values ≤−0.44, including HBGI, GRADE, and mean BG, reflecting hyperglycemia. PC3 accounted for a small proportion of the total variance but distinguished two groups: one with positive loading values between 0.18 and 0.59, including MODD, CONGA 24, and SDdm, related to between-day fluctuations, the other with negative loading values between −0.29 and −0.50, including CONGA 1, CONGA 2, BG rate, and SDb 01:00 related to very short-term fluctuations. MAGE, CONGA 4, SDw, and ADRR had high loading values (>0.80) on PC1 and low values for the other two components, defining the fifth group.
Discussion
GV is taken into account in metabolic control approaches in patients with diabetes, in addition to HbA1c level and the frequency of hypoglycemia. The aim of this study was to identify the most appropriate GV indicators from those currently available for monitoring children with type 1 diabetes. We hypothesized that, given the methods used to calculate them, several of the GV parameters might reflect the same phenomenon. The first three PCs for the GV phenomenon identified five groups of parameters.
One of the strengths of this study is the use of data extracted from a prospective trial with standardized uploading for a large number of pediatric patients. For each GV parameter calculation, we considered a weekly glycemic data set; this is, close to the previously suggested minimal duration. 35 Furthermore, weeks in which <70% of the expected values were obtained were excluded, to take into account the minimal interval between glycemic data points, which affects the performance of GV metrics. 36
The internal validity of our data set was demonstrated by the distribution of descriptive GV parameters, consistent with expectations for a pediatric population of diabetes patients. 37 Indicators of GV risk revealed poor glycemic control, 14,19 with a high risk of hyperglycemia, 24 consistent with the high mean HbA1c level (8.6%, 70 mmol/mol) of the subjects included in the Start-In! study. Consistent with previous findings, 3,32 there was a moderate-to-strong correlation between descriptive parameters. There was also a correlation between descriptive and risk indicators, despite the mathematical differences between these two types of indicators.
Furthermore, the internal validity of the PCA was high, with almost 86% of the variance of the phenomenon explained, and consistent correlations. PCA was recently used in the context of GV in studies performed on adults with type 138 and type 239 diabetes. We obtained similar results for our pediatric population and obtained additional information by including descriptive parameters of reproducibility.
PCA is a powerful method for the hierarchical clustering of multiple variables, correlated with various extents, to reveal meaningful information. One of the key advantages of PCA is that the overall information is summarized and organized without the need for assumptions concerning the conceptual content of the entire phenomenon. 40 The main limitation of this study concerns the exploratory nature of PCA. Despite the inherent subjectivity of PCA interpretation, our results reveal the existence of three components that seem to be representative of the features of variability. 41,42
The first PC accounted for more than half the variance and was interpreted as the “amplitude” of glycemic excursion, with similar PC1 positive loadings for all parameters except those associated with hypoglycemia (LBGI and CV). Indeed, the amplitude in the direction of hypoglycemia was smaller than that in the direction of hyperglycemia. The second PC was interpreted as the “direction” of the glycemic excursion, as PC2 loadings opposed parameters associated with hypoglycemia (LBGI and CV) and parameters associated with hyperglycemia (mean, median, HBGI, and J-index) or poor control of glycemia (GRADE).
Finally, even though the PCA revealed a two-dimensional structure, a third source component, accounting for 7.3% of the variance, was identified. This component, PC3, could be interpreted as the “timing” of glycemic excursion, as PC3 loadings identified three groups of GV indicators mostly including parameters evaluating the between-day (MODD, CONGA 24, and SDdm), within-day (CONGA 4 and SDw), and shorter term (CONGA 1, CONGA 2, LI, BG-rate, and SDb 01:00) reproducibility of glucose profiles.
Our results specify the information carried by each parameter and show that no single parameter is sufficient on its own to account for the complexity of GV. A combination of five parameters—one from each of the five PCA groups—would be required to represent the three PCs of the GV phenomenon. Thus, if CV can be considered a primary measure of variability, as recently recommended, 43 our results suggest that this metric provides an accurate representation of the GV associated with hypoglycemia, but not of the frequency of fluctuations. The timing of GV would, thus, be better assessed by a parameter from the groups identified by the third component.
In specific clinical situations, a smaller number of GV parameters could be selected, depending on the component considered (hypo- or hyperglycemia; short- or long-term periodicity). For example, GV metrics assessing the direction of the fluctuations could be helpful in subjects sensitive to hypoglycemia such as toddlers and GV metrics assessing timing of the fluctuations preferred in those with irregular lifestyle such as teenagers. On the same way, therapeutic adjustments (basal insulin, carbohydrate counting, bolus ratio, etc.) could be guided by combination of GV parameters representative of hypo- or hyperglycemia, and short- or long-term periodicity, respectively. Further investigations are now required to identify the best parameter(s) in these various clinical situations.
PCA provides a ranking of the phenomenon measured by each parameter, providing information about the clinical relevance of each parameter and guiding the choice of a single parameter per PCA group. Sparse PCA (SPCA) introduces an additional methodological approach to PCA and was previously applied to data sets for adults with type 1 or type 2 diabetes. 38,39 SPCA extracts combinations of smaller number of parameters, without the need for prior assumptions, whereas preserving much of the variance of the original pool of metrics considered. This approach is complementary of our analysis adding information to select the parameters for each PCA group. Indeed, several of the parameters distinguished by the second component in our study were also highlighted by SPCA.
CV has recently been recommended for use in this context, because of its simplicity of calculation, related to the mean and validated threshold values, 43 which are meaningful for physicians and patients. Conversely, LBGI, HBGI, and ADRR have several characteristics of interest: they take into account the non-Gaussian distribution of BG levels, hypo- and hyperglycemic excursions, and validated threshold values, 24 they are promising for integration into closed-loop algorithms 44 and have been validated as clinical outcomes. 25,45 Among the parameters identified by the third component, CONGAn, 27 SD, and derivatives 28 have the advantage of being single metrics indexed to the period of assessment, facilitating automated calculation and, possibly, more meaningful than some other measurements for physicians and patients. The use of other parameters, such as MAGE or MODD, could be considered for the purposes of comparison with previous studies, also there are some limitations for their calculation from CGM data. 2,3,32
The selected parameters will need to be validated as outcomes, independently of HbA1c level and hypoglycemia, before use in clinical practice. The calculation of GV parameters should then be integrated into CGM devices and software to incorporate GV assessment into daily practice and diabetes education.
PCA produced a hierarchy of the plethora of existing indicators, making each parameter easier to understand and more relevant for clinical practitioners and researchers. It showed that the number of parameters could be reduced, although a combination of several parameters appeared to be necessary to represent the three PCs of GV: amplitude, direction, and timing. The parameter used could be selected according to the purpose of the evaluation, in clinical practice or research. This work should lead to further reflections to develop a consensus for the assessment and monitoring of GV in children and adolescents with type 1 diabetes.
Start-In! Study Group
Véronique Sulmont (CHU Reims and CH Annemasse), Anne-Sophie Salmon, Pierre-François Souchon (CHU Reims), Claire Le Tallec (CHU Purpan Toulouse), Régis Coutant, Natacha Bouhours, Sylvie Dufresne, Frederique Gatelais (CHU Angers), Fabienne Dalla-Vale, Denis Morin (CHU Arnaud de Villeneuve Montpellier), Claire Stuckens, Louis Montagne, Marie Dupre, Stéphanie Coopman (CHU Lille), Hélène Bony-Trifunovic, Karine Braun (CHU Amiens), Hélène Crosnier, Claire Personnier (CH Intercommunal de Poissy), François Kurtz (CH Saint-Avold), Jean-Bruno Lobut, Patricia Sierra, Christine Delcroix (CHU Robert Debré APHP), Florentia Kaguelidou, Laurence Corvez, Véronique Berruer, Evelyne Jacqz-Aigrain (Centre d'Investigation Clinique CIC 1426, Inserm, CHU Robert Debré), Adyla Yacoubi, Tania Rilcy, Cécile Hoffart-Jourdain, Akim Souag, Béatrice Andriss, and Damir Mohamed (Unité de recherche Clinique and Direction de la Recherche Clinique et de l'Innovation, APHP).
Footnotes
Authors' Contributions
S.G.C. wrote the article; J.S. and E.S. carried out statistical analysis; and J.C.C., C.A., and N.T.R. contributed to the discussion and revised the article.
Acknowledgments
The Start-In! study was supported by a research grant from the French Health Ministry (PHRC National) and was sponsored by the Département de la Recherche et du Développement, APHP (AOM 07054). For this ancillary study, S.G.C. received financial support from Aide aux Jeunes Diabétiques (AJD), the Association Française des Diabétiques (AFD), and the Société Française d'Endocrinologie et Diabétologie Pédiatriques (SFEDP). The authors would like to thank Alex Edelman & Associates for editorial assistance.
Author Disclosure Statement
No competing financial interest exist.
Correlation of glucose variability indices in 142 pediatric patients with type 1 diabetes
References
Supplementary Material
Please find the following supplemental material available below.
For Open Access articles published under a Creative Commons License, all supplemental material carries the same license as the article it is associated with.
For non-Open Access articles published, all supplemental material carries a non-exclusive license, and permission requests for re-use of supplemental material or any part of supplemental material shall be sent directly to the copyright owner as specified in the copyright notice associated with the article.