
Abstract
Objective:
We sought to cross validate several metrics for quality of glycemic control, hypoglycemia, and hyperglycemia.
Research Design and Methods:
We analyzed the mathematical properties of several metrics for overall glycemic control, and for hypo- and hyperglycemia, to evaluate their similarities, differences, and interrelationships. We used linear regression to describe interrelationships and examined correlations between metrics within three conceptual groups.
Results:
There were consistently high correlations between %Time in range (%TIR) and previously described risk indices (M 100 , Blood Glucose Risk Index [BGRI], Glycemic Risk Assessment Diabetes Equation [GRADE], Index of Glycemic Control [IGC]), and with J-Index (J). There were also high correlations among %Hypoglycemia, Low Blood Glucose Index (LBGI), percentage of GRADE attributable to hypoglycemia (GRADE %Hypoglycemia ), and Hypoglycemia Index, but negligible correlation with J. There were high correlations of percentage of time in hyperglycemic range (%Hyperglycemia) with High Blood Glucose Index (HBGI), percentage of GRADE attributable to hyperglycemia (GRADE %Hyperglycemia ), Hyperglycemia Index, and J. %TIR is highly negatively correlated with %Hyperglycemia but very weakly correlated with %Hypoglycemia. By adjusting the parameters used in IGC, Hypoglycemia Index, Hyperglycemia Index, or in M R , one can more closely approximate the properties of BGRI, LBGI, or HBGI, and of GRADE, GRADE %Hypoglycemia , or GRADE %Hyperglycemia .
Conclusions:
Simple readily understandable criteria such as %TIR, %Hypoglycemia, and %Hyperglycemia are highly correlated with and appear to be as informative as “risk indices.” The J-Index is sensitive to hyperglycemia but insensitive to hypoglycemia.
Introduction
N
“Risk index”.
%CV, %Coefficient of variation; %Hyperglycemia, percentage of time in hyperglycemic range; %TIR, %Time in Range; AUC, area under the curve; BGRI, Blood Glucose Risk Index; GRADE, Glycemic Risk Assessment Diabetes Equation; GRADE Hyperglycemia , component of GRADE attributable to hyperglycemia; GRADE %Hyperglycemia , percentage of GRADE attributable to hyperglycemia; GRADE Hypoglycemia , component of GRADE attributable to hypoglycemia; GRADE %Hypoglycemia , percentage of GRADE attributable to hypoglycemia; GVP, Glycemic Variability Percentage; HBGI, High Blood Glucose Index; IGC, Index of Glycemic Control; J, J-Index; LBGI, Low Blood Glucose Index; LLTR, lower limit of target range; MAG, mean absolute glucose change per unit time; MODD, Mean of Daily Differences at exactly the same time of day; SD, standard deviation; tHyperglycemia , time in hyperglycemic range; tHypoglycemia , time in hypoglycemic range; tTarget , time in target range; ULTR, upper limit of target range.
There are theoretical advantages to criteria based on “risk indices” that assign larger penalty scores to glucose levels falling progressively further away from the target range. 2 –22 These include M R , Blood Glucose Risk Index (BGRI), glycemic risk assessment diabetes equation (GRADE), and Index of Glycemic Control (IGC). Each of the “risk indices” include two components corresponding to hypo- and hyperglycemia (cf. Box 1):
This study was undertaken to evaluate relationships among these criteria both theoretically (by examining the relationships of penalty scores based on the risk indices to glucose levels) and empirically (examining correlations among the criteria utilizing data from previously reported studies of CGM) in people with type 1 and type 2 diabetes.
Research Design and Methods
Comparison of alternative approaches with scoring systems: We first compared the relationships between penalty scores and glucose levels using the mathematical definitions of %TIR, M
R
, BGRI, GRADE, and IGC. We also examined the effects of adjusting parameters in M
R
and IGC (cf. Supplementary Figs. S2 and S3; Supplementary Data are available at
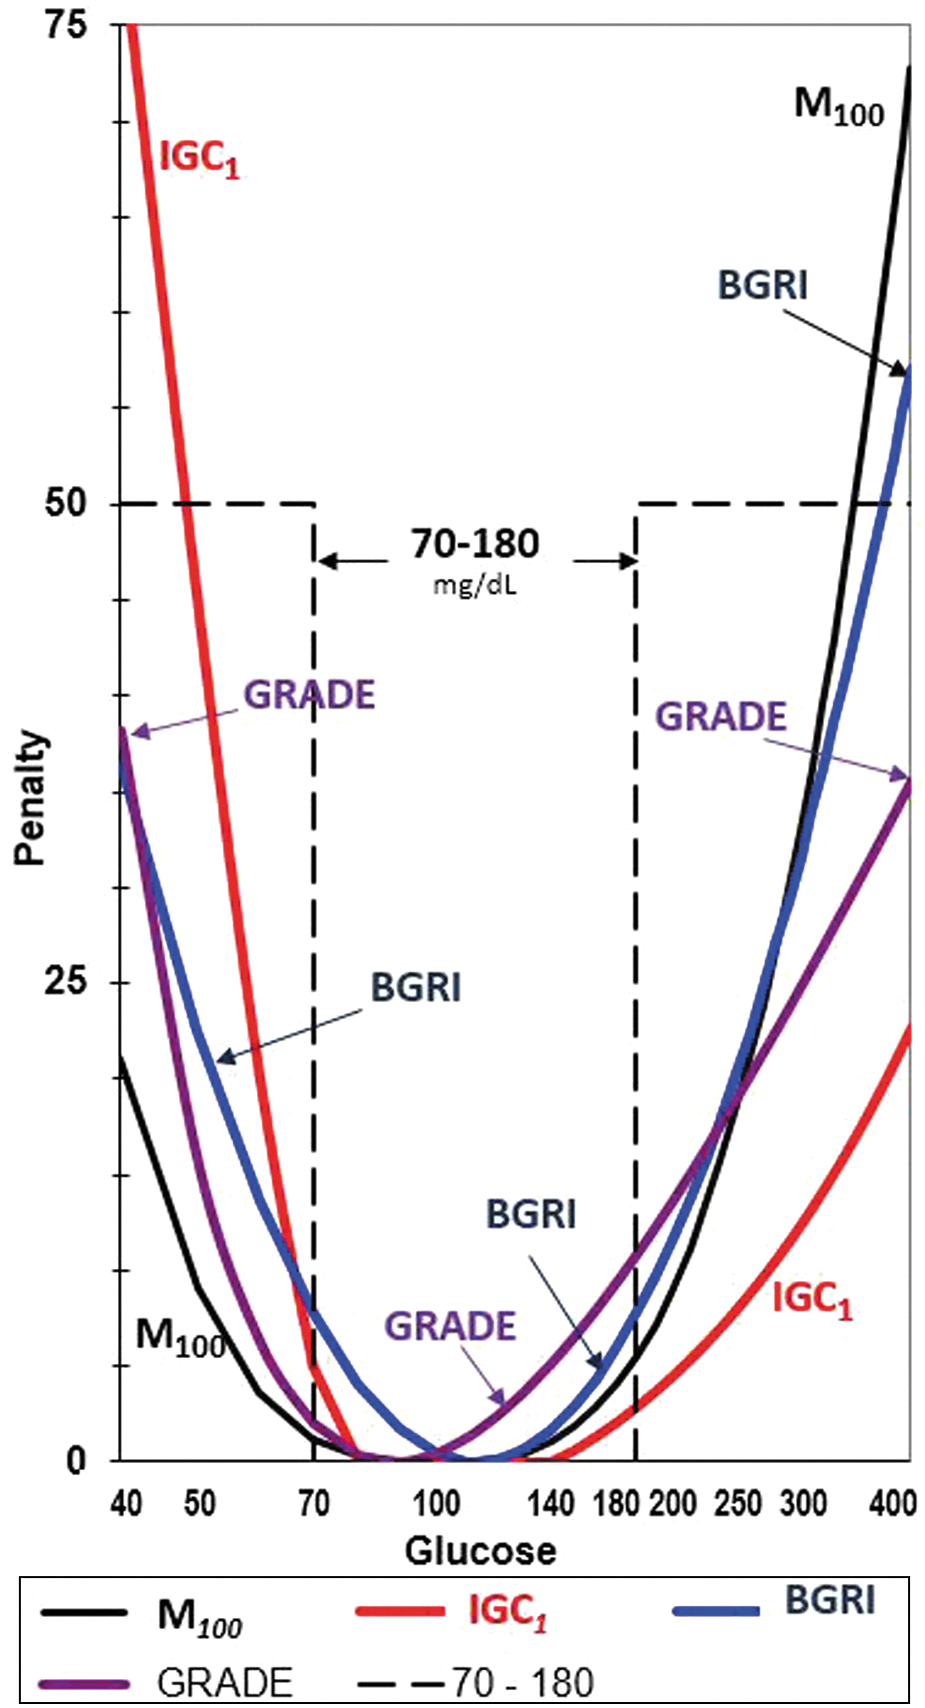
Criteria to evaluate quality of glucose using a penalty score for each glucose value. Horizontal axis: Glucose level (mg/dL) on a logarithmic scale. Vertical Axis: Penalty score or transformation assigned to glucose levels: %TIR (using a target range of 70–180 mg/dL) (black dashed line); Schlichtkrull M R value using R = 100 mg/dL (black curve); BGRI 4,5 (blue), GRADE 6 –8 (purple), and IGC 1 9 –12 with parameters: LLTR = 80 mg/dL, ULTR = 140 mg/dL, a = 1.1, b = 2.0 (red/orange). Constant scaling factors are used for M 100 , GRADE, and IGC 1 , Hypoglycemia Index and Hyperglycemia Index. %TIR, %Time in Range; BGRI, Blood Glucose Risk Index; GRADE, glycemic risk assessment diabetes equation; IGC, Index of Glycemic Control; LLTR, lower limit of target range; ULTR, upper limit of target range.
Regression and correlation analysis
We examined the relationship between %TIR as an independent variable and M 100 , BGRI, GRADE, and IGC 1 as dependent variables using least squares linear regression utilizing the data of Refs. 44 –46 We next examined the correlations among several measures of overall quality of glycemic control, hypoglycemia, or hyperglycemia for subjects with type 1 or type 2 diabetes, using results reported by Fabris et al. 47,48 and others. 44 –46,49,50 The number of subjects, duration of the CGM study, type of CGM sensor used, and further details are summarized in Supplementary Materials (Supplementary Table S1).
Results
Analysis of Penalty Scoring Systems: Figure 1 shows the penalty scores assigned to each glucose level by several metrics of glycemic control: %TIR, M
100
, BGRI, GRADE, and IGC
1
. One can compare the scoring systems in terms of their relative magnitude of penalties for extremes of hypo- and hyperglycemia (e.g., 40 and 400 mg/dL), in terms of the pairs of glucose levels in the hypo- and hyperglycemic ranges with identical penalty scores, and in terms of the rates at which penalties increase as glucose levels fall progressively further above or below the target range or a specified target level. By adjusting the limits of the target range, or by considering multiple ranges, one can change the properties of %TIR and related indices (cf. Supplementary Fig. S1 for an example of a multistep penalty). By adjusting the parameter (R) for M
R
, one can systematically alter the relative influence of glucose values falling in the hypo- and hyperglycemic ranges (cf. Supplementary Fig. S2). By adjusting parameters for IGC, one can more closely approximate the penalty functions corresponding to M
R
, BGRI, or GRADE (cf. Supplementary Fig. S3). In principle, one could use the left-hand limb of the curve for M
It is not possible to construct the corresponding curves for penalty scores vs. glucose level for metrics that are based on derived statistics (e.g., mean glucose, standard deviation [SD], %Coefficient of variation, or area under the curves [AUCs] for hypo- or hyperglycemia) rather than on a summation of penalties for each of the individual glucose values. This applies to the J-index (J), 15,16 the Q-Score, 29 glucose pentagon, 30,31 comprehensive glucose pentagon, 32,33 composite metrics such as the ones involving A1C, hypoglycemia and weight, 34 Personal Glycemic State (PGS), 35 and Multiple Scale Entropy (MSE) 36 (Table 1).
Regression analysis
The relationships between %Time in Range (%TIR) and five metrics for quality of glycemic control (M 100 , BGRI, GRADE, IGC 1 , and J) are shown in Figure 2 using data of Refs. 44 –46 There are linear relationships between %TIR and all five metrics. As %TIR approaches 100%, M 100 , BGRI, GRADE, IGC 1 , and J approach 0. This observation suggested the possibility that simple indices such as %TIR (or the time in target range, tTarget ), %Hypoglycemia, (or time in hypoglycemic range, tHypoglycemia ) and %Hyperglycemia (or time in hyperglycemic range, tHyperglycemia ) might be as informative as the “risk index” criteria (Box 1, Fig. 1, Table 1) for overall control (M R , BGRI, GRADE, and IGC), for hypoglycemia (Low Blood Glucose Index [LBGI], GRADE, percentage attributable to hypoglycemia [GRADE %Hypoglycemia ], and Hypoglycemia Index), and for hyperglycemia (High Blood Glucose Index [HBGI], GRADE, percentage attributable to hyperglycemia [GRADE %Hyperglycemia ], and Hyperglycemia Index).

Relationships of %TIR (horizontal axis) with IGC (solid circles), J (open squares), M
100
(solid triangles), GRADE (solid diamonds), and BGRI (open triangles) (from above downward), using CGM data from a 2-week period.
44
–46
There is a highly significant correlation and nearly linear relationship for all five metrics. All five linear regression lines approach 0 as %TIR approaches 100%. Linear scaling factors were used for GRADE, IGC
Correlation analysis
The 35 pairwise correlations among 13 metrics are summarized in Table 2 –4 for 5 measures of overall glycemic control, 4 measures of hypoglycemia, and 5 measures of hyperglycemia, respectively, using the values reported by Rodbard et al., 44 –46 Fabris et al., and El-Laboudi et al. 49,47,48 Additional correlations are available from Beck et al. 50
From above downward each cell shows the correlations between two metrics, based on (1) T1D two data sets 47 ; (2) T1D data set 147; (3) T1D data set 247; (4) T2D 48 ; (5) Mean for T1D and T2D rows 1 and 447,48; (6) T1D, T2D from Refs. 44 –46 ; (7) T1D from Ref. 49
%TIR, %Time in Range; CSII; T1D, type 1 diabetes; T2D, type 2 diabetes.
From above downward each cell shows the correlations between two metrics, based on (1) T1D two data sets 47 ; (2) T1D data set 147; (3) T1D data set 247; (4) T2D 48 ; (5) Mean for T1D and T2D rows 1 and 447,48; (6) T1D, T2D from Refs. 44 –46 ; (7) T1D from Ref. 49
There is an extremely high correlation among %Hypoglycemia, LBGI, GRADE %Hypoglycemia , a lower correlation of these four metrics with Hypoglycemia Index, and a negligible correlation with J.
From above downward each cell shows the correlations between two metrics, based on (1) T1D two data sets 47 ; (2) T1D data set 147; (3) T1D data set 247; (4) T2D 48 ; (5) Mean for T1D and T2D rows 1 and 447,48; (6) T1D, T2D from Refs. 44 –46 ; (7) T1D from Ref. 49
There is an extremely high correlation among all five of these metrics.
Discussion
Metrics for quality of glycemic control, hypoglycemia, and hyperglycemia
This study indicates the high degree of internal consistency and correlation of several measures of quality of glycemic control, measures of hypoglycemia, and measures of hyperglycemia. The correlations are so high that it can be regarded as validating the use of the “times in ranges:” %TIR, %Hypoglycemia, and %Hyperglycemia, or the corresponding metrics in terms of minutes or hours per day (tTarget, tHypoglycemia, and tHyperglycemia ). Beck et al. 23 have previously used a similar type of correlation analysis to evaluate several plausible metrics for hypoglycemia. They also found that %Hypoglycemia was highly correlated with LBGI, and with the number, duration, and AUC of hypoglycemia events using different thresholds.
%TIR has the theoretical limitation that it assigns the same penalty score to a glucose of 40 or 69 mg/dL when using a threshold of 70 mg/dL, and similarly, the same penalty score to glucose values of 181 or 401 mg/dL when using a threshold for hyperglycemia of 180 mg/dL (cf. Supplementary Fig. S1). Classification of glucose levels into only three categories would be expected to lose information compared with use of a smooth mathematical function such as M R , BGRI, GRADE, or IGC (Fig. 1). 10,11,17 –20 It will be important to extend this study to examine additional data sets. This might provide an opportunity to evaluate several options for limits for the target range (Lower Limit of Target Range [LLTR], Upper Limit of Target Range) and other parameters.
Use of multiple categories for glucose
Several workers 1,25 –27 have utilized multiple discrete categories for glucose levels. One way to enhance the step-function approach underlying %TIR would be to use several discrete steps in the penalty score for several glucose categories (e.g., <40, 40–54, 55–70, 70–140, 140–180, 180–250, 250–400, and >400 mg/dL) (cf. Supplementary Fig. S1). Considerations of this kind of multistep relationship between penalty and glucose level provided part of the original motivation for development of IGC 9,10 and perhaps other metrics as well. Curve smoothing is commonly used to avoid abrupt transitions at the thresholds in the multistep relationship (Supplementary Fig. S1).
We may ask how can use of just three categories for glucose provide results that are so highly correlated with use of a smooth continuous penalty function? We suggest a few possible explanations. First, the percentage of glucose values in the hypoglycemic range (e.g., <70 mg/dL [3.9 mmol/L]) is small. Second, the measurement error in glucose values in the hypoglycemic range (mean absolute relative difference [%MARD]) is considerably larger than in the target range and hyperglycemic range. This introduces considerable error, which is magnified by the penalty function in the hypoglycemic range (Fig. 1), thus negating some of the advantages of the smooth continuous function. A third possible explanation is that many people with diabetes have a similar shape of the glucose distribution, as postulated in the initial development of LBGI and HBGI, such that a trifurcation of the distribution also provides a reliable way to characterize the distribution.
Adjustability of parameters for IGC and M R
Both GRADE and BGRI, and their scales for hypo- and hypoglycemia, use fixed parameters. In contrast, M R and IGC were intended to be flexible with adjustable parameters. Adjustment of parameters can change the relative influence of hypo- and hyperglycemia (Supplementary Figs. S2 and S3). It is likely that the smaller correlations observed for IGC 1 , Hypoglycemia Index, and Hyperglycemia Index with the other risk indices (Table 2 –4) were due to a greater, possibly excessive, emphasis on the hypoglycemic range, combined with the much larger errors (%MARD) for glucose measurements in the hypoglycemic range. Thus, adjustment of parameters (e.g., changing b from 2.0 to 1.8, with or without adjustment of LLTR) can be expected to improve the correlations of IGC with %TIR, BGRI, GRADE, and J. (cf. Table 2 and Supplementary Fig. S3). Likewise, this will improve the correlations for Hypoglycemia Index and Hyperglycemia Index (Tables 3 and 4).
Schlichtkrull M R
The M R value was originally intended as a metric for overall quality of glycemic control. However, one could use the left-hand limb of the curve when glucose < R (Fig. 1, Supplementary Fig. S2) as a metric for hypoglycemia, and the right hand limb of the curve when glucose > R (Fig. 1, Supplementary Fig. S2) as a metric for hyperglycemia. These would be analogous to the other risk indices for hypoglycemia and hyperglycemia (cf. Box 1).
Glycemic Risk Assessment Diabetes Equation
GRADE shows consistently higher correlations with %Hyperglycemia, HBGI, J, Hyperglycemia Index, and mean glucose than does GRADE
%Hyperglycemi
J-Index
Correlations of J with the four measures of hyperglycemia examined here (Table 4) are high, consistent with J serving as a measure of hyperglycemia. The J-Index is also an excellent parameter for overall level of control (Table 2), consistent with the original intent for this metric,
14,15
but only when a small percentage of glucose values fall in the hypoglycemic range. However, J is not suitable as a measure of hypoglycemia in view of its very poor correlation with four measures of hypoglycemia (Table 3). These observations follow directly from the definition of J:
where mean and SD of glucose are expressed in mg/dL. The consistently observed positive correlation of glucose variability (SD) with mean glucose 43 implies that J will remain small when the glucose level is low, even in the presence of marked hypoglycemia.
%TIR versus %Hyperglycemia or %Hypoglycemia
The %TIR is highly (negatively) inversely correlated with time in hyperglycemia (Table 5), but has minimal correlation with %Hypoglycemia. 44 –49 Thus, %TIR can be regarded as a proxy for %Hyperglycemia or tHyperglycemia .
From above downward each cell shows the correlations between two metrics, based on (1) T1D two data sets 47 ; (2) T1D data set 147; (3) T1D data set 247; (4) T2D 48 ; (5) Mean for T1D and T2D rows 1 and 447,48; (6) T1D, T2D from Refs. 44 –46 ; (7) T1D from Ref. 49
There is a very negative correlation (average r = −0.975) between %TIR and %Hyperglycemia. %TIR, %Time in Range.
Comparing efficacy and safety of therapeutic interventions
In addition to evaluating correlations among alternative criteria, it would be important to evaluate the sensitivity and specificity for hypothesis testing for different criteria when evaluating efficacy and safety (hypoglycemia) for alternative forms of therapy in randomized trials comparing two or more interventions using either crossover designs (comparisons within individuals) or parallel design (comparisons between individuals). Kovatchev and Inzucchi suggested that risk indices were more sensitive than use of mean glucose, SD, MAGE, or mean absolute glucose change per unit time (MAG) when evaluating effects of alternative therapies on glycemic variability, 21,22 but did not report a direct comparison of risk indices with time in ranges. This type of analysis was not included in the present study. There is a need to examine not only the correlations (between subjects) but also the standard errors of the changes in metrics attributable to changes in therapy, both within and between individuals. Evaluation of efficacy and safety in this manner could also be applied to several other criteria that have been proposed, such as Q-Score, 29 Comprehensive Glycemic Pentagon (CGP), 32,33 PGS, 35 MSE, 39 among others.
Use of z scores and percentiles
When combining results from two or more criteria, one can use z scores, as used in the Q-Score, 29 to provide an empirical approach to weighting of the different criteria. 29 Alternatively, one can use an average of percentile scores, as in an Index of Glycemic Variability combining several aspects of variability. 43,51
Potential applicability to SMBG
This study has utilized CGM data. In principle, the same kinds of analyses can be applied to Self-Monitoring of Blood Glucose (SMBG) data. Fabris et al. 52 reported an excellent correlation of risk indices based on SMBG and CGM data.
A two-dimensional (bivariate) approach
Given that there are at least two different aspects or facets of glycemic control, it may be impossible to use a single metric unless one assigns arbitrary weights to each factor. One approach is to use a two-dimensional approach: a metric for hypoglycemia (e.g., %Hypoglycemia or LBGI) is displayed on the vertical axis vs. mean glucose or A1C on the horizontal axis. Alternatively, one can examine change in A1C and change in mean glucose after an intervention. 25,53 Another approach is to combine five parameters, as in the Q Score, 29 comprehensive glucose pentagon, 32 or PGS, 35 and other composite metrics. It remains to be seen what is the smallest number of metrics that need to be included to optimize sensitivity and specificity for testing hypotheses regarding efficacy and safety of alternative therapies, devices, and algorithms.
Conclusions
Times in Target, hypoglycemic, and hyperglycemic ranges have been validated by virtue of their high correlations with several metrics of overall glycemic control, hypo-, and hyperglycemia. Time in target range, Schlichtkrull M 100 values, BGRI, GRADE, and J are very highly correlated. Four metrics for hypoglycemia and five for hyperglycemia are highly correlated among themselves. The correlations are so high that it is unlikely that risk indices can provide substantially more information, sensitivity, or specificity for hypothesis testing in clinical trials. IGC 1 , Hypoglycemia Index, and Hyperglycemia Index show lower correlations than other metrics, but these correlations can be increased by adjustments of the parameters used in these indices.
Funding
There was no funding for this study.
Footnotes
Author Disclosure Statement
No competing financial interests exist.
References
Supplementary Material
Please find the following supplemental material available below.
For Open Access articles published under a Creative Commons License, all supplemental material carries the same license as the article it is associated with.
For non-Open Access articles published, all supplemental material carries a non-exclusive license, and permission requests for re-use of supplemental material or any part of supplemental material shall be sent directly to the copyright owner as specified in the copyright notice associated with the article.