




Abstract
Objective:
To determine the minimum sample of continuous glucose monitoring (CGM) data needed to accurately reflect 3 months of glycemic control.
Research Design and Methods:
Three months of CGM data were collected on 257 individuals (age 10–78 years) with type 1 diabetes in two studies (one using the Abbott FreeStyle Libre Pro™ and the other using the Dexcom™ G4). Correlations were calculated between the full 3 months and incremental sampling periods of CGM data.
Results:
Correlation to the full 3 months of data improved with an increasing number of days of data collection, plateauing by about 14 days, with an R 2 value of 0.84–0.86 for mean glucose, time at 70–180 mg/dL, and time >180 mg/dL, with lower values for time <70 mg/dL (0.76) and coefficient of variation (0.70).
Conclusions:
Fourteen days of CGM data provide a good estimation of glucose metrics for a 3-month period.
I
A prior study 1 demonstrated that 12–15 days of CGM data in type 1 diabetes (T1D) are needed to obtain an accurate assessment of glucose control for 3 months and to estimate HbA1c from mean glucose. Since that study utilized older generation CGM sensors, we conducted a similar analysis of CGM data collected from two studies utilizing contemporary CGM devices—the Abbott FreeStyle Libre Pro™ Glucose Monitoring System (Abbott Diabetes Care, Inc., Alameda, CA) and the Dexcom™ G4 Platinum CGM System® with software 505 (Dexcom, Inc., San Diego, CA).
Research Design and Methods
The methods and results of the two studies for which data were utilized in the analyses have been published. Study A (n = 208 individuals ≥8 years of age) was an observational study in which blinded CGM (Abbott Libre Pro; no calibration needed) data were collected over a 3-month period from T1D participants with a wide range of glycemic control to assess differences in the HbA1c versus CGM-based mean glucose relationship between blacks and whites. 2 Study B was a 6-month randomized trial (n = 226 individuals with T1D ≥18 years of age) comparing unblinded CGM (Dexcom G4; protocol required two calibrations/day) used with and without blood glucose meter confirmation before dosing insulin. 3 In both studies, HbA1c was measured at 3 months in the Northwest Lipid Research Laboratories, University of Washington, Seattle, WA using the nonporous ion-exchange high-performance chromatography (TOSOH, Biosciences, Inc., South San Francisco, CA).
To ensure an adequate amount of CGM data would be available for the study objectives, analyses only included data from study participants with at least a minimum amount of CGM data (requirements listed in Supplementary Table S1; see Supplementary Data at
As a recent comparison of the two CGM systems confirmed their comparability, 4 analyses were performed with data from studies A and B pooled; separate analyses for each study also were performed. For each participant, several CGM metrics were computed separately for the full 3-month period and restricting to data from 30 time periods (referred to as “sampling periods”) representing 1–30 days of data immediately before the 3-month HbA1c measurement. The following CGM metrics were analyzed: (1) mean sensor glucose concentration, (2) percentage of time in the target range of 70–180 mg/dL, (3) percentage of time in the hyperglycemic range (>180 and >250 mg/dL), (4) percentage of time in the hypoglycemic range (<70 and <54 mg/dL), and (5) coefficient of variation (CV; standard deviation [SD] divided by mean glucose). For each CGM metric, the association between the value from each sampling period and the value using all 3 months of data was determined using the squared value of the Spearman correlation coefficient (R 2). This represents the proportion of the total variance explained by the sample. In addition, for each CGM metric, the median absolute difference (AD) was calculated as well as the percentage of sampled values within a prespecified threshold of the 3-month values (±10 mg/dL for mean glucose, ±10% for time in range and hyperglycemia, ±2% for hypoglycemia, and ±5% for CV).
R 2 values were also calculated for each glucose metric comparing two other 14-day periods (57–70 days and 29–42 days before the 3-month HbA1c measurement) separately with the full 3-month period.
In addition, for each sampling period, R 2 was computed to assess the association between the mean glucose and the 3-month HbA1c value. This analysis was repeated using the two additional 14-day periods previously described, and all analyses were performed with SAS software, version 9.4 (SAS Institute, Cary, NC).
Results
The 257 subjects in this analysis were 43 ± 16 (mean ± SD) years of age (range 10–78 years), mean diabetes duration was 23 ± 13 years, and mean HbA1c was 7.3 ± 1.1%; 83% were non-Hispanic white and 54% female (Supplementary Table S2).
As expected, the correlations between the full 3 months and the 1- to 30-day sampling periods improved with increasing days of CGM data, reaching a plateau at around 14 days before the 3-month HbA1c reading (Fig. 1; Supplementary Table S3). At 14 days, the R 2 values were 0.84 for mean glucose, 0.86 for time 70–180 mg/dL, 0.84 for time >180 mg/dL, 0.85 for time >250 mg/dL, 0.76 for time <70 mg/dL, 0.68 for time <54 mg/dL, and 0.70 for CV. In addition, the median AD decreased with additional days of CGM data and the percent of time the AD was within the prespecified threshold (see Research Design and Methods section) increased with additional days of CGM data, again plateauing at around 14 days (Supplementary Table S5). Results were similar when evaluating study A and study B separately (Supplementary Tables S4 and S5). R 2 values were similar to the main analysis comparing the additional 14-day periods (see Research Design and Methods) with the full values (Supplementary Table S6).
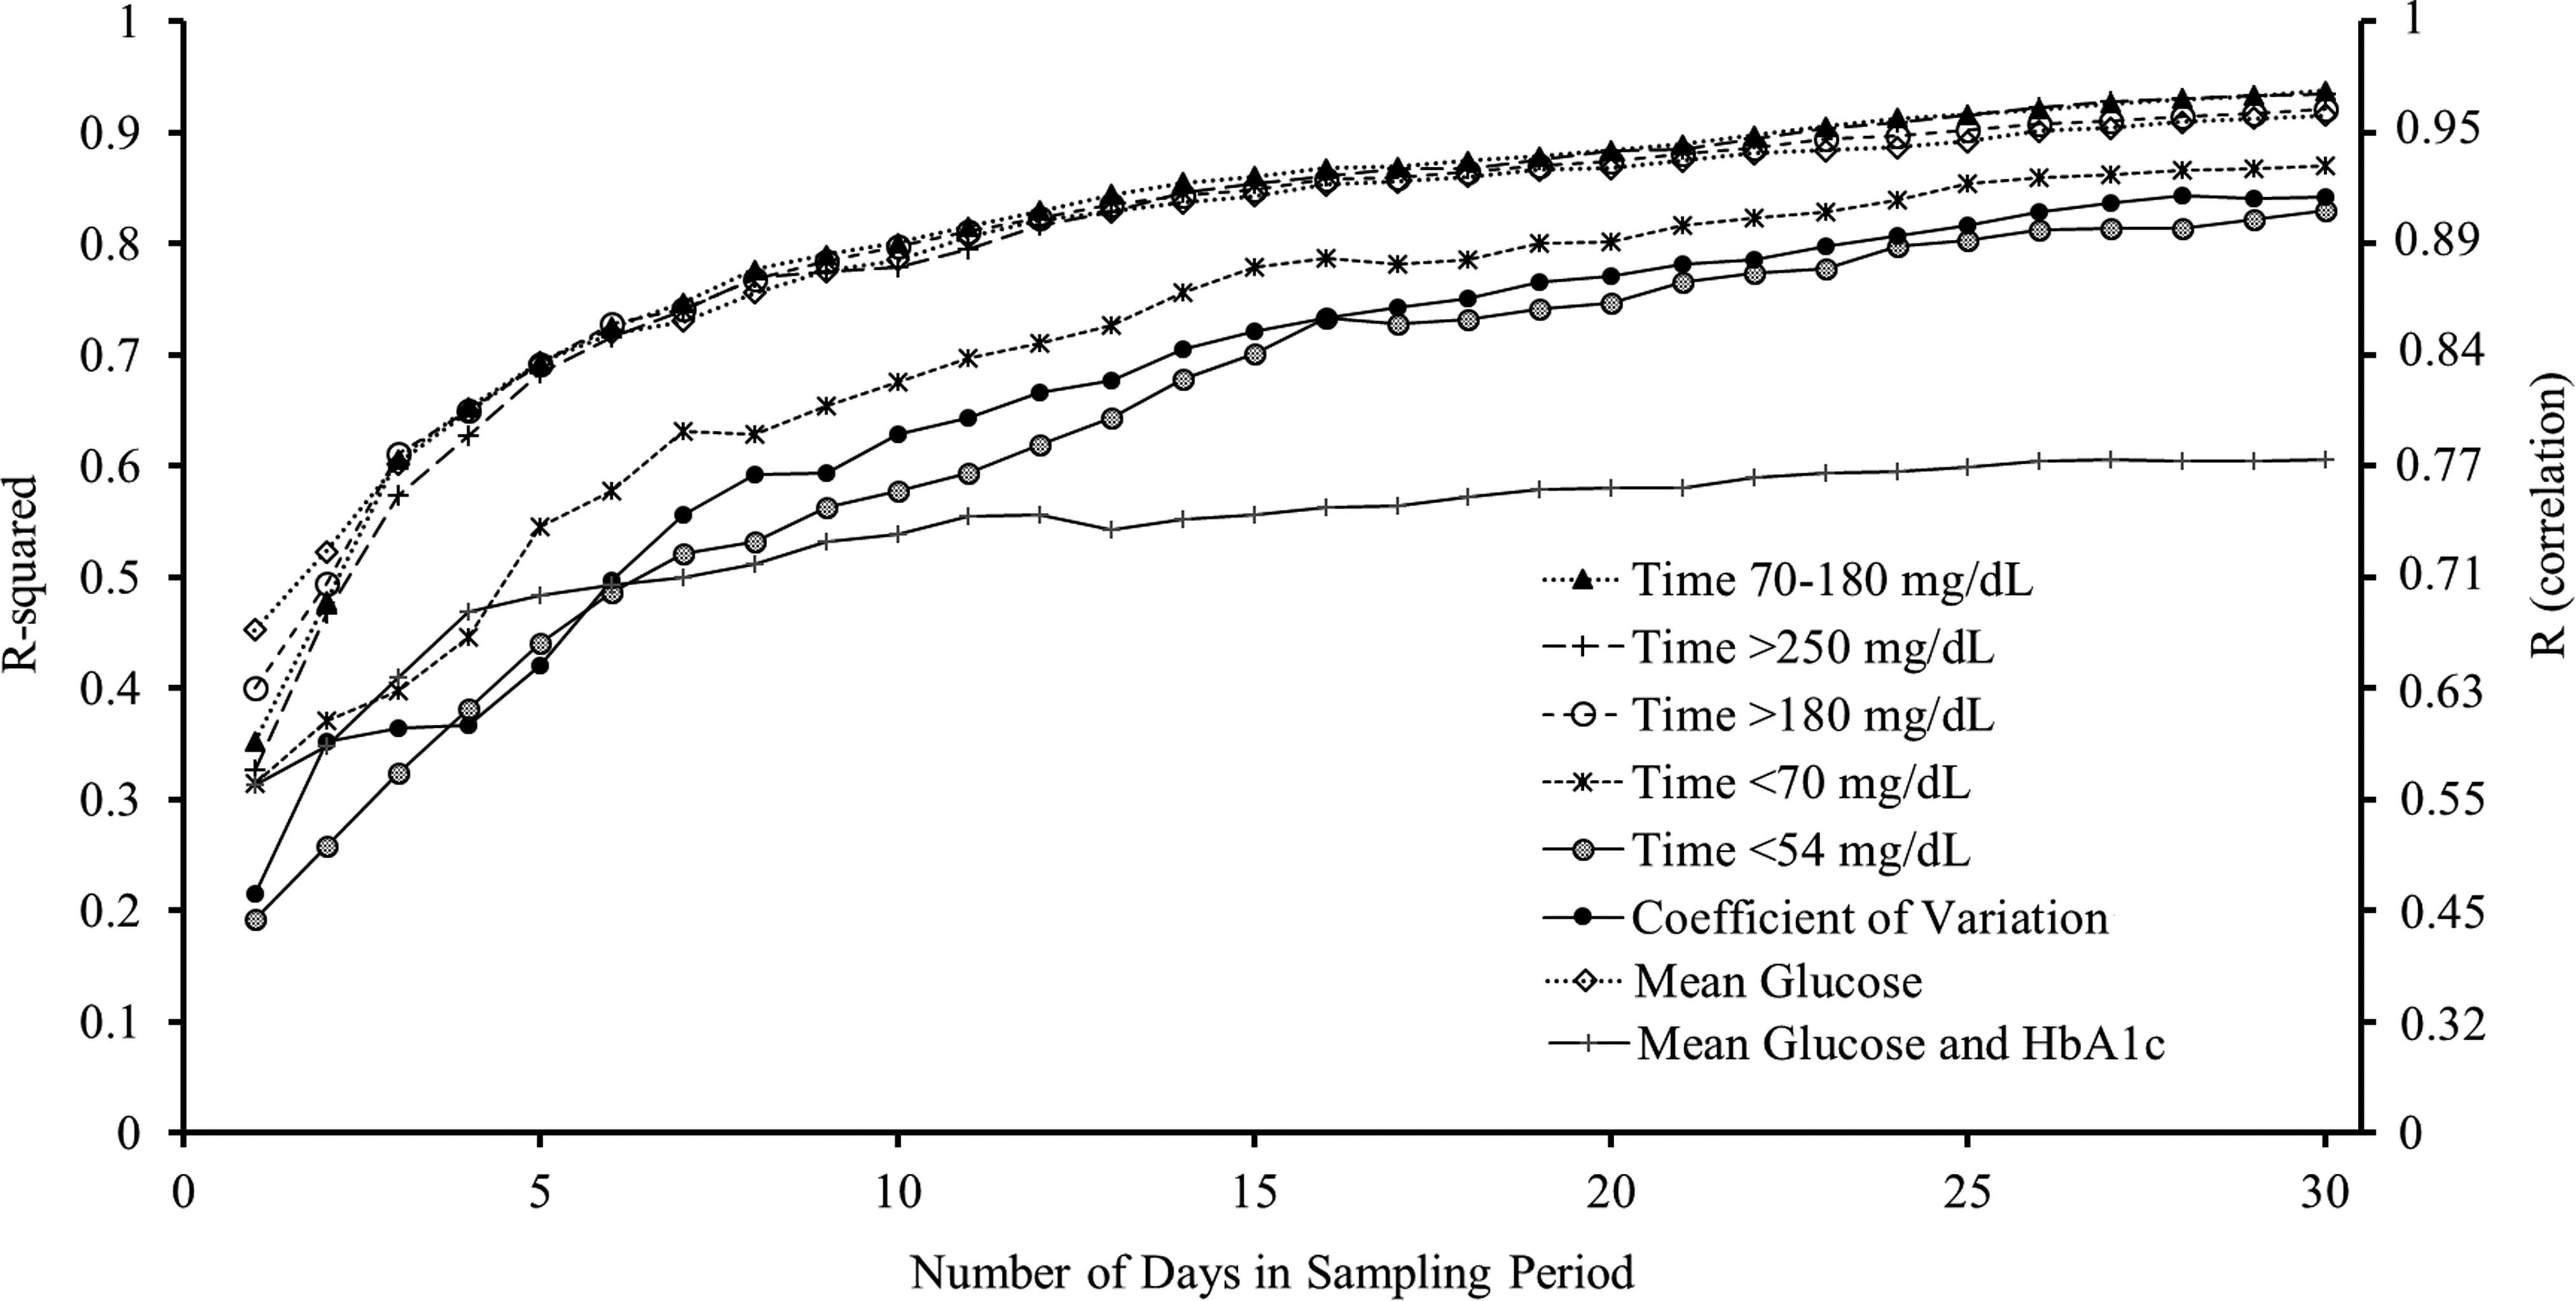
Correlation (R 2 and R) for CGM glucose metrics with the full 3-month values. Figure gives correlation values between CGM data over the sampled period and the average over the entire 3 months for common glucose metrics and gives correlation values between the 3-month HbA1c value and the mean glucose measured from the CGM data over the sampling periods. The Y-axis provides the R 2 values on the left and R values on the right. CGM, continuous glucose monitoring; HbA1c, hemoglobin A1c.
The R 2 value for HbA1c and mean glucose determined from the full 3 months of data was 0.58. This level was nearly reached within 14 days of CGM data (R 2 = 0.55; Supplementary Table S3). The association between the mean glucose and the 3-month HbA1c was stronger when using the 14 days immediately before the 3-month HbA1c reading versus the alternative 14-day periods described in the methods (R 2 = 0.55 vs. 0.43 and 0.48, respectively; Supplementary Table S6).
Conclusions
Our results indicate that 14 days of CGM data correlate well with 3 months of CGM data and additional days of data do not substantially increase this correlation, particularly for mean glucose, time in range, and hyperglycemia metrics. When the number of days sampled is doubled from 14 to 30, the gain in the R 2 value is relatively small (∼0.08 for mean glucose, time in range, and hyperglycemia metrics). For hypoglycemia and glucose variability metrics, the correlation of 14 days of data with 3 months is lower than it is with the other metrics, but still fails to improve substantially with longer sampling periods. These findings are consistent with the prior study of Xing et al., 1 which utilized older, less accurate CGM sensors.
We also found that sampling additional days beyond the last 14 days of CGM data does not substantially increase the correlation of HbA1c and mean glucose. Our findings suggest that estimating HbA1c from CGM-measured mean glucose can be done within 14 days and additional CGM data does not add much to this estimation, provided that there have not been recent meaningful changes in diabetes management or other sustained factors affecting glycemic control. However, it is important to recognize that there is considerable interindividual variation in the mean glucose-HbA1c relationship, 5 as evidenced by the R 2 only being 0.58 when mean glucose was computed using the full 3 months of CGM data. A limited number of studies have assessed the correlation between CGM-measured mean glucose and HbA1c as was done in the present study. Duran-Valdez et al. 6 reported a much lower correlation than we found likely related to their use of only 3–5 days of CGM data.
CGM is becoming ubiquitous in diabetes care, and provides information about glycemic control that significantly augments the measurement of HbA1c in assessing outcomes in clinical trials and for retrospective review to inform decisions about adjustments to diabetes management. Our results demonstrate that 10–14 days of CGM data generally are sufficient for these purposes.
Footnotes
Acknowledgments
Study funding was provided by the Helmsley Charitable Trust. This research was supported by a grant of no charge materials from Abbott Laboratories and Dexcom, Inc. Abbott Diabetes Care and Dexcom, Inc. provided the continuous glucose monitors used in these studies.
Authors' Contributions
All authors: study concept and design, acquisition of subjects and data, analysis and interpretation of data, and preparation of article. All authors have seen and approved the final version of this article.
Sponsor's Role
The sponsor had no role in the design, methods, data collection, analysis, or preparation of this article.
Author Disclosure Statement
No competing financial interests exist.
References
Supplementary Material
Please find the following supplemental material available below.
For Open Access articles published under a Creative Commons License, all supplemental material carries the same license as the article it is associated with.
For non-Open Access articles published, all supplemental material carries a non-exclusive license, and permission requests for re-use of supplemental material or any part of supplemental material shall be sent directly to the copyright owner as specified in the copyright notice associated with the article.
