
Abstract
Background:
Obesity is a risk factor for gestational diabetes (gestational diabetes). Low-glycemic index diets attenuate hyperglycemia. We designed a study to determine whether a slow-digesting, low-glycemic load (SD-LGL) beverage improves glucose tolerance in obese pregnant women without GDM.
Methods:
This was a 3-arm comparison study comparing the effects of an SD-LGL nutritional beverage (glycemic load [GL] 730), an isocaloric control beverage (GL 1124), and habitual diet on glycemia in obese pregnant women. Sixteen women (mean body mass index 37 kg/m2) were recruited at 24–28 weeks to receive either the SD-LGL or eucaloric control beverage. This was consumed with breakfast and as a midafternoon snack over 2 days with a controlled diet. Following a 2-day washout period of habitual diet, women completed 2 days on the alternative beverage with controlled diet. A 10-h fast preceded each intervention phase. Twenty-four hour glucose was measured using continuous glucose monitoring.
Results:
Consumption of the lower GL beverage was associated with improved measures of glycemia, compared with the control beverage and habitual diet at different time periods. Glucose estimates for control versus SD-LDL at 24 h (0.23 mmol/L [0.16 to 0.31], P < 0.001), daytime (0.26 mmol/L [0.18 to 0.34], P < 0.001), and nighttime (0.05 mmol/L [−0.01 to 0.11], P = 0.09). Postprandial glucose was lower after breakfast but not after dinner, compared with the control beverage (0.09 mmol/L [0.01 to 0.18], P = 0.03).
Conclusion:
A slow-digesting, low-glycemic nutritional beverage may facilitate improved glucose control in obese pregnant women. To address potential benefit for clinical outcomes, a randomized controlled trial is warranted.
Introduction
O
Rising rates of obesity combined with lower glucose thresholds for diagnosis of GDM, as recommended by the International Association of Diabetes Pregnancy Study Groups, World Health Organization, and American Diabetes Association, have led to a tripling of incident cases 6,7 necessitating a review of traditional therapeutic approaches to the prevention and management of GDM.
Throughout pregnancy, obese women have greater concentrations of plasma insulin, triglycerides (TGs), and free fatty acids (FFAs) compared with lean controls, contributing to the multifactorial common pathway of insulin resistance. 5 Thus, dietary strategies designed to reduce these biomarkers and postprandial hyperglycemia from an early stage in obese pregnant women provide a novel and logical approach to improve glucose control and avoid adverse pregnancy outcomes.
Data from two systematic reviews are inconclusive to support universal recommendation of low-glycemic index (LGI) diets to prevent or treat GDM, but have yielded important information regarding the safety of the approach. 8,9 Overall, pregnancy outcomes in LGI dietary randomized controlled trials (RCTs) have been unchanged, but reported maternal benefits include reductions in gestational weight gain, 10 adiposity, 11 plasma glucose concentration, 10 and progression to insulin therapy. 12
In this study, we undertook a proof-of-principle, 3-arm randomized comparison study in obese pregnant women without GDM to evaluate the effects of a slow-digesting, low-glycemic load (SD-LGL) beverage on measures of glycemic control using CGM and selected biomarkers implicated in the pathogenesis of insulin resistance. Comparison was made to a control beverage composed of rapidly digesting carbohydrate (CHO) and habitual diet.
Research Design and Methods
Subjects and recruitment
Obese pregnant women (BMI ≥30 kg/m2) with a singleton pregnancy and no history of GDM attending antenatal clinics at Guy's and St. Thomas' NHS Foundation Trust (London, U.K.) were recruited at 24+0 − 28+6 weeks of gestation, before routine 75 g oral glucose tolerance test (OGTT) at 28 weeks. Exclusions included any dietary intolerance, eating disorder, and medical conditions known to independently influence weight, body composition, or biochemistry. To exclude undiagnosed type 2 diabetes or impaired fasting glycemia, subjects were excluded if fasting plasma glucose was ≥6.1 mmol/L at first visit. Ethical approval was granted by the Riverside Research Ethics Committee (London, U.K.; Integrated Research Applications System: 12/LO/0307). An online database was designed and managed by Medscinet® (
A preliminary study was performed to examine the glycemic effect (determined by incremental area under the curve [iAUC]) and assess the palatability of 2 SD-LGL beverages (71.6% of total CHO) compared with a eucaloric control composed of rapid digesting CHO (100% of total CHO) in four categories of women (n = 10 per group): lean nonpregnant (BMI ≥18.5 − ≤24.9 kg/m2), obese nonpregnant (BMI ≥30 kg/m2), lean pregnant (prepregnancy BMI ≥18.5 − ≤24.9 kg/m2), and obese pregnant (prepregnancy BMI ≥30 kg/m2). The beverage selected for this study achieved the lowest glucose iAUC and greatest palatability scores across all groups of women (see Supplementary Appendix 1 online at
Prestudy visit and randomization
Subjects were naive to CGM technology, and thus, a prestudy visit, including a trial wearing the sensor (Abbott FreeStyle® Navigator, Alameda, CA), was undertaken. Computerized randomization, using the SQL Server Randomization function integrated in the online study database, was adopted and concealed until the study day.
Study protocol
This was a 3-arm randomized comparison design. Study visits were held in a clinical research facility (CRF) equipped with a metabolic kitchen, a research dietician, and physician. The study was performed over six consecutive days divided into three 48-h periods with CRF visits on days 1 and 5: Days 1–2 test/control beverage Days 3–4 habitual diet Days 5–6 test/control beverage
Preparation instructions for test days included sample menus for a 30–50 g CHO meal with overnight fast from 22:00 h.
All meals and snacks, including the nutritional beverages (packaged in standard drink cartons), for days 1–2 and 5–6 were provided. Women were advised to consume their normal diet during the washout period with no restriction to physical activity levels.
Empty food packets and drink cartons were returned, and a food and physical activity diary completed. This was reviewed with the dietician at each CRF visit.
Day 1–2. Following CGM calibration and fasting venous blood sampling, the prescribed breakfast and test/control beverage were consumed, and venous sampling then carried out every 15 min for 3.5 h. The importance of adherence to the controlled diet until midnight on day 2 was reiterated.
Day 3–4. The habitual diet was adopted until 22:00 h on day 4, after which participants fasted in preparation for day 5.
Day 5–6. The prescribed breakfast and the beverage (crossover: control if previously tested, test if previously controlled) were consumed with venous sampling as above at the CRF. The controlled diet together with the test/control beverage was consumed until midnight on day 6.
Subjects were excluded from data analysis if nonadherence to the controlled diet was identified from CGM downloads (n = 3).
Dietary protocol
Macronutrient composition and caloric value were equivalent for the test and control beverage (percentage total energy CHO 60.7%, fat 20.8%, protein 18.5%; total energy and 303 Kcal/8 oz carton/24 h) (Table 1), in line with dietary recommendations from the American Diabetes and Heart Associations for prevention of diabetes and reduction of cardiovascular risk in nonpregnant subjects. 13,14 The concentration of CHO subgroups, known to affect absorption, differed significantly, with the test product composed of more SD-LGL CHOs (72% vs. 0%), less rapid digesting CHO (8.4% vs. 100%), resistant starch (16.3%), and indigestible fiber (3.7%). The GL of the test and control beverages was 730 and 1124, respectively.
One 8 oz carton was consumed over each test day in two divided 4 oz servings.
Total GL was calculated by first multiplying the amount of each CHO contained in a daily dietary intake by its glycemic index (with the use of glucose as the reference food), then by summing the values from all CHO sources. Daily dietary GL (8 oz) thus represents the quality and quantity of CHO intake and the interaction between the two.
CHO, carbohydrate; GL, glycemic load.
Beverages were provided in 8 oz (237 mL) cartons; 4 oz consumed with breakfast and 4 oz as an afternoon snack (15:00 h). Addition of the nutritional beverage to the controlled diet did not exceed recommended daily energy requirements for the gestational age range of participants (24-h total calorie content 2014 Kcal inclusive of beverage). 15
A standardized diet with a low-residue and medium dietary glycemic index (GI) reflecting the “average U.K. diet” 16 was provided for the two 48-h controlled periods (days 1–2 and 5–6). On days 1 and 5, breakfast and lunch were provided in the CRF with remaining food and study beverages measured out by research staff. Women were advised to eat at similar times on each day.
Menu choices developed by the research dietician using standard food tables and WISP® (Tinuviel, Anglesey, U.K.) dietary software are supplied in Supplementary Appendix 2.
Continuous glucose monitoring
The CGM sensor was inserted on day 1 (08:00 h) and replaced on day 5 (08:00 h). Mandatory calibrations (1, 2, 10, 24, and 72 h) were performed using the inbuilt capillary glucometer and interstitial glucose measured every 10 min for the duration of the study. For analysis of PPG response, subjects were required to enter all meal times into the receiver, excluding the washout period, when habitual data were recorded. CGM data were downloaded using the CoPilot® Health Management System (Abbott Diabetes Care, Alameda, CA) and checked by two diabetes physicians.
Plasma analyses
Plasma insulin and C-peptide were measured at 15 time points (0–3.5 h) and analyzed using manual ELISA Kits (Mercodia, Uppsala, Sweden). Plasma triglyceride and nonesterified fatty acid (NEFA) concentrations were measured in plasma samples (0, 60, 120, 180, and 210 min) using a clinically validated automated platform (clinical analyzer ILab 650; Instrumentation Laboratories, Warrington, U.K.) using IL Triglyceride and Randox (FA115) kits.
All standards, controls, and samples were assayed in duplicate and quality control was performed. The interassay coefficient of variation for all assays was <5%. Analyses were performed on previously unthawed EDTA and samples stored at −80°C. Technical staff were blinded to the identity of the samples.
Analysis and statistical power
The linear mixed-model (LMM) regression method, including trigonometric terms up to order k = 3, was used in the CGM data analysis to take into account the high intraday variability and nonlinear structure of CGM data. An LMM assuming a normally distributed error term was fitted to the data. Further addition of a random effect within the model to take into account the study period (hospital vs. home) and randomization was assessed using the likelihood ratio test. CGM data were analyzed in clinically relevant time periods for each 48-h test phase as follows: 24 h (06:30–06:30 h), daytime (06:30–23:50 h), nighttime (00:00–06:20 h [one night only]), fasting blood glucose (06:00–06:50 h [one day only]), and postprandial (1 h, 2 h, and 3 h after the meal marker).
Logarithmic transformations were performed for insulin and C-peptide only, following standard distributional checks.
All analyses were carried out at a 5% significance level using SPSS version 19 and Stata version 11.2 (StataCorp, College Station, TX) and 95% confidence intervals (CIs) were obtained for the estimates.
The study protocol recommended that 22 subjects be randomized, conservatively assuming a correlation of no more than 0.3 between repeated measurements of glucose. However, as initial analyses demonstrate a correlation of 0.7, a decision was made to recruit 16 subjects, giving a power of 96% to detect a difference in glucose between test and control beverage with 95% CI (P < 0.05).
Results
Analysis was performed with data from 16 subjects randomized to receive the test or control beverage at the first visit (BMI 37 kg/m2, range 31–46, standard deviation [SD] 4.7 and age 31 years, range 21–39, SD 4.8). Twelve were of black ethnicity, two white European, and two of unclassified ethnicity. Three subjects were excluded from analysis: two for nonadherence to the controlled diet (n = 2) and one who was unable to wear the sensor.
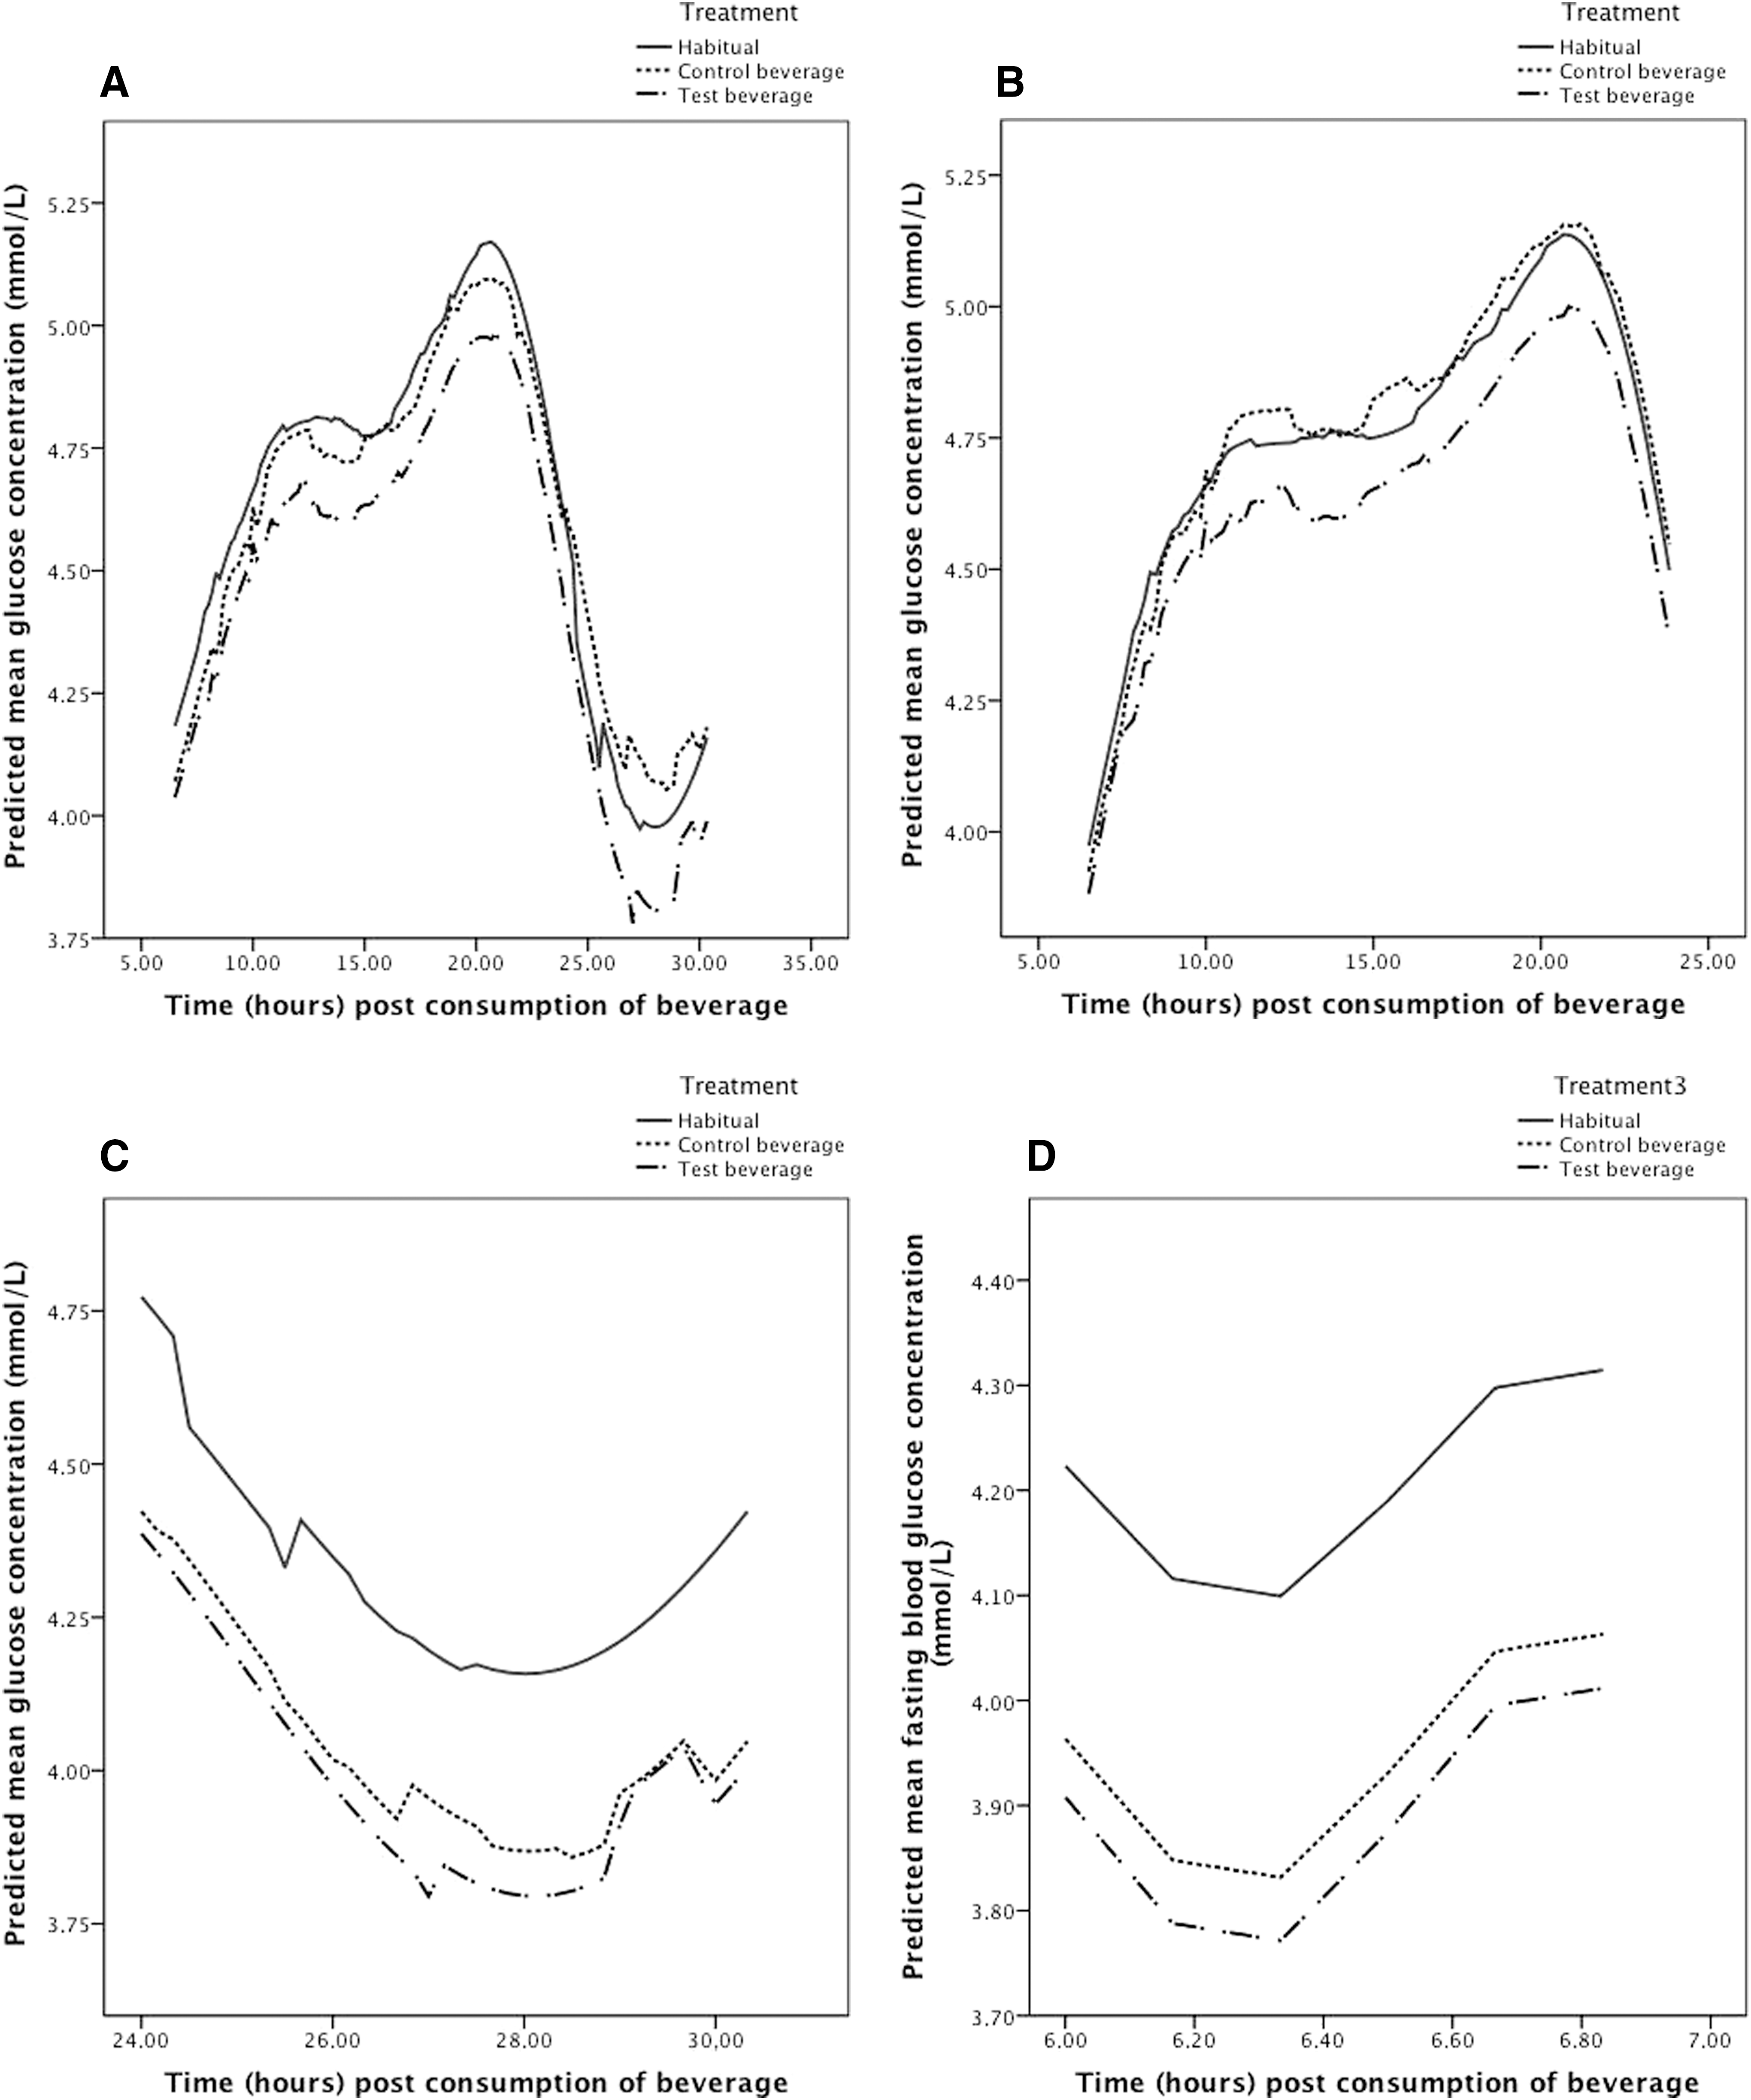
When considering the overall performance of the supplement throughout the study period (2 days and one night), the glucose curve derived from the LMM was lower than both habitual diet and control periods, as shown (Fig. 1A). Glucose estimates for habitual diet and control days were significantly greater (P < 0.001 for both) (Table 2).
For PPG estimates, data recorded 30 min premeal to 180 min postconsumption of the meal are included.
Adjusted estimates from the LMM.
Data included from 06:30 to 23:50 h.
Data included from 00:00 to 06:20 h.
Data included from 06:00 to 06:50 h.
CI, confidence interval; LMM, linear mixed model; PPG, postprandial glucose; SE, standard error.
Estimates of 24-h mean glucose concentration for study days 1, 2, and 5 were lower for the test beverage compared with the control. On the final day, day 6, no difference was found (day 1: 4.56 vs. 4.68 mmol/L, P < 0.001; day 2: 4.75 mmol vs. 4.84 mmol/L, P = 0.001; day 5: 4.47 vs. 4.73, P < 0.001; and day 6: 4.72 vs. 4.78 mmol/L, P = 0.51).
Predicted mean blood glucose concentrations were consistently lower for the test beverage throughout the day (Fig. 1B), with the estimates for the habitual diet (0.25 mmol/L [0.19 to 0.31],
Review of CGM downloads in association with the food diaries indicated lack of adherence to the protocol, with uncontrolled food consumption after midnight on the second night of each 48-h test period. These data were excluded and analysis of nocturnal data included the first night only (days 1 and 5). No difference was observed between the test and control beverages overnight (P = 0.09), but glucose concentrations were significantly greater during the habitual period compared with the test beverage overnight (P < 0.001) (Table 2) (Fig. 1C).
Analysis of fasting glucose (06:00–06:50 h) demonstrated a reduction in glucose estimates until 06:20 h (before breakfast) for the test, control, and habitual phases, with a progressive rise thereafter (Fig. 1D). Fasting CGM concentrations recorded over this 50-min period were significantly lower for the test beverage compared with the habitual period (P < 0.001), but no different to the control (P = 0.22) (Table 2).
Postprandial data (up to 3 h) excluded the habitual washout period since women were not requested to record meal markers. Glucose concentration was significantly lower following consumption of the test beverage at breakfast only (P = 0.03) (Table 2). PPG concentrations were generally lower on hospital days in the CRF compared with the second day at home for all meals in both arms (breakfast P < 0.001, lunch P = 0.80, and dinner P = 0.43) (Table 2).
Linear regression analysis found no detectable effect of the test beverage compared with control for concentrations of plasma insulin, C-peptide, and TGs (Table 3). A marginally higher concentration of plasma NEFA was observed following the test supplement (difference in arithmetic means 0.05 [95% CI 0.00–0.10], P = 0.049).
Data analyzed by linear regression analysis.
Logarithmic transformation. Geometric mean presented.
Logarithmic transformation not performed. Arithmetic mean presented.
Ratio of geometric means.
Difference in arithmetic means.
Conclusion
We tested two dietary beverages of identical macronutrient composition as part of a calorie-controlled diet in obese pregnant women considered to be at high risk of GDM. The supplements differed only by CHO composition (Table 1).
Using CGM, we demonstrated that consumption of an SD-LGL beverage, specifically developed for use in pregnancy, significantly reduced glucose concentration over a 24-h period in addition to day and night periods when examined separately, compared with habitual living (P < 0.001 for all).
Numerous factors, including meal composition, premeal glucose concentration, physical activity, insulin secretion, gastric emptying, and hepatic glucose metabolism, determine PPG. Hence, the reduction in PPG observed following traditional CHO restriction may be explicable only, in part, by the lower total CHO load. Since the rate of gastric emptying is delayed by fat, the observed increase in percentage energy from fat to ∼45% following traditional dietary strategies recommended by the American College of Obstetricians and Gynaecologists 17 will undoubtedly influence PPG concentration. 18 We demonstrated improvements in PPG concentrations without a reduction in CHO load or increase in percentage of energy from fat, excluding this mechanism as a confounder and thus supporting an independent role of CHO modification. Importantly, in this obese population, the addition of the nutritional supplement to the controlled diet did not exceed recommended daily energy requirements for the gestational age period studied. 15
Consensus methodology for the calculation of GI requires the measurement blood glucose 120 min after food consumption. 19 Recent use of CGM in GI studies has revealed potential limitations of this long-standing approach. Following the consumption of mixed meals, Chlup et al. 20 confirmed changes in glycemia exceeding 120 min with a prolonged return to baseline glucose at 210 min and beyond. In this study, we evaluated the effect of the two beverages on PPG at 180 min. With the advantage of this minimally invasive approach, inclusion of CGM in future dietary studies may yield important novel information on the impact of different food groups on PPG.
PPG was significantly lower following the test beverage compared with the control and habitual diet at breakfast. Clinically, this presents the most challenging period to achieve adequate glycemic control for women with diabetes in pregnancy due to the physiological secretion of insulin counter-regulatory hormones coupled with high concentrations of processed CHO contained in breakfast foods. 21 This often results in the use of higher insulin doses, associated with greater risks of hypoglycemia or the practice of excluding CHO from the meal entirely, a potentially challenging option typically resulting in greater fat consumption. Increased concentrations of maternal TGs and NEFA, correlated with dietary intake, are strong predictors of excess fetal fat accretion, 5,22 therefore therapeutic interventions utilizing resistant or LGL CHO to attenuate postprandial hyperglycemia, which also limit dietary fat, may have a role not only in the management of diabetes in pregnancy but also in obese nondiabetic pregnant women who have a 2- to 5-fold increased risk of delivering a large for gestational age (LGA) infant. 23
Obese pregnant women are at increased risk of lipotoxicity and its metabolic sequelae. This occurs as a consequence of increased hydrolysis of dietary TGs and expanded adipose depots generating FFAs, contributing to insulin resistance. 24,25 LGI and LGL diets may therefore be more effective in obese compared with lean women as they are likely to be more insulin resistant. 26,27
Most adequately powered studies comparing responses to dietary advice, designed to increase the consumption of LGI foods in women with 28 –31 and without GDM, 10,29 have been carried out in women with BMI 24–27 kg/m2 with equivocal results. Moses et al. 29,32 reported improved obstetric outcomes (birth weight, ponderal index, and incidence of LGA) comparing LGI with a “high-fiber moderate-to-high GI (HGI)” diet in healthy women without GDM (n = 62, mean BMI 25.5 kg/m2, mean GI 51 vs. 58 for LGI and HGI, respectively), but did not replicate these findings in a larger RCT (mean BMI 24.5 kg/m2). In both studies, a relatively small although significant reduction in GI was achieved in the intervention arm compared with the control, with a greater GI point difference reported in the former. 29,32
Of those dietary advice intervention studies undertaken in women of a higher BMI, the ROLO study (LGI diet in pregnancy to prevent macrosomia RCT) (mean BMI 26.8 kg/m2) reported a reduction in GL and 1-h glucose following a 50 g glucose challenge test. 10 In the heterogeneous overweight and obese population of the LIMIT trial (n = 2212) (the effects of antenatal dietary and lifestyle advice for women who are overweight or obese on maternal diet and physical activity), a lifestyle intervention designed to reduce LGA infants in overweight and obese women, general dietary advice led to a small reduction in the GL but no change in the primary outcome or GDM, although the number of infants with macrosomia was reduced. 33 A reduction in GDM, the primary outcome, was also not met in the exclusively obese UPBEAT study (mean BMI 36.3 kg/m2), but GI and GL were reduced in the intervention group as was consumption of CHO, total fat, saturated fat, and total energy. Daily intake of fiber and protein was increased, and gestational weight gain and maternal adiposity were significantly less at the time of the OGTT and over the entire pregnancy. 11
Considering the potential therapeutic benefits of LGI and LGL diets in pregnancy, improving glycemic control using an LGI beverage in high-risk obese women to attenuate glucose intolerance warrants further exploration. Current U.K. National Institute for Health and Care Excellence recommendations include general dietary advice for all obese pregnant women at the first clinical consultation
Using a similar design as in the present investigation, Hernandez et al. 35 conducted a study to determine whether reducing the fat content of a complex CHO traditional “GDM” diet in obese pregnant women with GDM would improve glucose control, using CGM in controlled and free living environments. No difference in mean glucose between the lower and control higher fat diets was observed, but the glucose AUC was significantly greater in those on the lower fat diet for daytime and 24-h periods. The clinical relevance of the increase in glucose exposure reported, together with the modest reductions observed in our study on pregnancy outcomes, requires assessment. We found no difference following the SD-LGL beverage in the concentration of relevant biomarkers (plasma insulin, C-peptide, and TGs), but a small increase in NEFA. It would be of interest in future studies to determine whether glucose-independent pathways contributing to insulin resistance, as assessed by a targeted metabolome, are influenced by this dietary intervention. 36
Limitations of the study include the small sample size and short duration. This was a proof-of-concept study and we would recommend that future studies of the SD-LGI beverage extend until delivery and include evaluation of neonatal outcomes. It is unclear whether the small reduction in glucose estimates observed would correspond to a clinically significant reduction in glycated hemoglobin or adverse neonatal outcomes, including macrosomia, but analysis of alternative measures of glycemia utilizing CGM is warranted.
We recruited a high number of women from black ethnic minorities who are recognized to have a significantly greater risk of GDM and type 2 diabetes compared with white European women of equivalent BMI. 37 It is possible that reductions in glucose observed may not be as pronounced in a Caucasian population. Conversely, the results indicate that those at greatest risk of GDM may stand to gain the greatest benefit, as suggested by Louie et al. 30 OGTT was not performed at recruitment, and therefore, in the absence of biochemical evidence of glucose intolerance, “high risk for GDM” was defined by BMI on entry in keeping with similar LGI studies in pregnancy.
Participation in dietary studies may introduce a degree of bias or confounding as a consequence of the “observer” or “Hawthorn effect,” when individual behaviors are modified in response to an awareness of being observed. In this study, however, the greatest differences in glycemia were observed between the test beverage with controlled diet and habitual diet for all time periods examined, suggesting that diet was not specifically modified on the habitual days.
The CONCEPTT study demonstrated improvements in maternal glycemia and neonatal outcomes in women with T1DM who used CGM. 38 It is possible that CGM plus dietary advice in this high-risk obese population may improve maternal glycemia or reduce progression to GDM, but to the best of our knowledge there are no studies specifically examining this.
Glucose concentrations were generally lower on the first day compared with the second of each 48-h test period for both beverages. Visits on these days were conducted in the CRF, a highly controlled environment, with limited ability to exercise. This could indicate issues with nonadherence to the prescribed diet on “home” days or could reflect a chance finding although several methods to improve compliance were adopted: participants being requested to return all empty food packets/drink cartons and complete a food and exercise diary.
In conclusion, we have demonstrated in obese women at high risk of GDM that consumption of an SD-LGL beverage when compared with habitual diet reduces glucose concentration over a 24-h period, and that this includes differences during both day and night. In contrast to previously reported LGI diets in obese pregnant women, the beverage comprised both an LGI CHO and slow digesting CHO, which could have additive clinical benefit. A reduction in PPG at breakfast is also of particular clinical relevance. Evaluation of this dietary approach in an RCT to reduce incidence of GDM in high-risk obese women is justified.
Footnotes
Acknowledgments
The authors acknowledge the support of all participants and Erini Platsa (research midwife) for her assistance with all aspects of the study. The authors thank Laima Juodvirsiene (MedSciNet) for technical support with the database, staff of the CRF at Guy's and St. Thomas' NHS Foundation Trust (GSTFT), London, and the laboratory staff at King's College London for their excellent technical input: Dr. Carolyn Gill, Dr. Jo Gill, and Anne-Catherine Perz. They also acknowledge the support of the NIHR Biomedical Research Centre at Guy's and St. Thomas' NHS Foundation Trust and King's College London. L.P. was supported by Tommy's Charity and the European Union's 7th Framework Programme (FP7/2007–2013), project EarlyNutrition under grant agreement no. 289346. Funding was provided by Abbott Nutrition, Research and Development, Granada, Spain.
Authors' Contributions
R.M. researched data, wrote the article, and edited the final version. N.P., C.S., B.M, J.M.L.P., H.M., R.R., and L.P. edited and contributed to the article. R.M. and S.B. designed the study protocol. P.S. and L.G.F. provided statistical analysis of the data and review of the article.
Author Disclosure Statement
No competing financial interests exist.
References
Supplementary Material
Please find the following supplemental material available below.
For Open Access articles published under a Creative Commons License, all supplemental material carries the same license as the article it is associated with.
For non-Open Access articles published, all supplemental material carries a non-exclusive license, and permission requests for re-use of supplemental material or any part of supplemental material shall be sent directly to the copyright owner as specified in the copyright notice associated with the article.