
Abstract
Background:
This study investigated the accuracy of real-time continuous glucose monitoring (rtCGM) during high intensity interval training (HIIT) in patients with type 1 diabetes (T1D).
Methods:
Seventeen participants with T1D, using multiple daily injections (MDI) with basal insulin glargine 300 U/mL (Gla-300), completed four fasted HIIT sessions over 4 weeks while wearing a Dexcom rtCGM G4 Platinum system. Each exercise consisted of high intensity interval cycling and multimodal training over 25 min. Reference venous plasma glucose (PG) was measured at 60- and 10-min before exercise (Stage 1), every 10 min during exercise and then every 15 min until 180 min after the end of exercise (Stage 2: during exercise and 45-min early recovery; Stage 3: 45 min to 3 h after the end of exercise); and at 6-, 10-, and 13-h postexercise (Stage 4).
Results:
In the 64 HIIT sessions that resulted in hyperglycemia, PG increased 90.0 ± 32.4 mg/dL (mean ± standard deviation), peaking at 68.0 ± 18.4 min from the start of HIIT. Mean absolute relative difference was highest during exercise and early recovery (Stage 2) at 17.8%, versus Stage 1 (10.4%), Stage 3 (10.6%), and Stage 4 (11.5%) (P < 0.001). During Stage 2, rtCGM showed a significant negative bias of 35.3 mg/dL (P < 0.001) compared to reference glucose. Lag time to reach the half-maximal glucose rise was 35 min in rtCGM versus PG. The Surveillance Error Grid found that in Stage 2, only 65.5% of paired values were in the no-risk zone and the %15/15 was 50%, significantly lower than the other stages (P < 0.001).
Conclusions:
During HIIT and early recovery, there is an increase in lag time and a related decline in accuracy of Dexcom rtCGM G4, compared to pre-exercise and later recovery, in patients with T1D using MDI.
Introduction
Glycemic control is essential for optimal health and avoidance of complications in people living with type 1 diabetes (T1D). Real-time continuous glucose monitoring (rtCGM) systems have become a useful tool in optimizing glycemic control since they provide real-time information on direction, amplitude, and duration of glucose fluctuations and assess the frequency and severity of hypo- and hyperglycemia. 1 Compared to conventional self-monitoring of blood glucose (SMBG), rtCGM strengthens diabetes self-management by enabling health care professionals, patients, and, potentially, algorithms to improve the precision of insulin dose and timing. In patients with T1D, rtCGM has been independently associated with significant reductions in hemoglobin A1c (HbA1c) and exposure to hypoglycemia, improved time in glycemic range, 2,3 and reduced glucose variability. 4
Physical activity is recommended for people living with T1D because it improves glycemic control, decreases insulin resistance, controls body weight, and slows the development of cardiovascular complications and peripheral neuropathy. 5,6 Despite these benefits, inclusion of exercise in T1D care remains a challenge due to fear of hypoglycemia. 7 Conversely, hyperglycemia can occur after high intensity exercises such as sprinting, resistance training, or high intensity interval training (HIIT). 8,9 Although strategies to manage exercise-related fluctuations in glycemia have been proposed, 5 the availability of rtCGM creates new opportunities for patients to monitor their glucose control during exercise and potentially engage in preventive measures such as carbohydrate feeding or insulin dosing changes to avoid hypoglycemia or hyperglycemia.
The accuracy of rtCGM during prolonged aerobic exercise has been examined in a number of previous publications and thoroughly reviewed. 10 Some studies show reasonable accuracy during exercise, 11,12 while other studies report a significant deterioration in accuracy compared to the rest. 13 –16 In general, rtCGM tends to underestimate the drop in glucose during exercise, likely because of a significant lag time between interstitial fluid glucose and capillary glucose. 17 Less is known about rtCGM accuracy during short-term more intensive exercise when glucose levels tend to rise, such as during a session of HIIT. 18 HIIT has been growing in popularity in the past two decades as a time-efficient exercise strategy to improve cardiorespiratory and metabolic health, 19 and it may offer an additional advantage of reduced risk of hypoglycemia, compared with moderate-intensity exercise in T1D. 20 Although a study of rtCGM accuracy in HIIT appeared to show good accuracy when the exercise was performed after breakfast and glucose concentrations remained relatively stable, 11 other studies have consistently reported significant deterioration in mean absolute relative difference (MARD) and/or increased lag time. 13,20 These concerns regarding rtCGM accuracy emerged in analyses using relatively small populations and older evaluation criteria (International Organization for Standardization [ISO] 15197:2003) and in HIIT protocols that produced relatively modest glucose amplitude increases, if at all. The aim of the current study was to evaluate the accuracy of an rtCGM system, the Dexcom rtCGM G4 Platinum, during and after multimodal HIIT, using the latest ISO 15197:2013 guidelines, in people living with T1D.
Research Design and Methods
Study protocol and subjects
The FIT study evaluated 17 participants with T1D in a protocol that measured four repeated weekly in-clinic HIIT sessions to evaluate the optimal insulin correction factor for post-HIIT hyperglycemia. 18 The participants were physically active, HbA1c 6.0%–9.0%, using multiple daily injections (MDI) with insulin glargine U300 (Toujeo™) as their basal insulin and total daily dose ≥30 U, and had completed an 8-week run-in period to optimize their MDI regimens.
The full exercise details have been described. 18 Each HIIT session was performed after an overnight fast and consisted of three 5-min bouts of high intensity exercise, with two 5-min rest periods in between. The first and third 5-min bouts were composed of alternating 30-s bursts of intense cycling and active recovery cycling. Following a 2-min warm-up cycling at a moderate intensity (i.e., ∼50% of the participant's predetermined peak aerobic power (VO2peak), the first 30 s of high-power cycling began at a power output (watts) corresponding to 100% of VO2peak and, subsequently, increased in power to 110-, 120-, 130-, and again 130% of VO2peak. The middle bout included calisthenics: two cycles of marching with dumbbells, jumping jacks, burpees, triceps push-ups, burpees, triceps push-ups, forearm plank, and medicine ball sweeps (each exercise was undertaken for 20 s).
Study measures
The Dexcom rtCGM G4 Platinum device was used to measure interstitial glucose. A new rtCGM sensor had been inserted 24–72 h before each session, calibrated with capillary glucose measurements as per the manufacturer's instruction, and was worn for at least 21 h after exercise ended.
A catheter was inserted to collect forearm venous blood on the morning of supervised exercise and throughout the observational time. Plasma glucose (PG) (YSI 2300 STAT Plus, Yellow Springs, OH) was used as reference glucose in this study and was measured at 60 and 10 min before the start of exercise, every 10 min during exercise, and then every 15 min until a standardized meal was provided at 180 min after the end of exercise. Subsequently, PG was measured at 6-, 10-, and 13-h after the start of exercise, corresponding to resting, dinner, and snack time, respectively. Capillary glucose was also measured at frequent time points as a safety measure (FreeStyle InsuLinx, Abbott).
The study protocol was approved by a local independent Research Ethics Committee and was conducted in compliance with the ethical principles of the Declaration of Helsinki. All participants gave written informed consent.
Statistical analysis
In our experiments of participants with T1D performing HIIT in a fasted state, we noted that PG rose rapidly with a single session of HIIT. 18 We therefore hypothesized that there would be a discrepancy between rtCGM result and PG level during exercise and during early recovery and that this discrepancy would disappear in late recovery (i.e., after about 45 min of exercise completion). Thus, we predefined four stages to evaluate the accuracy of rtCGM glucose compared to PG values: Stage 1—pre-exercise (between 0 to 60 min before the start of exercise); Stage 2—during exercise and early recovery (between the start of exercise to 45 min after the end of exercise); Stage 3—late recovery (between 45 min to 3 h after the end of exercise); and Stage 4—resting (between 6 to 13 h after the start of exercise) (Fig. 1).

Glucose mean values were measured by YSI and rtCGM from 60 min before exercise to 780 min (∼13 h) after the start of HIIT. SMBG mean values were only measured at 10 min before exercise and 5-, 15-, 25-, 40-, 220-, 600-, and 780-min after the start of HIIT. Four stages were predefined: (Stage 1) pre-exercise, (Stage 2) exercise and early recovery, (Stage 3) late recovery, and (Stage 4) resting. HIIT (from time 0 to 25 min). Values represent mean ± standard deviation. HIIT, high intensity interval training; rtCGM, real-time continuous glucose monitoring; SMBG, self-monitoring of blood glucose.
PG was used as reference glucose and was paired with the temporally nearest rtCGM values within 2.5 min. The MARD, as well as median absolute relative difference (ARD), was used to evaluate the overall statistical accuracy performance of the rtCGM device. 21 Bland–Altman plots were applied to depict the data distribution graphically and to quantify the bias, defined as the difference between paired rtCGM and YSI glucose values. 22 In Stage 2, for each participant, the difference between the peak and the pre-exercise YSI glucose was defined as the maximal YSI glucose rise. A nonlinear regression model (four-parameter logistic/five-parameter logistic/cubic polynomial) was chosen to best fit YSI and rtCGM glucose curve for each exercise session to achieve r 2 > 0.9. The best-fit individual equation was then used to calculate the time to the half-maximal glucose rise. The lag time was then calculated as the difference in time between rtCGM and YSI to reach half-maximal and maximal YSI glucose rise. To further assess the clinically relevant accuracy of the rtCGM device, we incorporated the ISO 15197 2013 standards, including the Parkes Error Grid (PEG), 23 the %15/15 standard, 24 as well as the Surveillance Error Grid (SEG). 25
All data are presented as mean ± standard deviation values or percentages unless otherwise indicated. MARD and bias comparisons among four stages were analyzed using analysis of variance. Percentage comparisons among four stages were analyzed using Chi-squared tests. P values of <0.05 were considered statistically significant. All analyses were completed using R v3.4 (
Results
Seventeen participants completed a total of 71 exercise sessions. Sixty-four of these sessions (90%) resulted in HIIT-induced hyperglycemia and underwent the full four stages of rtCGM observation used in this study. Across all sessions, mean PG before exercise (baseline) was 158.4 ± 18.0 mg/dL. It increased to 216.0 ± 41.4 mg/dL after the 25-min HIIT session, reaching 228.6 ± 43.2 mg/dL after the 15-min postexercise rest period. The characteristics of the 17 participants at baseline are presented in Table 1.
Characteristics of Participants at Baseline
Continuous variables are presented as mean ± SD, and categorical variables are presented as counts (percentage).
BMI, body mass index; SBP, systolic blood pressure; DBP, diastolic blood pressure; eGFR, estimated glomerular filtration rate; HbA1c, hemoglobin A1c; SD, standard deviation; VO2peak, peak aerobic power.
rtCGM analytical accuracy
Overall, 97% of the anticipated rtCGM values were recorded, and all exercise sessions showed no <80% availability of the expected rtCGM values. The time period analyzed spanned from 60 min before exercise to 13 h after exercise. A total of 1317 paired sensor (rtCGM) and reference (YSI) glucose values were used for evaluation: 128 in Stage 1 (pre-exercise), 383 in Stage 2 (192 during exercise and 191 during early recovery), 638 in Stage 3 (late recovery), and 168 in Stage 4 (resting) (Table 2).
Summary of Real-Time Continuous Glucose Monitoring Accuracy Before-, During-, and After High Intensity Interval Training Exercise
Normoglycemia is defined as PG between 72 and 180 mg/dL. Hypoglycemia is defined as PG <72 mg/dL, and hyperglycemia is defined as PG >180 mg/dL.
%15/15 refers to values within 15% of the relative difference from the reference values when glucose levels ≥100 mg/dL and within 15 mg/dL of absolute difference when glucose levels <100 mg/dL (New standards in ISO: 15197:2013). %20/20 refers to values within 20% of the relative difference from the reference values when glucose levels >80 mg/dL and within 20 mg/dL of absolute difference when glucose levels ≤80 mg/dL.
P < 0.01 when comparing those values in Stages 1, 3, and 4.
P < 0.001 when comparing those values in Stages 1, 3, and 4.
ARD, absolute relative difference; CI, confidence interval; ISO, International Organization for Standardization; MARD, mean absolute relative difference; NA, not applicable; PEG, Parkes Error Grid; PG, plasma glucose; rtCGM, real-time continuous glucose monitoring; SEG, Surveillance Error Grid.
As shown in Figure 1, SMBG means did not significantly differ from YSI glucose means in each stage where SMBG was collected. Similarly, the mean glucose levels as measured by both rtCGM and YSI were similar before exercise and during late recovery and resting time, but they diverged significantly during HIIT and early recovery (Stage 2). As well, MARD between rtCGM and YSI glucose in Stage 2 was 17.8%, significantly higher than those of 10.4%, 10.6%, and 11.5% in Stage 1 (pre-exercise), Stage 3 (late recovery), and Stage 4 (resting), respectively (P < 0.001) (Table 2). The median ARD was 8.2%, 16.7%, 7.7%, and 7.2% in Stages 1 to 4, respectively, consistent with MARD. Among periods of normoglycemia (72–180 mg/dL), hyperglycemia (>180 mg/dL), and hypoglycemia (<72 mg/dL) (where hypoglycemia data were sufficient), MARD was consistently highest in normoglycemia in each of the four stages of observation (P < 0.001). MARD between SMBG and YSI glucose ranged from 5.9% to 7.4% throughout the four stages.
In Stage 2, glucose rose in 63 of 64 exercise sessions (98.4%). In the YSI measurement, the maximum glucose rise was 90.0 ± 32.4 mg/dL. The time to reach half-maximal glucose was 22 ± 8 min, and time to reach maximal glucose was 68 ± 18 min, after starting exercise. In the rtCGM measurement, the time to reach half-maximal and maximal glucose was 56 ± 16 and 84 ± 21 min, respectively, but maximal glucose was only achieved by 40 participants. The lag time between rtCGM and YSI glucose to reach half-maximal glucose was 35 ± 17 min. Lag time was correlated to the YSI maximal glucose rise (r = −0.29, P = 0.03) and to the baseline PG (r = 0.33, P = 0.02), but not to the maximal glucose achieved (r = 0.02, P = 0.88).
As expected from the identified time lag during exercise, the Bland–Altman plot showed a significantly negative bias of 35.3 mg/dL (95% confidence interval: 32.2–38.3) (P < 0.01) in rtCGM glucose compared to YSI PG in Stage 2 (P < 0.01) (Fig. 2). There was otherwise only a slight underestimation of glucose concentration with rtCGM in Stage 1 and no significant bias in Stages 3 and 4 (Table 2; Fig. 2). Comparisons across the glycemic ranges similarly showed that the most prominent biases occurred during normoglycemia (Table 2).

Bland–Altman plots of rtCGM versus reference YSI glucose from Stages 1 to 4. In these four Bland–Altman plots, which depict the bias of rtCGM to YSI (in mg/dL), a significant negative bias of 35.3 mg/dL in rtCGM compared to YSI PG in Stage 2 was observed (P < 0.01). There was otherwise only a slight underestimation of glucose concentration with rtCGM in Stage 1 and no significant bias in Stages 3 and 4. CGM, continuous glucose monitoring; PG, plasma glucose.
rtCGM clinical accuracy
The results of the PEG comparably showed a decay in rtCGM performance in Stage 2 compared to Stage 1. Only 54.6% of values were found in Zone A during Stage 2, compared to 85.9%, 91.7%, and 88.1%, respectively, for Stages 1, 3, and 4 (P < 0.01) (Table 2). However, paired values fell within Zone A/B in 100%, 100%, 99.1%, and 99.4% of the time in Stages 1 to 4, respectively.
The SEG results showed excellent performance in Stages 1, 3, and 4, with 84.4%, 90.4%, and 87.5% of paired values, respectively, within the no-risk zones (Table 2; Fig. 3). However, in Stage 2, only 65.5% of paired values were in the no-risk zone (Table 2), which was significantly lower than the other stages (P < 0.001).
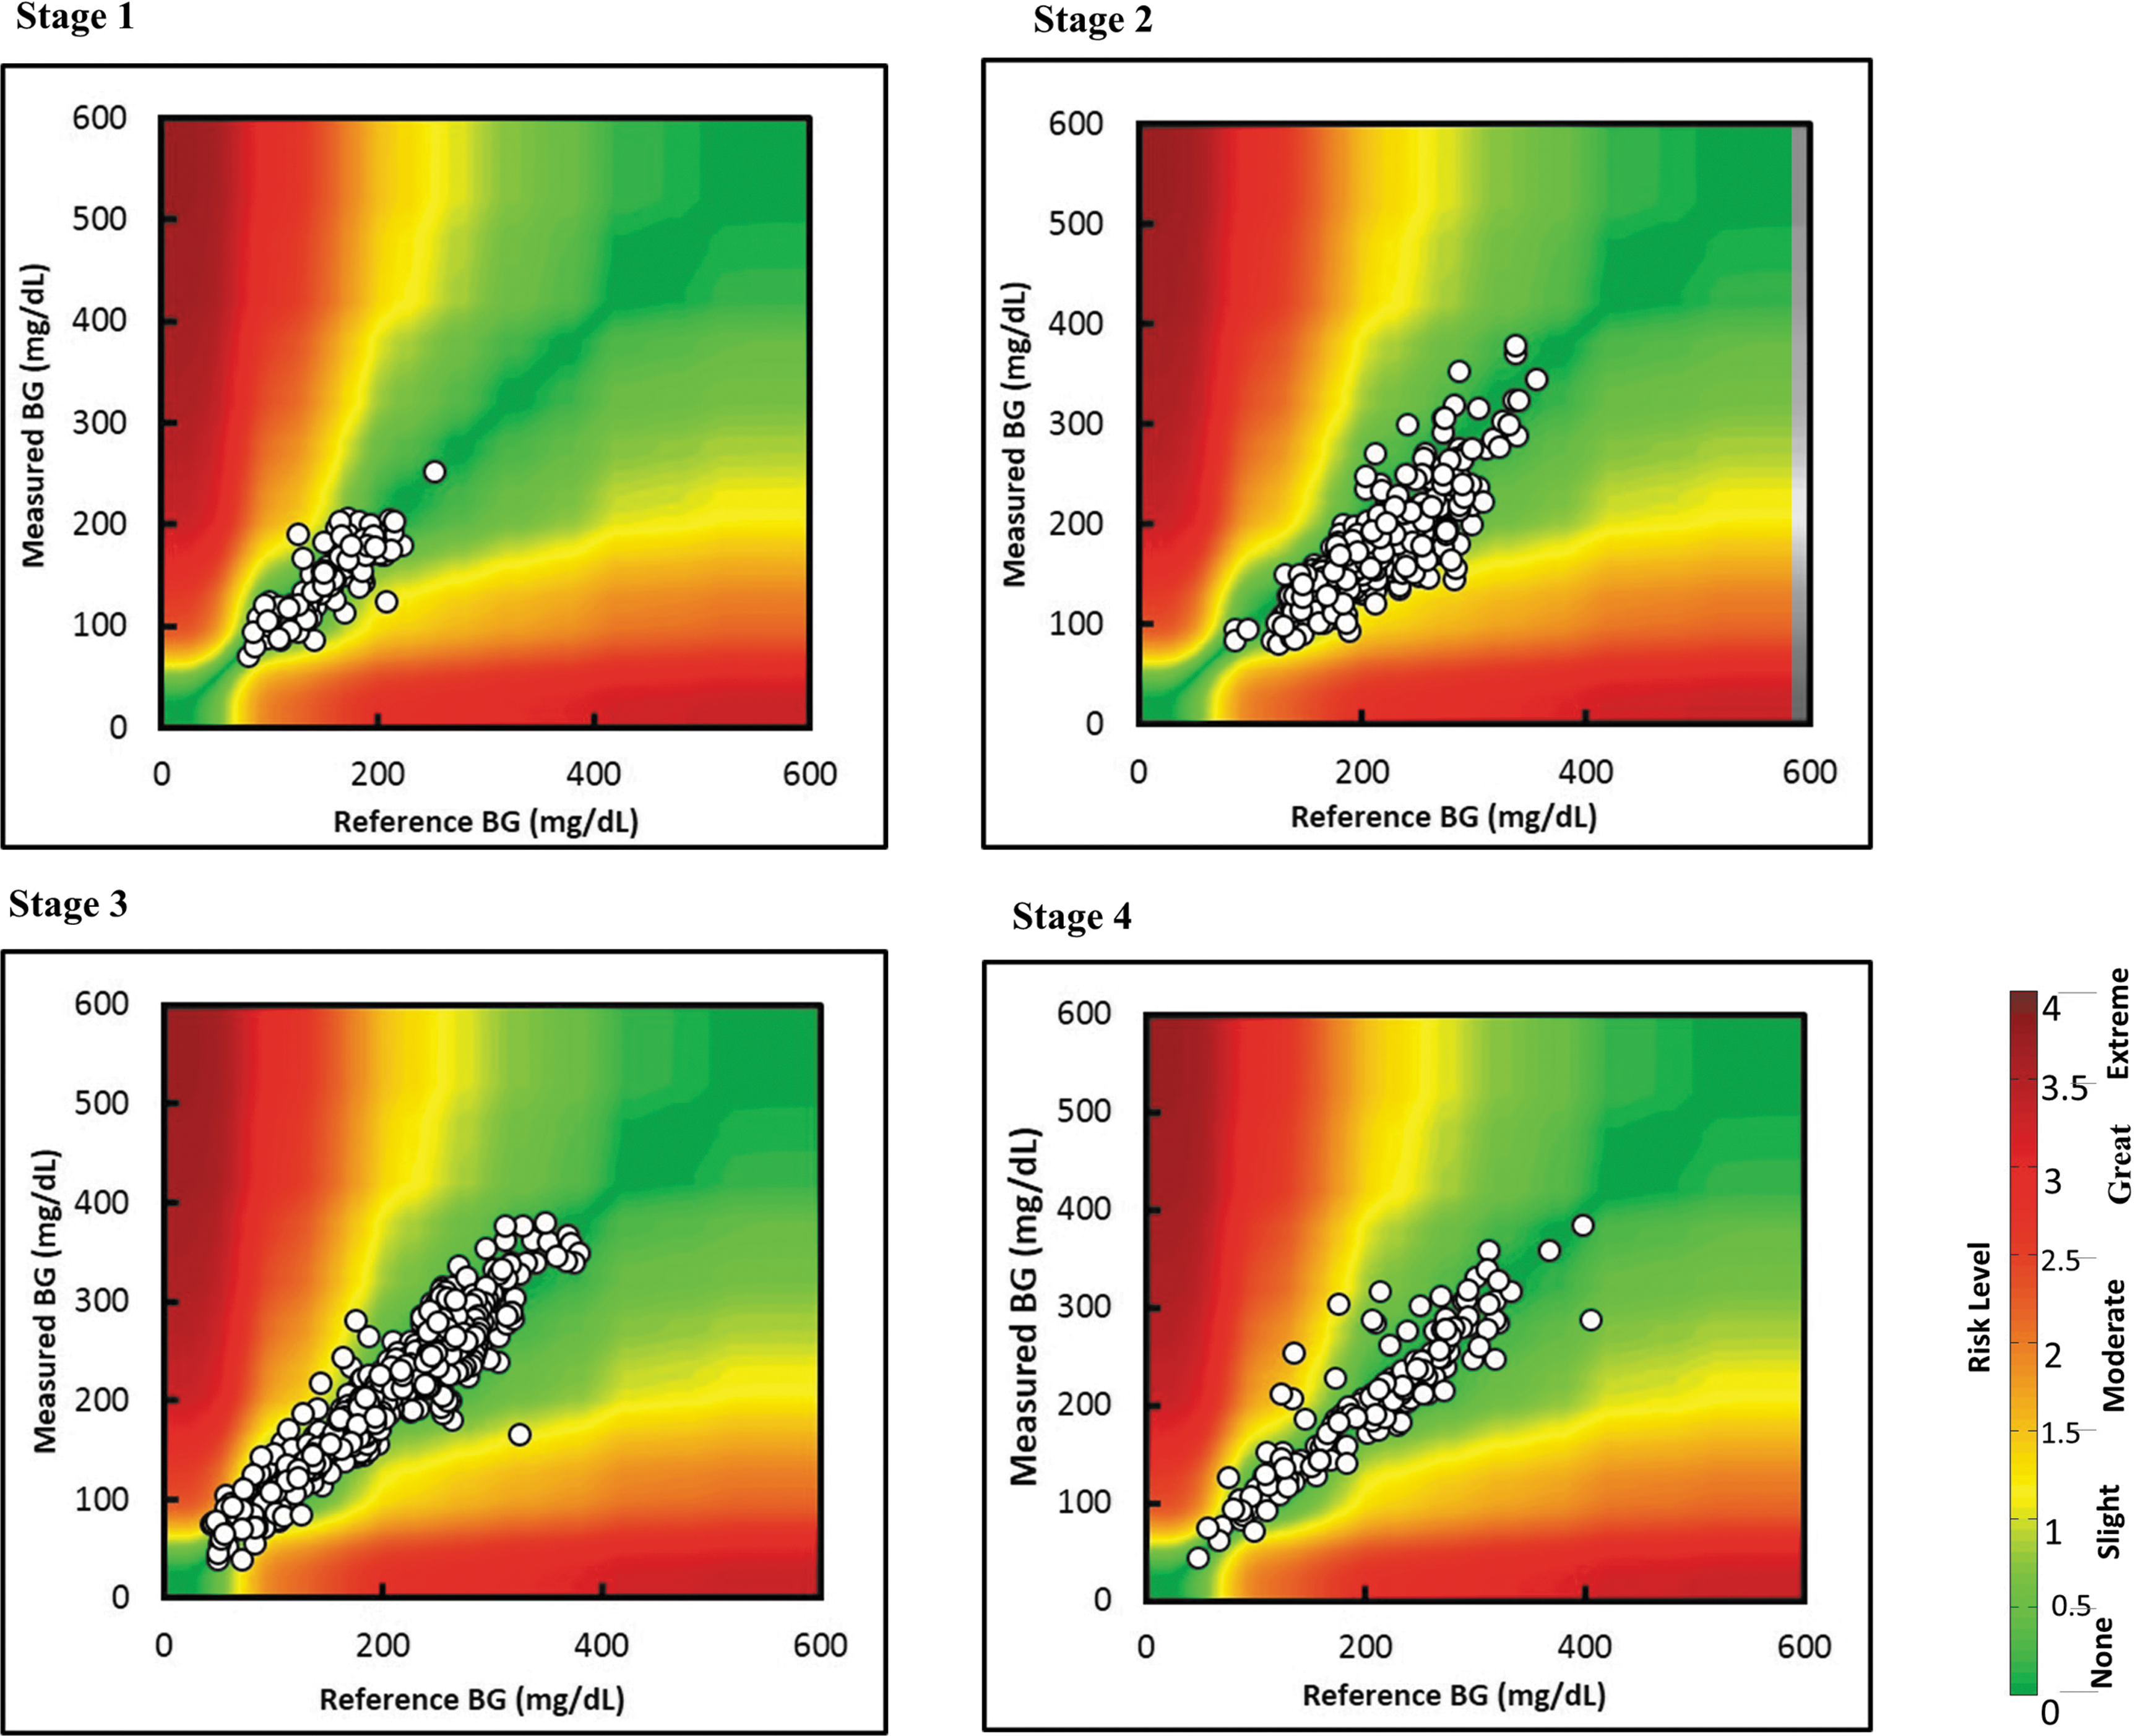
Surveillance Error Grid plots for rtCGM versus reference YSI glucose in Stages 1 to 4. In Stage 2 only 65.5% of paired values were in the no-risk zone, compared with 85.9%, 91.7%, and 88.1% of paired values in Stages 1, 3, and 4, respectively.
The %15/15 was significantly lower in Stage 2 at 50%, compared to 76.6%, 79.6%, and 75.6% measured in each Stages 1, 3, and 4, respectively (P < 0.001) (Table 2).
Discussion
This study prospectively evaluated the accuracy of rtCGM before, during, and after multiple HIIT sessions, when PG levels tended to rise rapidly in people with T1D. We used the Dexcom rtCGM G4 Platinum device with the YSI PG as a reference. There was a significant lag in rtCGM glucose reporting during HIIT exercise and in the first 45 min of early recovery (Stage 2) compared to pre-exercise (Stage 1), late recovery (Stage 3), and 6- and 13-h after HIIT (Stage 4). The Stage 1 MARD (between rtCGM and YSI glucose) of 10.4% and median ARD of 8.2% measured in this study are similar to the MARD of ∼9% reported in adults with diabetes using Dexcom rtCGM G4 Platinum with an advanced algorithm (i.e., 505 software). 27 However, the active exercise and early recovery of HIIT (Stage 2) was associated with a 35-min time lag, leading to a PG underestimation bias of 35.3 mg/dL and a much higher MARD (17.8%) and median ARD (16.7%). The %15/15 score, part of the ISO 15197:2013 guideline, was also lower in Stage 2 with a value of only 50%. The significant delay in rtCGM-reported glucose elevation under the conditions in this study might cause participants to delay corrective insulin administration if hyperglycemia ensues.
Different types of exercise, including moderate- to high-intensity aerobic and anaerobic exercise with or without high-intensity interval exercise, have all been associated with significantly increased MARD or median ARD (ranging from 16.5% to 26.5%). 13 –16 In a comprehensive assessment of rtCGM accuracy in continuous versus high intensity exercise conditions over 24 repeated sessions in each subject, Moser et al. 13 similarly found higher MARD and increased bias in the high-intensity interval exercise condition, although it was shown that rtCGM tended to generally overestimate blood glucose concentration. Divergent from our findings, Bally et al. 11 reported a relatively lower MARD of 13.3% during continuous moderate exercise and 13.6% during intermittent high-intensity exercise, which might have resulted from the study's goal to maintain euglycemia (target 126 mg/dL) using an oral glucose solution. In contrast, we show in this study that when glucose is rising rapidly in response to HIIT, Dexcom rtCGM G4 clearly has a significant delay which may result in a significant underestimation in glucose concentrations at the end of exercise and in early recovery when participants should be considering a bolus insulin correction to help combat this rise. 18
In this study, participants were experiencing HIIT-induced hyperglycemia, so an exaggerated time lag between blood and interstitial glucose transport may explain the underestimation of a rising blood glucose during exercise. The 35-min lag in rtCGM readings versus YSI PG was actually correlated with the overall rise in PG during exercise and early recovery. In general, Dexcom, Enlite/Guardian REAL-Time, and FreeStyle Navigator rtCGM have been reported to have lag times of 6, 8, and 13 min, respectively, under sedentary conditions. 28 –30 Iscoe et al. 31 reported that the lag time may increase to an approximate of 20 min during high-intensity cycling exercise using Guardian rtCGM. Time lag amplification of 22 min was also noted by the DirecNet Study Group in a trial of moderate intensity exercise in children using the Freestyle Navigator. 32 Recently, Zaharieva et al. 33 found a 20 min lag in rtCGM during aerobic exercise in the Medtronic Guardian Sensor 3 and Dexcom G5 rtCGM. Integration of a 10-min lag time into the sensor algorithm has been suggested as a solution to decrease median ARD from 17% to 11% in children using Freestyle Navigator rtCGM during a moderate-intensity exercise. 32
In this setting of exercise-induced rise in PG, the rtCGM glucose time lag has led to a negative bias compared to YSI PG. Fortunately, in this context of hyperglycemia, a negative bias may be less likely to lead to undue insulin correction and therefore minimal increased risk. Prior reports have used Clarke Error Grid to assess rtCGM accuracy during exercise from a clinical impact perspective. While some reported a lower percentage of values (87%) within clinically safe Zones A and B, 14 others demonstrated more acceptable values during moderate/high intensity aerobic and anaerobic exercise (with or without interval training) with 95%–100% of paired measures located in Zones A and B. 11,13,15 All the above studies, including our own, found a smaller percentage of pairs solely in Zone A during exercise compared to sedentary periods. PEG analysis is part of the ISO 15197:2013 guidelines, stipulating that 99% of paired values must fall within Zones A and B. 34 Our PEG analysis similarly found only 54.6% of values in Zone A itself but confirmed that 99% of exercise values fell within the clinically acceptable Zones A and B (Table 2). Similarly, our SEG analysis showed that although only 65.5% of paired values were in the no-risk zone, 100% fell in the no-risk or slight-risk zones. Thus, although rtCGM accuracy is clearly diminished during active HIIT exercise and early recovery, the clinical impact would imply only minimal risk of a serious outcome based on the underestimated glucose results.
Both the type and intensity of physical activity pose challenges for rtCGM accuracy. In addition to the physiological time lag of glucose transport between blood and interstitial compartments, the rate of glucose change, oxygen concentration, increased temperature, lactic acidosis, and changes in metabolites are all possible contributors to potentially deteriorated accuracy during HIIT. Others have shown that the rate of glucose change and increased temperature during exercise only partially accounted for the difference in accuracy. 14,35 Interestingly, we found sensor accuracy to be better during the rise in glucose at mealtime (Stages 3 and 4) than during HIIT and early recovery (Stage 2) even though the rise in glucose was comparable. Surprisingly, decreased pH due to accelerated lactate production in high-intensity exercise has been shown to have no effect on rtCGM performance in vitro. 36
There are several strengths in this study design. The cohort size and the repeated exercise protocols within the same subjects contributed to reduced variability. Data collection had occurred in the context of a prospective randomized controlled trial, 18 and rtCGM and YSI data were collected in a timed and well-controlled clinical setting. Each of the 64 exercise sessions was identical and supervised by one of three certified exercise physiologists. PG, as opposed to capillary glucose, was used as the reference measure. Finally, a comprehensive set of assessment tools and the most recent ISO 15197:2013 guideline were applied to assess the performance of rtCGM in comparison to YSI PG.
Several limitations should be considered as well. This analysis was post hoc and should be considered hypothesis-generating only. The sample under study was limited to HIIT sessions performed in a fasting state, which tended to result in post-HIIT hyperglycemia. The findings may not be generalizable to other forms of HIIT or to HIIT sessions that do not result in hyperglycemia. Finally, we only analyzed one rtCGM system, Dexcom rtCGM G4 Platinum, and our results may not be generalizable to other rtCGM technologies or to newer generations of the Dexcom rtCGM system and their updated software. Interestingly, although our highest MARD and bias were seen during normoglycemia, the percentage of time in hypoglycemia in our study was minimal (1.3% of the entire observation period), and the related MARD and bias assessments may not be reliable.
This study is the first comprehensive evaluation of rtCGM accuracy, using all current ISO-designated tools, during the current popular form of HIIT, incorporating multiple muscle groups and repeatedly approaching peak exercise capacity. The significant decline in the performance of the Dexcom rtCGM G4 Platinum during HIIT and early recovery indicates a time lag of up to 35 min, a significant bias of PG underestimation, and an increased MARD. Sensor accuracy was most unsatisfactory when glucose levels were in the range of normoglycemia. These findings should alert patients with T1D and their health care providers to use a degree of caution in interpreting rtCGM results during and immediately following HIIT when bolus insulin correction may be warranted to combat hyperglycemia. These findings may support future algorithm development for rtCGM technologies to incorporate responsiveness to the differing impacts of different types of physical activity.
Footnotes
Acknowledgment
This work was supported by a grant from Sanofi.
Authors' Contributions
M.C.R. and R.A. designed the study. A.L. analyzed the data and wrote the article. M.C.R., R.A., D.P., and R.E.B. provided critical edits to the article. All authors reviewed and approved the final version of the article.
Author Disclosure Statement
R.A. reports advisory fees from Novo Nordisk and Sanofi and research support from AstraZeneca, Eli Lilly, Valeant, Janssen, and Senseonics. M.C.R. reports consulting/advisory fees from Medtronic, Dexcom, Sanofi, Zucara Therapeutics, and Lilly Innovation. None of the other authors has any conflicts of interest to report.