
Abstract
Background:
Type 2 diabetes mellitus (T2DM) affects ∼30 million people in the United States and ∼400 million people worldwide, numbers likely to increase due to the rising prevalence of obesity. We sought to design, develop, and validate PREDICT-DM (PRojection and Evaluation of Disease Interventions, Complications, and Treatments–Diabetes Mellitus), a state-transition microsimulation model of T2DM, incorporating recent data.
Methods:
PREDICT-DM is populated with natural history, risk factor, and outcome data from large-scale cohort studies and randomized clinical trials. The model projects diabetes-relevant outcomes, including cardiovascular and renal disease outcomes, and 5/10-year survival. We assessed the model validity against 62 endpoints from ACCORD (Action to Control Cardiovascular Risk in Diabetes), VADT (Veterans Affairs Diabetes Trial), and Look AHEAD trials via several comparative statistical methods, including mean absolute percentage error (MAPE), Bland–Altman graphs, and Kaplan–Meier curves.
Results:
For the comparison between simulated and observed outcomes of the intervention/control arms of the trial, the MAPE was 19%/25% (ACCORD), 29%/20% (VADT), and 42%/10% (Look AHEAD). The Bland–Altman's 95% limit of agreement was 0.02 (ACCORD), 0.03 (VADT), and 0.01 (Look AHEAD), and the mean difference (95% confidence interval) for the comparison between PREDICT-DM and trial endpoints was 0.0025 (−0.0018 to 0.0070) for ACCORD, −0.0067 (−0.0137 to 0.0002) for VADT, and −0.0033 (−0.0067 to 0.00002) for Look AHEAD, indicating an adequate model fit to the data. The model-driven Kaplan–Meier curves were similarly close to those previously published.
Conclusions:
PREDICT-DM can reasonably predict clinical outcomes from ACCORD and other clinical trials of U.S. patients with T2DM. This model may be leveraged to inform clinical strategy questions related to the management and care of T2DM in the United States.
Introduction
Type 2 diabetes mellitus (T2DM) is a chronic disease afflicting about 30 million Americans. 1 Although T2DM can cause short-term morbidity, its major consequences are due to complications that accumulate over time. 2 T2DM also has a substantial financial toll, with predicted direct medical costs of more than $200 billion in 2017. 1,3 With an ongoing obesity epidemic, an aging population, and 84 million U.S. adults with prediabetes, diabetes is likely to continue to contribute to morbidity, mortality, and escalating health care costs, 1,4 potentially affecting 21%–33% of the U.S. adult population by 2050. 5
While randomized controlled trials can test and answer hypotheses over months to years, many of the pressing clinical questions in diabetes require years to decades to answer. Moreover, due to the cost and logistical difficulties of lengthy clinical trials, many important hypotheses may never be tested or be tested in a trial that represents a single experiment with inherent limitations in generalizability. Simulation models may assist in forecasting the clinical outcomes of alternative care and policy strategies that cannot be clinically examined even in lengthy, large, and costly clinical trials; furthermore, these models can project longer term outcomes from the short-term endpoints on which such trials are powered. We sought to develop and validate a novel microsimulation model of T2DM natural history, disease progression, and treatment provision, the PRojection and Evaluation of Disease Interventions, Complications, and Treatments–Diabetes Mellitus (PREDICT-DM) model.
There are a number of existing simulation models of T2DM.
6
These models have been very helpful in informing policy questions regarding diabetes care in the United States and worldwide.
7
–9
Given substantial advances in T2DM care over the past two decades,
10
these models have been updated with new equations and calibration methods.
11
PREDICT-DM adds to the existing literature in the following ways: It incorporates what is already known about the natural history of T2DM and findings from the most recent randomized clinical trials, epidemiological studies, and meta-analyses into a novel state-transition Monte Carlo microsimulation model. It uses the Risk Equations for Complications Of type 2 Diabetes (RECODe) to estimate a patient-specific risk for cardiovascular and renal diseases for simulated patients.
12
RECODe is one of the newest sets of risk equations for complications of T2DM developed based on data from the Action to Control Cardiovascular Risk in Diabetes (ACCORD) trial conducted from 2001 to 2009.
13
When necessary, PREDICT-DM uses literature-based estimates to adjust the RECODe-driven probability of events over the simulation horizon. These events are not necessarily captured in RECODe but account, for example, for the elevated risk of a recurrent myocardial infarction (MI) and stroke within 12 months after a nonfatal event, and increased risk of atrial fibrillation (AF) and congestive heart failure (CHF) in the month following an MI event. While the simulation time typically advances annually in prior models, PREDICT-DM simulates events on a monthly cycle. A monthly cycle allows the model to capture specific events and their downstream costs more accurately (e.g., there is a substantially higher risk of CHF in the month following an MI), provides a more granular perspective on disease progression and outcomes, and enables validation to clinical trial or epidemiological data that report outcomes at different monthly time horizons (e.g., mean follow-up duration in ACCORD was 58 months).
14
Methods
Analytic overview
PREDICT-DM is a state-transition, Monte Carlo microsimulation model of patients with T2DM. The model follows individual simulated patients with different demographic, clinical, and behavioral characteristics through diabetes-specific clinical events. PREDICT-DM includes a series of modules, including MI, stroke, CHF, mortality from other cardiovascular diseases (CVDs), and nephropathy. Events within these modules are informed by the following: (1) patient demographics (e.g., age, gender, and race/ethnicity); (2) clinical variables, including hemoglobin A1c (HbA1c), systolic blood pressure (SBP), total cholesterol, serum creatinine (SCr), and CVD history; (3) use of any agents that alter event risk such as blood pressure-lowering agents, oral antiglycemics, statins, and anticoagulants; and (4) behavioral variables that currently include smoking (tobacco) status (current, former, or never smoker).
Each module is individually coded to consist of a set of mutually exclusive and collectively exhaustive health states of the related diabetes complication. Trial-informed equations are used to derive patient-specific transition probabilities between these states; disease progression is characterized by a sequence of monthly transitions from one health state to another. Natural history of clinical variables is modeled using longitudinal trial data on untreated patients (Supplementary Appendix A).
Each simulated patient's clinical course is tracked from model entry until either a defined follow-up duration (e.g., mean trial follow-up for validation exercises) or death, whichever occurs first. At this endpoint, individual summary statistics are recorded, and a new simulated patient enters the model. The run is complete when the last patient of a user-defined cohort size has passed through the model.
Model outcomes include 5/10-year survival as well as cardiovascular and renal outcomes, primarily selected for their association with diabetes and substantial impact on life expectancy. For validation purposes, we model the intervention and control arms, populated with baseline demographic parameters of three large clinical trials: the ACCORD trial, 13 the Veterans Affairs Diabetes Trial (VADT), 15 and the Action for Health in Diabetes (Look AHEAD) trial. 16 PREDICT-DM can account for both first- and second-order uncertainty. Although in the validation exercises, only the initial cohort characteristics were drawn randomly from probability distributions informed by the corresponding clinical trial. For categorical variables such as gender, race, ethnicity, smoking status, drug use, and history of CVD events, we used discrete distribution, and for continuous variables such as age, HbA1c, blood pressure, and cholesterol levels, we used normal distribution with the same mean and standard deviation reported in the trial.
The computer code was developed in Python programming language (Python Software Foundation,
Baseline risk of events
We use RECODe to estimate a “baseline risk” of experiencing MI, stroke, CHF, mortality from other CVDs, and progressing through nephropathy states for each simulated patient at model entry. 12 The RECODe updates older risk equations such as those in the UK Prospective Diabetes Study Outcomes Model 2 (UKPDS-OM2) 17 by using newer data on patients with T2DM to predict cardiovascular and microvascular outcomes. The equations were developed based on data from the ACCORD trial (2001–2009), 13 have been validated against other recent clinical trials of T2DM, 12,18 and have been shown to more accurately predict diabetes-relevant outcomes than older risk equations such as the UKPDS-OM2. 12 In RECODe, the most influential variables for cardiovascular outcomes are age, smoking, and CVD history. For microvascular outcomes (e.g., renal disease), the most influential variables are age, HbA1c, and SCr. Since PREDICT-DM simulates patients on monthly cycles, the 10-year risk of events obtained from the RECODe is converted to monthly probabilities in the model, assuming a constant risk. The patient-specific baseline risk for diabetes-related events for which the risk is substantially higher during certain periods—for example, recurrent MI/stroke within 12 months after a nonfatal MI/stroke, or development of AF and CHF in the month following an MI event—is adjusted over the simulation horizon via appropriate multipliers. Supplementary Table S1 in Supplementary Appendix B provides a complete list of variables included in PREDICT-DM and illustrates the variables included in each equation.
MI module
Structure
We consider four distinct states to model MI: no history of MI; history of MI; MI event; and MI-associated death (Table 1). Patients enter the model either with or without an MI history and may experience an MI event based on the patient-specific baseline MI risk calculated via RECODe (see Supplementary Table S1 for included variables). The month of an MI is captured to incorporate the intensity of resource utilization for future parameterization. After that month, the patient transitions either to having an MI history or death, based on the patient-specific MI fatality risk equation from Stevens et al., 19 calibrated to the MI fatality rate in ACCORD. 13
Transition Diagram and Probabilities Between Myocardial Infarction and Stroke States
ACCORD, Action to Control Cardiovascular Risk in Diabetes; AF, atrial fibrillation; MI, myocardial infarction; RECODe, Risk Equations for Complications Of type 2 Diabetes.
Existing literature suggests that the probability of a recurrent MI is higher in the first year following an MI event (“acute” period) compared with subsequent years. 20 –22 Given that the majority of ACCORD participants were not in the acute MI period at baseline, we increase the monthly MI risk calculated via RECODe using a literature-derived multiplier for a duration of 12 months after a nonfatal MI event. This risk ratio (multiplier) was derived from diabetes literature during the model development phase; it was not modified during validation exercises. We assume the fourth MI is uniformly fatal.
Input data
Based on the Kaplan–Meier survival curves for a coronary heart disease event reported in Lee et al., we estimated a risk ratio of 1.5 for the probability of a recurrent MI in the first year following an MI compared with subsequent years. We therefore estimate that patients are subject to a 50% increase in MI risk (i.e., multiplier = 1.5) during the first 12 months following a nonfatal MI event (Table 1). 20 The MI fatality risk obtained from the Stevens et al.'s equation was multiplied by a calibration multiplier of 0.11 to estimate the probability of death from an MI event.
Stroke module
Structure
Health states within the stroke module are as follows: no history of stroke; history of stroke; stroke event; and death from a stroke (Table 1). Patients with or without a history of stroke may experience a stroke event based on the patient-specific baseline stroke risk calculated via RECODe. Following a stroke event, the patient transitions to either having a stroke history or to death, based on the stroke fatality risk equation from Stevens et al., 19 calibrated to stroke fatality rate in ACCORD 13 (see Supplementary Table S1 for included variables).
Existing literature suggests that the probability of a recurrent stroke is higher in the first year following a stroke event (“acute” period) compared with subsequent years. 23 –27 Given that the majority of ACCORD participants were not in the acute stroke period at baseline, we leverage a literature-derived multiplier to increase the stroke risk obtained from RECODe for a duration of 12 months after a nonfatal stroke event. Moreover, because the RECODe stroke equation excludes the AF variable, we further increase the stroke risk for patients with AF (see the Supplementary Appendix C for further details). 28 –30 As with MI, we assume the fourth stroke is uniformly fatal.
Input data
An estimated risk multiplier of 2.35 was used to account for the increased risk of a recurrent stroke during the first 12 months following a nonfatal stroke event (Table 1). 25 The stroke risk for patients with AF is fourfold at baseline. 28,31 We assume that the combined effect of multiple risk factors (i.e., ≤12 months since the last stroke and AF) is equal to the maximum of the individual effects.
CHF module
Structure
Simulated patients can develop CHF at any month according to the baseline risk obtained from RECODe; in the month of an MI event, the model diverges from RECODe and subjects patients to a substantially higher risk of developing CHF (“acute CHF time”). 32 –34 On the development of CHF, the patient is randomly assigned either reduced or preserved ejection fraction (HFrEF and HFpEF, respectively) with equal probabilities, as found in prior literature. 35 –40 The death rate from either type of CHF is informed by a monthly probability from the diabetes literature. 41
Input data
Based on ACCORD data, we estimate that patients have 6.5% probability of developing CHF during the month of MI. Once CHF develops (either during, before, or after the acute period), the monthly probability of CHF-related death is 0.33% (HFrEF) or 0.13% (HFpEF). 41
Mortality from other CVD modules
PREDICT-DM accounts for CVD deaths due to conditions other than MI, stroke, and CHF, such as arrhythmia, fatal CVD procedure, and other CVDs. Each patient in our model is subject to a risk of “other CVD deaths” in each month of the simulation, informed by the cardiovascular mortality equation of RECODe, calibrated to the other CVD fatality rates in ACCORD (calibration multiplier = 0.3) to prevent double counting of CVD mortality (see the Supplementary Appendix D for further details). 13
Nephropathy module
Structure
We model the progression of diabetic renal disease by modeling the trajectories of relevant variables, including glomerular filtration rate (GFR), SCr, and urine albumin-to-creatinine ratio (UACR). GFR trajectories are estimated using findings from the diabetes cohort of the Atherosclerosis Risk in Communities (ARIC) study, 42 in particular, the results reported by Warren et al. 43 Risk factors for a steeper GFR decline include black race, SBP ≥140 mmHg, HbA1c ≥9%, insulin use, and current tobacco smoking. 43 SCr is calculated from a patient's age, race, gender, and estimated GFR in each simulation month using the four-variable MDRD study equation. 44 UACR progression is modeled using the RECODe for microalbuminuria (UACR 30–300 mg/g or 3.4–34 mg/mmol) and macroalbuminuria (UACR >300 mg/g or >34 mg/mmol). End-stage renal disease (ESRD) is defined as an estimated GFR level ≤15 mL/min/1.73m2. 45 Once ESRD is reached, the simulated patient initiates dialysis or receives a kidney transplant and is subject to an age- and gender-specific monthly probability of death derived from the U.S. Renal Data System (USRDS) data. 46 This death probability then supplants the probabilities of death from CVD (RECODe and Stevens et al.'s equations) and non-CVD causes (modified life tables, see the Deaths Not Related to Cardiovascular or Renal Disease section) in the non-ESRD population in our simulation model, since those equations no longer apply. For patients who die after ESRD is reached, the cause of death (MI, stroke, CHF, other CVDs, or other causes) is modeled based on USRDS data. 46
Input data
We estimate that GFR declines by 1.5 mL/min/1.73m2 per year for T2DM patients with no risk factors. 43 Additional GFR decline per year is accumulated for black race (0.8), SBP ≥140 mmHg (1.0), HbA1c ≥9% (0.7), insulin use (1.1), and current tobacco smoking (0.6). 43 A patient with ESRD is assumed to receive either dialysis (82.3%) or transplant (17.7%). 46 Supplementary Table S2 in Supplementary Appendix E provides the estimated age- and gender-specific probability of death for patients with ESRD. Supplementary Table S3 provides cause of death probability for patients who die after ESRD is reached.
Deaths not related to cardiovascular or renal disease
To estimate the competing risk of death for reasons other than CVD and renal disease, we leveraged the life tables of the Centers for Disease Control and Prevention. 47,48 Examples of such deaths include cancer, accidents, chronic lower respiratory diseases, Alzheimer's disease, influenza and pneumonia, HIV, nephritis, nephrotic syndrome, and nephrosis. We subtracted deaths due to CVD and renal disease from the aggregated rates and adjusted them for smoking status (never, former, or current) based on risk ratios and proportion in each smoking status stratification. 49 –52 We assume the probability of death is 1.0 for the rare simulated patient who reaches 100 years of age.
Intensive versus standard glycemic control
Because RECODe excludes a variable for intensive versus standard glycemic control, the probabilities obtained from RECODe best represent an average risk for a given trial patient. However, diabetes outcomes may differ depending on the intensity of glycemic control, particularly for microvascular outcomes. 53 In PREDICT-DM, we adjust the transition probabilities of MI, death from an MI event, stroke, death from a stroke event, other cardiovascular deaths, microalbuminuria, and macroalbuminuria for patients receiving intensive versus standard glucose control using literature-derived risk ratios. 54 –57 Supplementary Table S4 in Supplementary Appendix F provides the multipliers used within PREDICT-DM to adjust risk of events for intensive versus standard glycemic control.
Model verification and validation
Verification
We performed extreme value analysis throughout the model development process for the purpose of debugging. We also conducted model verification exercises to assess the face validity of projected outcomes in several cohorts with different stages of diabetes disease progression. In Supplementary Appendix G, we report the outcomes of two such cohorts (Supplementary Table S5).
Internal and external validation
Our internal validation exercises assess the consistency of outcomes projected by the PREDICT-DM with those observed in the intensive (target HbA1c <6%) and standard glycemic control (target HbA1c 7.0%–7.9%) arms of ACCORD. 14 ACCORD is a randomized, double two-by-two factorial design trial that recruited patients with T2DM in the United States and Canada (mean age 62 years, CVD history 35%, mean HbA1c 8.3%). We pool results across both blood pressure and lipid trials. While we consider validation against ACCORD “internal validation” because the RECODe is derived from ACCORD, one should not expect PREDICT-DM to precisely replicate the results of ACCORD. This is because PREDICT-DM uses other equations, parameters, and multipliers that are not informed by ACCORD data.
We then externally validated PREDICT-DM against the VADT 15 and the Look AHEAD 16 trials to ensure that PREDICT-DM adequately predicts the outcomes of a study not used to inform disease progression within the simulation model. VADT is a randomized clinical trial of T2DM patients (mean age 60 years, CVD history 40%, mean HbA1c 9.4%), in which subjects were similarly randomized to receive either standard or intensive (target HbA1c 1.5%, points absolute reduction compared with the standard therapy group) glycemic intervention. VADT was chosen because it is a U.S.-based study akin to ACCORD, includes participants with similar, although slightly longer duration of T2DM, and reports both microvascular and macrovascular outcomes. Look AHEAD is a randomized clinical trial of T2DM patients (mean age 59 years, CVD history 14%, mean HbA1c 7.3%), in which patients with T2DM and obesity were randomly assigned to either a lifestyle intervention that promoted weight loss (intervention arm) or diabetes support and education (control arm). Look AHEAD is also a U.S.-based study, which was chosen because it includes participants with shorter duration of diabetes and reports long-term cardiovascular outcomes (median follow-up duration of 9.6 years).
For each validation exercise, we simulated a large cohort of patients with diabetes (size 1,000,000, selected to yield stable results) drawn randomly at model entry. We matched the baseline cohort characteristics, follow-up duration, and HbA1c trajectory to the trial (ACCORD, VADT, or Look AHEAD) and intervention arm (intensive or standard for ACCORD and VADT, lifestyle intervention or diabetes support and education for Look AHEAD). We compared the model results to the observed outcomes in the three trials to assess the accuracy of our model. We validated against the outcomes of any MI, fatal/nonfatal MI, any stroke, fatal/nonfatal stroke, any CHF, fatal CHF, CVD death, new-onset macroalbuminuria, any albuminuria, progression from micro- to macroalbuminuria, ESRD, and death from any cause. Not all outcomes of interest were reported in each trial.
Goodness of fit
We evaluated the accuracy of PREDICT-DM in projecting microvascular and macrovascular outcomes by systematically comparing predicted and observed endpoints using several statistical methods. First, as done in another T2DM model,
58
we calculated the mean absolute percentage error (MAPE), the median absolute percentage error (MEDAPE), and the root mean square percentage error (RMSPE) for model-predicted (X) and observed (Y) validation endpoints using the following equations (n = number of endpoints):
Lower values of percentage errors are desirable. We calculated these for the intervention and control arms of ACCORD, VADT, and Look AHEAD, as well as for cardiovascular, renal, and death outcomes of the three trials combined.
Second, we used Bland–Altman graphs to assess the means and differences between simulated and observed outcomes of ACCORD, VADT, and Look AHEAD. 59 These graphs are often used to compare multiple measurement methods of the same clinical variables. 60
Third, we calculated the intraclass coefficient (ICC) based on a two-way mixed-effects model to assess the agreement between model and trial. 61,62 We calculated separate ICC values and 95% confidence intervals (CIs) for the intervention and control arms of ACCORD, VADT, and Look AHEAD, as well as for cardiovascular, renal, and death outcomes of the three trials combined.
Finally, we plotted Kaplan–Meier graphs for different endpoints, stratified by intensive versus standard control of the ACCORD trial and VADT, and compared results with the corresponding curves from published studies. Kaplan–Meier graphs for individual endpoints of Look AHEAD were not available. Note that we did not have VADT's patient-level survival data to perform formal statistical tests.
We also completed a step-by-step validation checklist as recommended by the Assessment of the Validation Status of Health-Economic decision models (AdViSHE). 63 Please refer to the Supplementary Appendix H for more details.
Results
Validation overview
A total of 62 validation endpoints were simulated across the intervention and control arms of ACCORD (24 endpoints), VADT (24 endpoints), and Look AHEAD (14 endpoints) using PREDICT-DM (Table 2). The model overpredicted (indicated by bold) nonfatal stroke and fatal CHF and underpredicted (indicated by italics) macroalbuminuria and CVD death in ACCORD. Fatal MI was slightly overpredicted in ACCORD's standard control group but was within the CI in the intensive group. The model performed well in predicting other CVD events, ESRD, and death from all causes in ACCORD. In VADT, the model modestly overpredicted MI and stroke, and underpredicted CHF events, but was consistent on those events that were fatal. In Look AHEAD, PREDICT-DM performed well in predicting all cardiovascular and death outcomes for the diabetes support and education arm but modestly overpredicted MI and all-cause mortality events for the lifestyle intervention arm. Overall, the model demonstrated consistent performance in predicting various diabetes outcomes across the intervention and control arms of the three trials.
Model Versus Trial Outcomes for Events in the Intervention and Control Arms of ACCORD (Top), VADT (Middle), and Look AHEAD (Bottom)
Trial numbers presented are means (95% CI) for the proportion of patients with the corresponding event. PREDICT-DM numbers are model-predicted outcomes for proportion of patients with the corresponding event; since we simulated large cohorts (size = 1 million), the lengths of CIs for PREDICT-DM outcomes are close to zero. Numbers shown in bold indicate where the model overpredicted outcomes; those in italics indicate where the model underpredicted outcomes, both compared with the 95% CI reported in the trial.
CHF, congestive heart failure; CI, confidence interval; CVD, cardiovascular disease; ESRD, end-stage renal disease; Look AHEAD, the Action for Health in Diabetes trial; PREDICT-DM, Projection and Evaluation of Disease Interventions, Complications, and Treatments–Diabetes Mellitus; VADT, Veterans Affairs Diabetes Trial.
Percentage error
Internal validation
For ACCORD's intensive control arm, the MAPE between PREDICT-DM and the trial was 19%, the MEDAPE was 20%, and the RMSPE was 23%. The MAPE, MEDAPE, and RMSPE measures between the model and the standard control arm of ACCORD were 25%, 16%, and 35%, respectively.
External validation
For VADT's intensive control arm, the MAPE between simulated and observed outcomes was 29%, the MEDAPE was 29%, and the RMSPE was 32%. The MAPE, MEDAPE, and RMSPE measures between the model and the standard control arm of VADT were 20%, 21%, and 24%, respectively. For Look AHEAD's lifestyle intervention arm, the MAPE between PREDICT-DM and the trial was 42%, the MEDAPE was 21%, and the RMSPE was 70%. The MAPE, MEDAPE, and RMSPE measures between the model and the diabetes support and education arm of Look AHEAD were 10%, 5%, and 14%, respectively. When stratified by event type, the MAPE between model and trial was 28%, 27%, and 15% for CVD, renal, and death outcomes of ACCORD, VADT, and Look AHEAD combined (Table 3).
Summary Measures of Goodness of Fit for Outcomes of Intervention and Control Arms of ACCORD, VADT, and Look AHEAD, As Well As for Cardiovascular, Renal, and Death Outcomes of the Three Trials Combined
An ICC above 90% (70%) is often regarded as excellent (good) agreement between model and trial. 55
ICC, intraclass coefficient; MAPE, mean absolute percentage error; MEDAPE, median absolute percentage error; RMSPE, root mean square percentage error.
Bland–Altman plot
Internal validation
The Bland–Altman plot for the comparison between PREDICT-DM and ACCORD endpoints demonstrated minimal differences for most endpoints (Fig. 1A). The 95% limit of agreement was 0.020, and the mean difference (95% CI) was 0.0025 (−0.0018 to 0.0070), indicating an adequate model fit to the data.
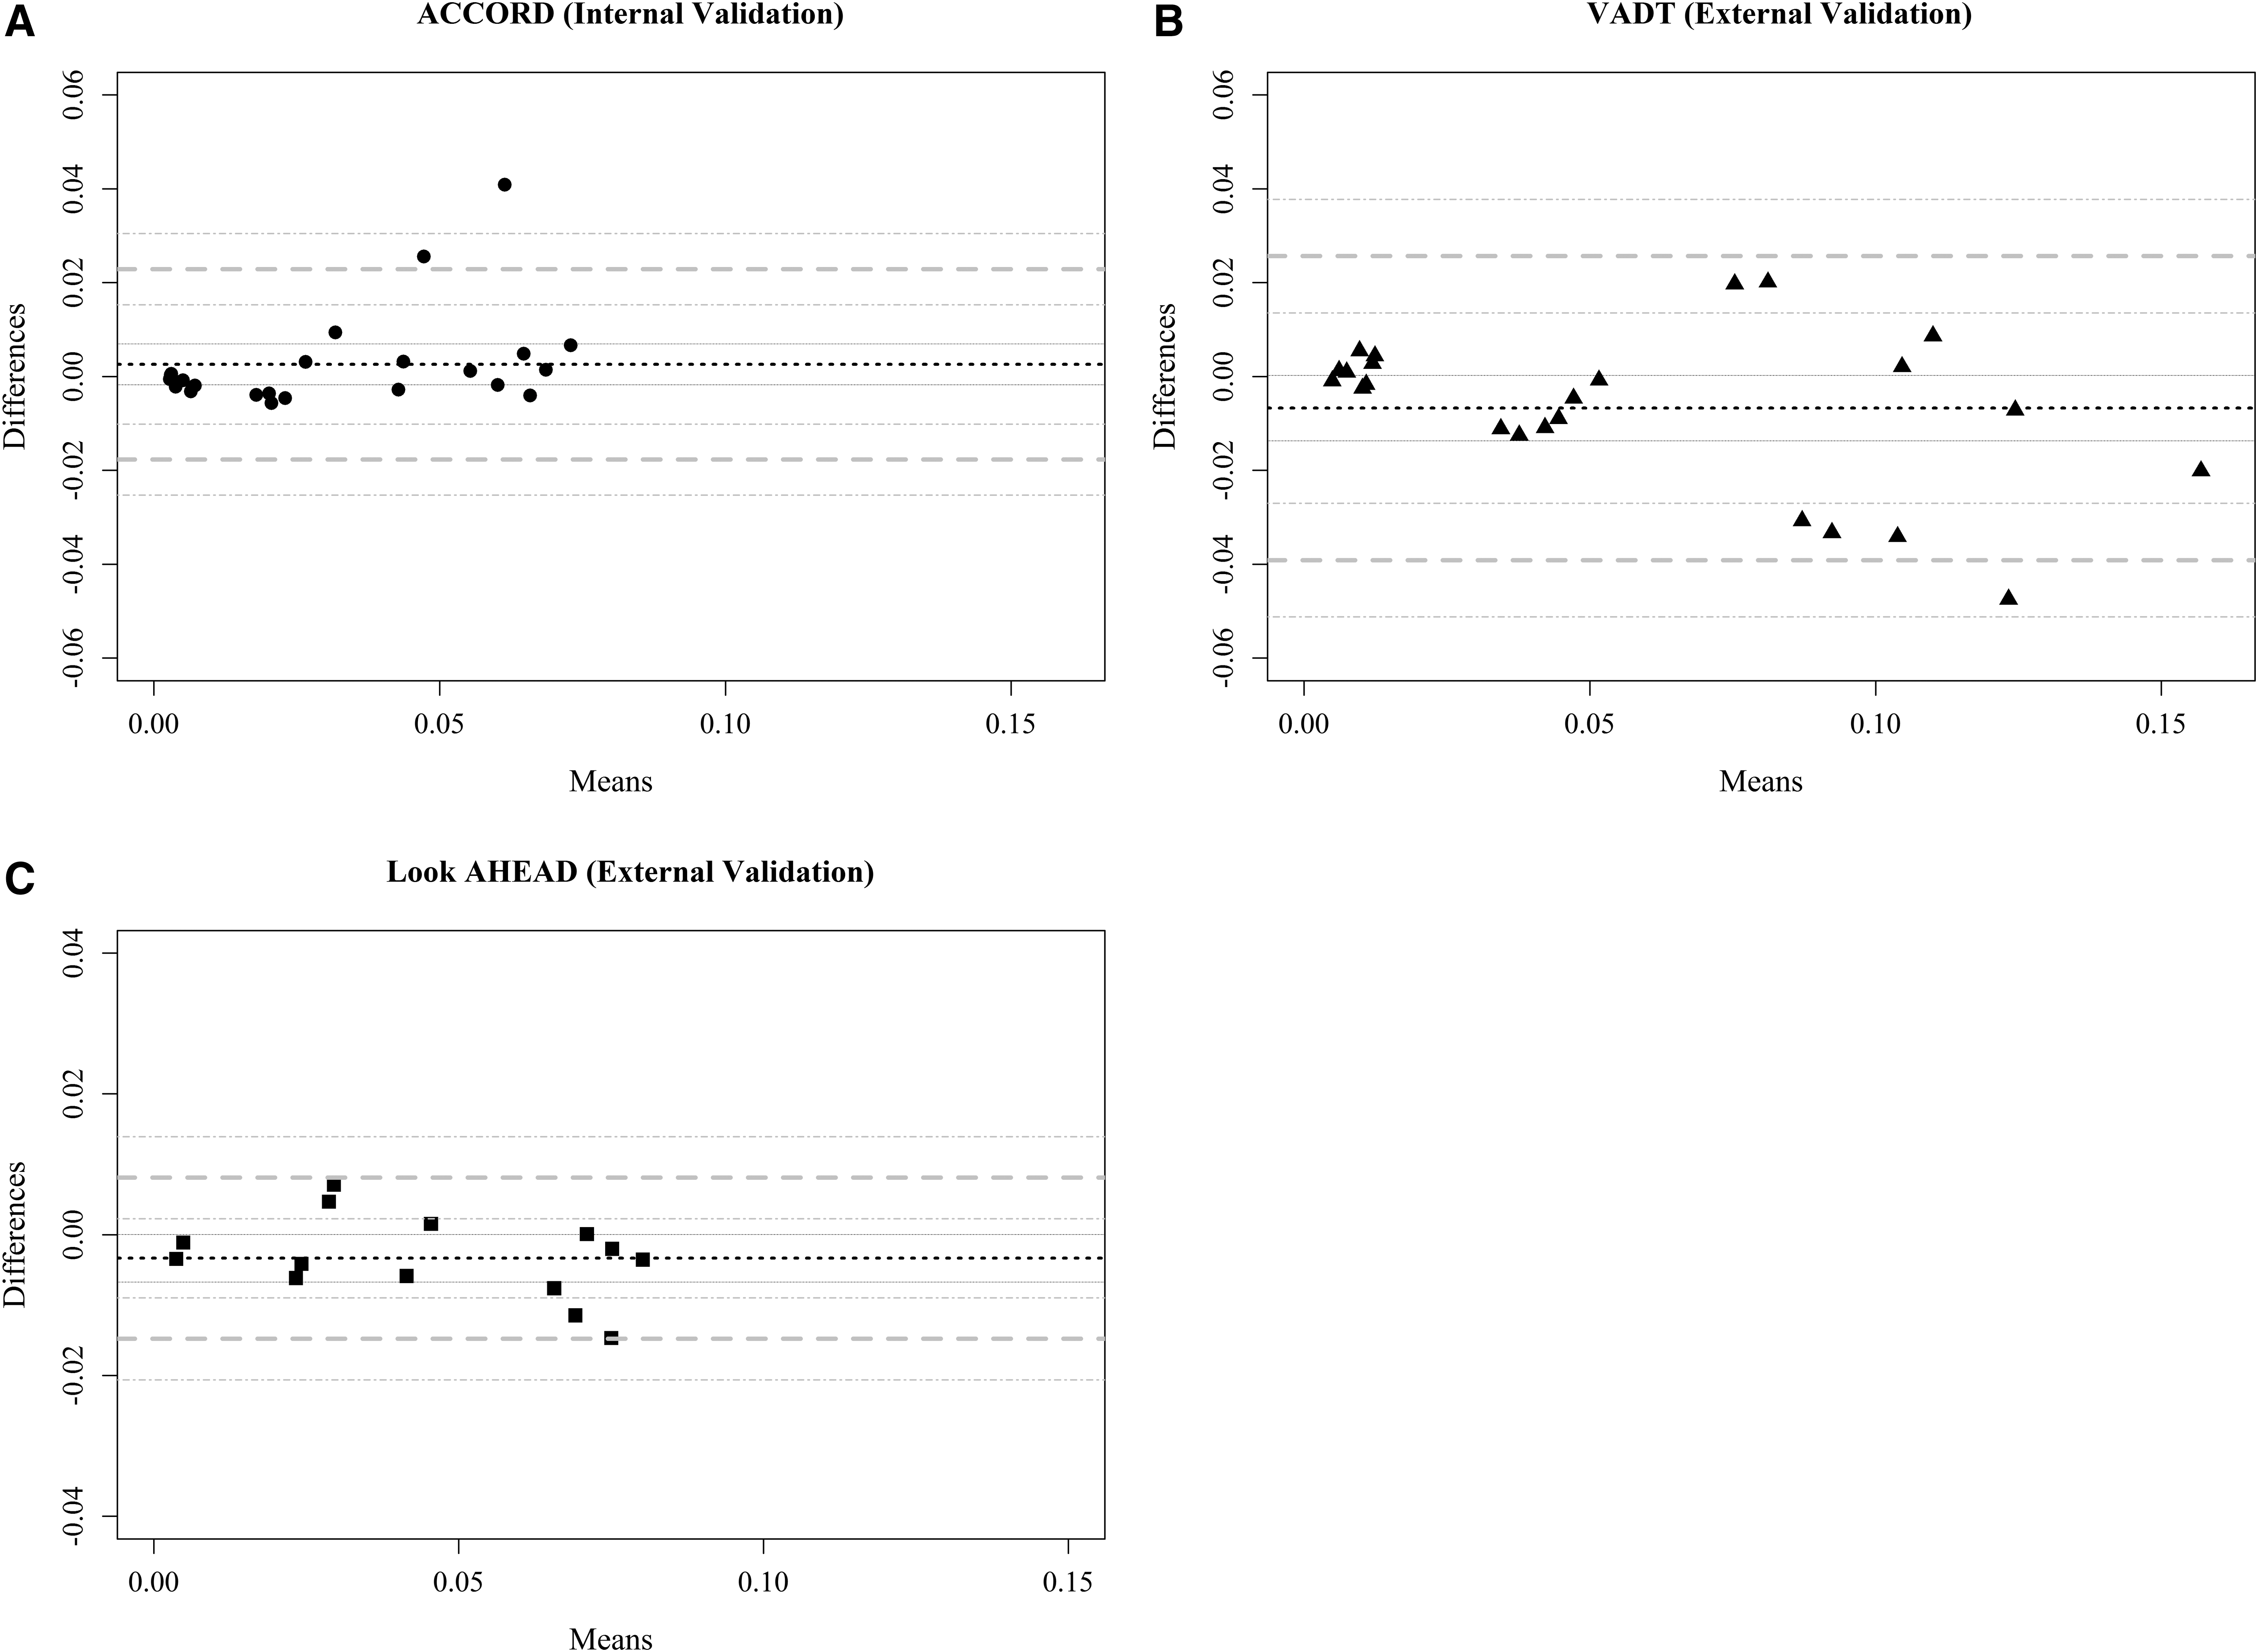
The Bland–Altman plot for outcomes of ACCORD, VADT, and Look AHEAD. The Bland–Altman plot for differences between model (predicted) and trial (observed) outcomes of ACCORD
External validation
The Bland–Altman plot for the comparison between model-predicted and VADT outcomes demonstrated similar results. The 95% limit of agreement was 0.032, and the mean difference (95% CI) was −0.0067 (−0.0137 to 0.0002) (Fig. 1B). For the comparison between PREDICT-DM and Look AHEAD outcomes, the 95% limit of agreement on the Bland–Altman plot was 0.011, and the mean difference (95% CI) was −0.0033 (−0.0067 to 0.00002) (Fig. 1C), similarly demonstrating that the model-predicted outcomes are close to those observed in the trial.
Intraclass coefficient
Internal validation
The ICC (95% CI) between simulated and observed outcomes of ACCORD was 0.94 (0.82–0.98) for the intensive and 0.90 (0.70–0.97) for the standard glucose control arm.
External validation
For VADT endpoints, the ICC (95% CI) between model and trial was 0.89 (0.66–0.97) for the intensive and 0.96 (0.89–0.99) for the standard control arm. For Look AHEAD, the ICC (95% CI) between simulated and observed outcomes was 0.95 (0.61–0.99) for the lifestyle intervention and 0.99 (0.97–0.999) for the diabetes support and education arm. When stratified by event type, the ICC between model and trial was 0.95, 0.91, and 0.97 for CVD, renal, and death outcomes of ACCORD, VADT, and Look AHEAD combined (Table 3).
Kaplan–Meier graphs
Internal validation
There were no statistically significant differences between Kaplan–Meier plots of PREDICT-DM versus ACCORD for the primary outcome (nonfatal MI/stroke or CVD death) for intensive (P = 0.69) and standard (P = 0.51) control arms. For death from any cause, our Kaplan–Meier curve was close to the trial curve for intensive (P = 0.89, Fig. 2A) but not the standard arm (P = 0.003, Fig. 2B).
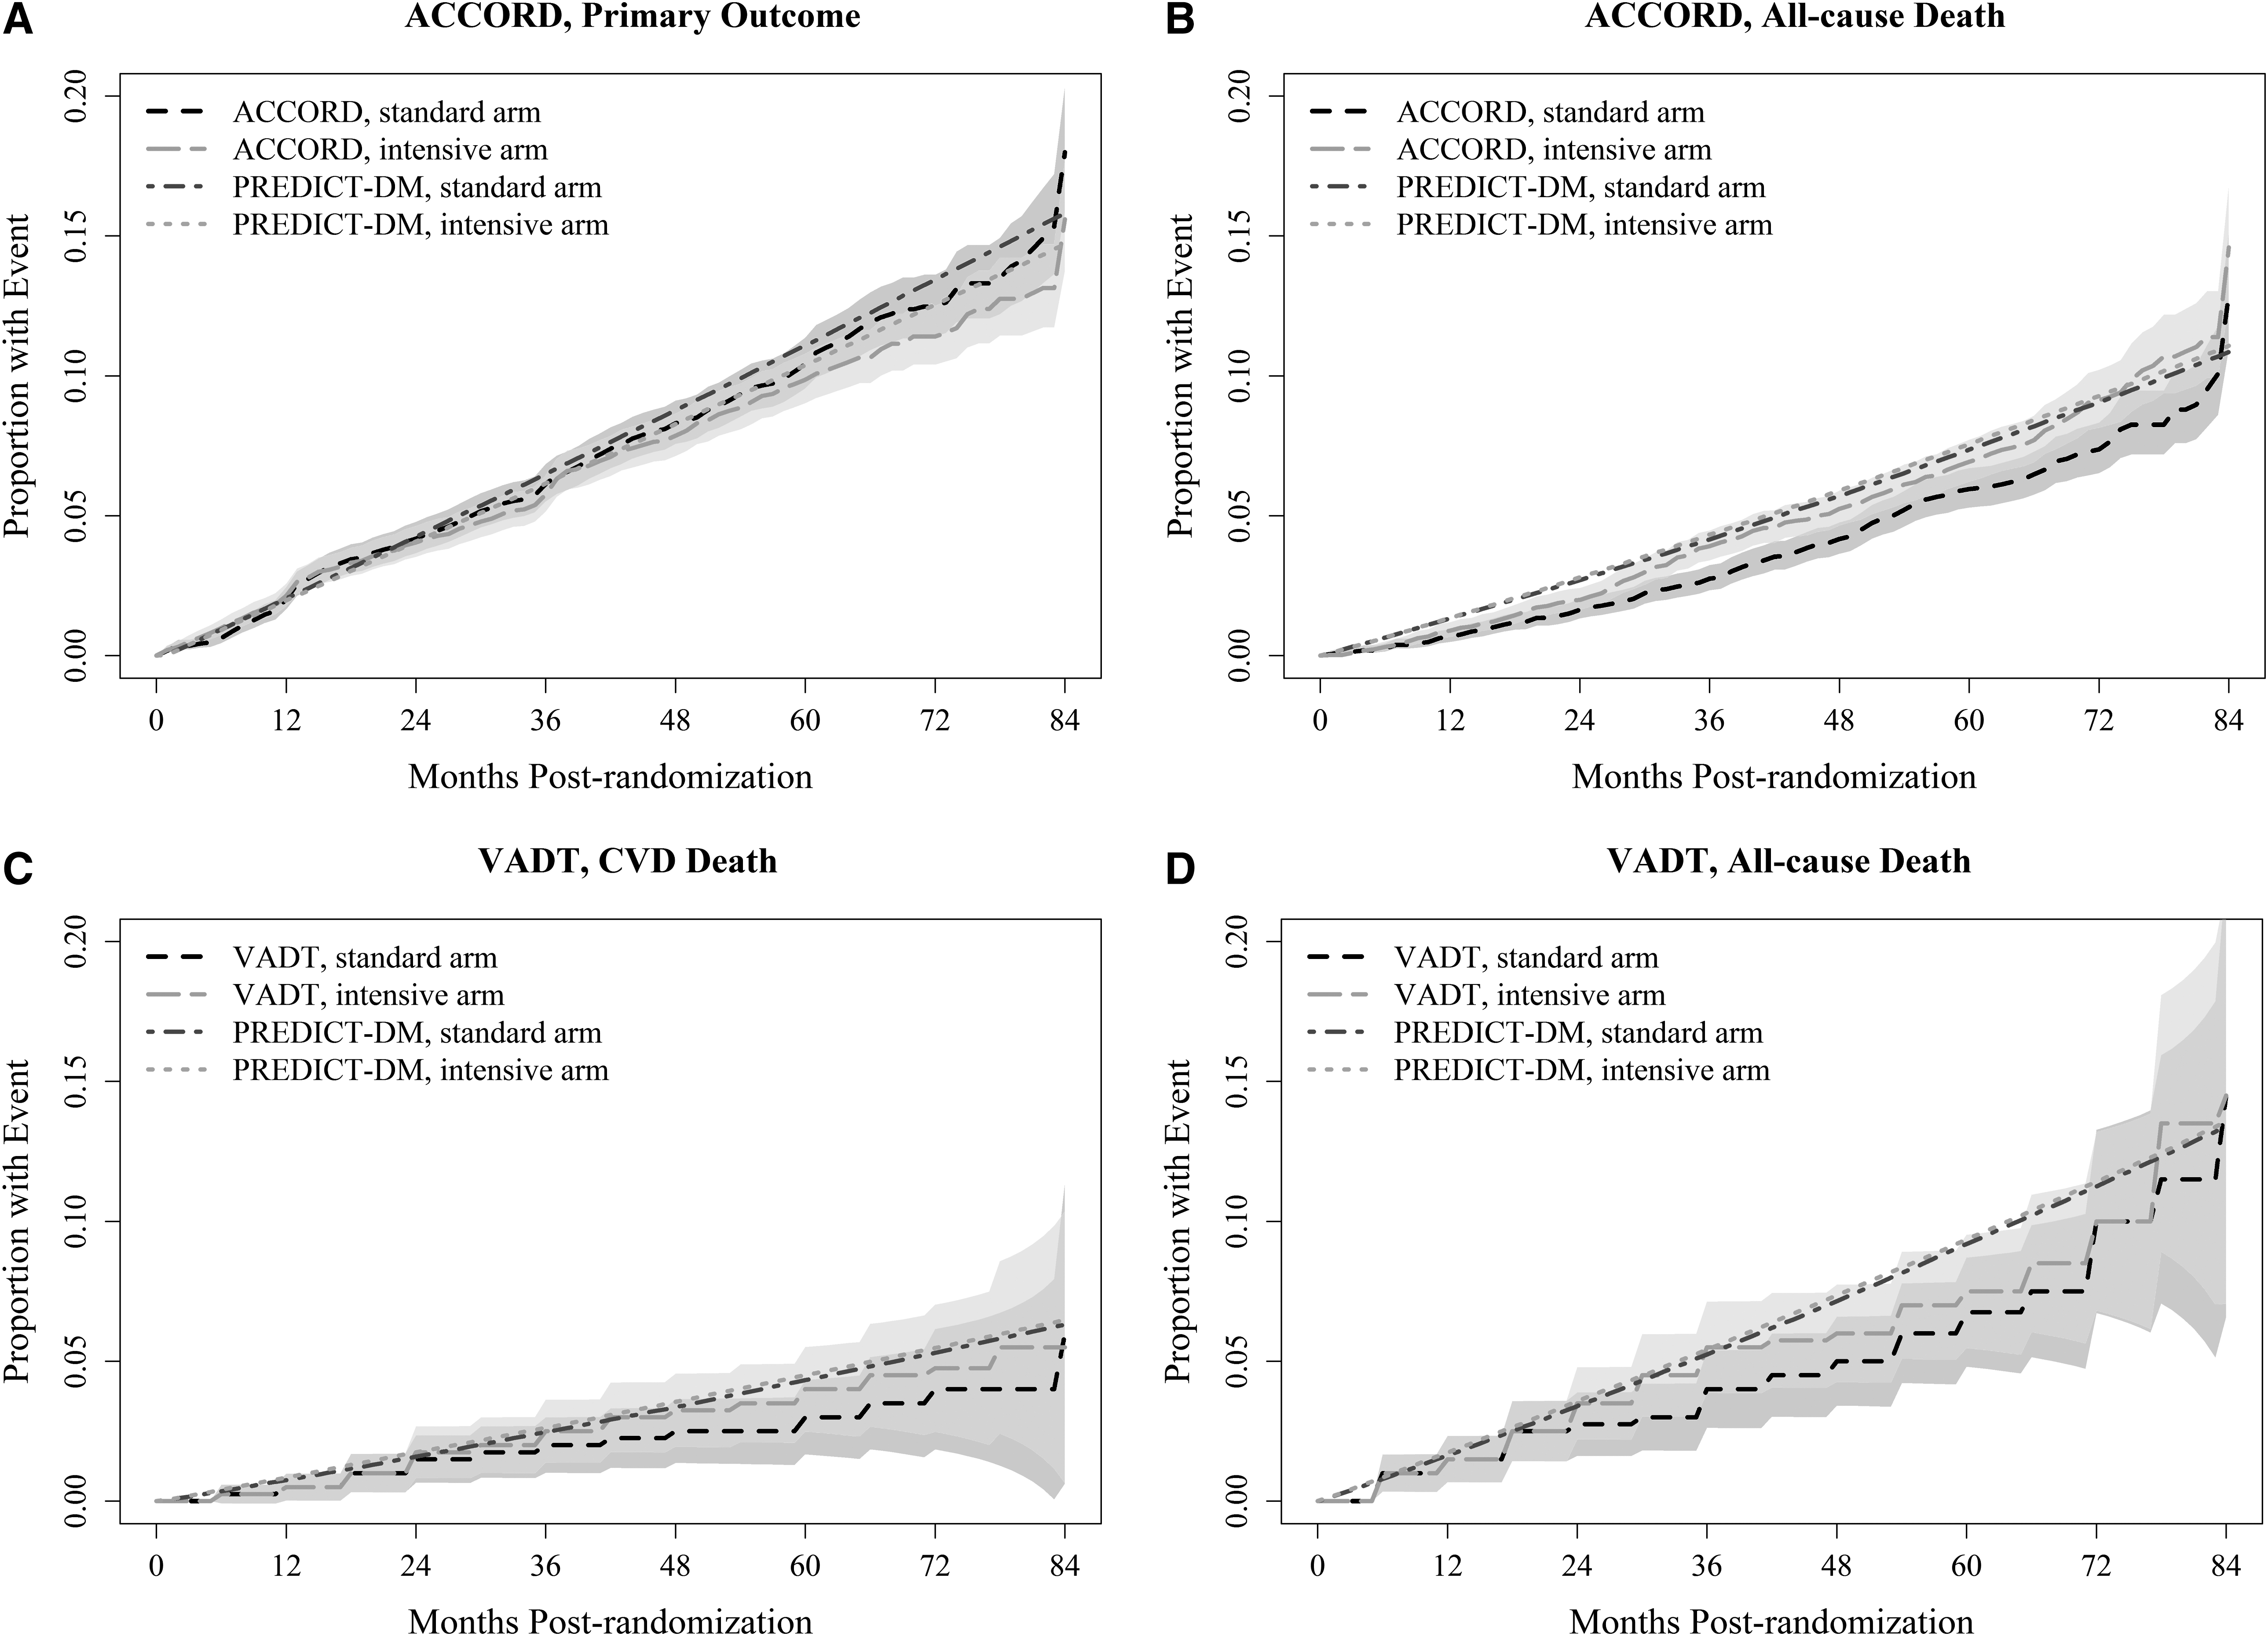
Kaplan–Meier graphs from trials versus PREDICT-DM. Kaplan–Meier graphs for PREDICT-DM and the trial for ACCORD's primary outcome (nonfatal MI/stroke or CVD death)
External validation
Kaplan–Meier graphs for CVD death and any-cause death for the two arms of VADT are similarly close to those of PREDICT-DM (Fig. 2C, D).
Discussion
We designed, developed, and calibrated PREDICT-DM, a new microsimulation model of T2DM progression and outcomes, incorporating recent U.S. data. The model simulates diabetes-related health events of patients with T2DM, adjusts risk of events over time, and reports outcomes, including 5- and 10-year survival, fatal and nonfatal MI, stroke, and CHF, ESRD, and death from cardiovascular and other causes.
PREDICT-DM uses the RECODe—one of the newest sets of equations to predict diabetes events developed based on recent U.S. data—at the heart of our microsimulation model to predict a baseline risk of events for each simulated patient. 12 The baseline risk is adjusted with disease progression and treatment intensification over the simulation horizon. Furthermore, PREDICT-DM simulates the progression of diabetes and its related complications on monthly cycles (as opposed to yearly cycles), which is necessary to accurately model the risk and cost burden of particular T2DM-related events for which monthly data are available. For instance, the risk of AF is substantially higher in the month following an MI event 64 ; once in AF, the patient has an elevated risk (fourfold increase) of experiencing a stroke. 31 Similarly, the downstream cost of most cardiovascular events is 5–10 times higher during the first 3 months after the event. 65
Disease modeling guidelines encourage development of new disease models as new interventions, treatments, and care protocols are developed for a disease. 66 Moreover, consistency of policy recommendations across several models reinforces a policy decision as all models rely on some internal assumptions. Therefore, we believe PREDICT-DM is a novel and timely addition to the existing T2DM modeling literature.
Our validation results confirm that PREDICT-DM adequately fits the observed data from both the intervention and the control arms of ACCORD (internal validation), VADT (external validation), and Look AHEAD (external validation) and can accurately forecast important diabetes events. We chose VADT and Look AHEAD for external validation because of the heterogeneity in their participants, interventions, and follow-up durations and to evaluate the generalizability of the model. VADT recruited veterans (97% male) with established T2DM (mean duration of diabetes 11.5 years), randomized them to intensive or standard glycemic control with oral glucose-lowering agents or insulin, and followed them for a median of 5.6 years. Look AHEAD, on the contrary, recruited patients with T2DM and obesity (60% female) and a shorter history of diabetes (median duration of diabetes 5 years), randomized them to either an intensive lifestyle intervention that promoted weight loss or diabetes support and education, and followed them for a median of 9.6 years. Most predicted fatal outcomes and ESRD fell into the CI of the corresponding observed outcome. Due to the very large size of the ACCORD trial (>5000 participants per arm), ACCORD outcomes have narrow CIs, which make them harder to achieve.
In comparison with other T2DM models, the MAPE measure for PREDICT-DM versus ACCORD endpoints was 22% (combined over intensive and standard control arms), lower than the 33% error reported by one model 58 and the 83% error of another model. 67 Similarly, the MAPE measure for PREDICT-DM compared with VADT endpoints was 24%, lower than the 45% reported elsewhere 58 and similar to the 24% error of a previous model. 67 We could not find validation results against Look AHEAD for other T2DM models. Our ICC values were ≥89% for different outcomes; an ICC above 90% (70%) is often regarded as excellent (good) agreement between model and trial. 61 Kaplan–Meier curves from ACCORD and VADT were close to those of PREDICT-DM for important outcomes, except for all-cause death in ACCORD's standard glycemic control arm, which could be due to the unexpectedly low death rate in ACCORD's standard arm. 13 Our model predicted minimal to no difference in death rate for intensive versus standard glycemic control, as found in other trials. 53,56
Although a powerful model, PREDICT-DM has several key limitations. First, we do not yet model diabetic retinopathy and neuropathy. We chose to focus on complications that have the greatest impact on life expectancy (rather than the quality of life) in this earliest model version. Second, we currently do not model regression of albuminuria—for example, going from micro- or macroalbuminuria to normoalbuminuria—as has been reported in a number of trials. 55 Third, akin to most disease models, PREDICT-DM is developed based on and is validated to clinical trial data, which may not represent the general population. Further validation against data from epidemiological studies and primary clinics is needed to fully assess the predictive performance of the model. Moreover, second-order (parameter) uncertainty was not assessed in validation exercises but PREDICT-DM is built with that capacity for future analyses. Fourth, we currently do not model important cardiovascular events such as angina and cardiac revascularization, adverse events such as hypoglycemia, explicit treatment algorithms, and important cardioprotective effects of new drug classes. We plan to add these in future iterations of PREDICT-DM. Finally, we have created the model with resource utilization in mind but have not yet incorporated costs into our model. Using the time-invariant RECODe within PREDICT-DM makes the model more suitable for clinical decision-making. However, by directly modeling the impact of diabetes interventions on the risk of diabetes-related events, we can leverage the current structure of PREDICT-DM in the future for economic evaluation of diabetes interventions.
In summary, PREDICT-DM is a state-transition microsimulation model of T2DM that incorporates demographic, clinical, and behavioral variables and accurately predicts cardiovascular, renal, and mortality outcomes. We have assessed the performance of our model using multiple validation methods against two recent randomized clinical trials to ensure its predictive validity. Hence, PREDICT-DM is another reliable tool that can be leveraged to inform clinical strategy questions related to the management and care of patients with T2DM in the United States.
Footnotes
Acknowledgments
The authors thank Sanjay Basu and Seth A. Berkowitz for their kind help with RECODe for predicting the risk of diabetes-related complications. This article was prepared using ACCORD Research Materials obtained from the NHLBI Biologic Specimen and Data Repository Information Coordinating Center and does not necessarily reflect the opinions or views of the ACCORD or the NHLBI. Research reported in this publication was supported by the Boston Area Diabetes Endocrinology Research Center (BADERC) P30DK057521 Grant and the Steve and Deborah Gorlin MGH Research Scholar Award. The contents of this article are solely the responsibility of the authors and do not necessarily represent the official views of the National Institutes of Health, Massachusetts General Hospital, or Harvard University.
Author Disclosure Statement
No competing financial interests exist.
Supplementary Material
Supplementary Data
Supplementary Table S1
Supplementary Table S2
Supplementary Table S3
Supplementary Table S4
Supplementary Table S5
References
Supplementary Material
Please find the following supplemental material available below.
For Open Access articles published under a Creative Commons License, all supplemental material carries the same license as the article it is associated with.
For non-Open Access articles published, all supplemental material carries a non-exclusive license, and permission requests for re-use of supplemental material or any part of supplemental material shall be sent directly to the copyright owner as specified in the copyright notice associated with the article.