
Abstract
Background: Euglyca
® is a mobile application which we developed for children and adolescents suffering type 1 diabetes mellitus (T1DM) for calculation of the appropriate insulin bolus dose by importing in the equation carbohydrates, lipids, glucose levels, and personalized parameters. Aim of this study is to evaluate the efficacy of this application on patients' glycemic control and satisfaction.
Subjects and Methods:
Eighty children and adolescents (aged 13.5 ± 2.8 years old, mean ± standard deviation) with T1DM were included in the study and were randomly and equally assigned in two groups. Patients were asked to use Euglyca for the calculation of the bolus insulin dose in the E group and to pursue their routine calculations in the C group (controls). At baseline and at 3, 6, and 12 months following the initial visit, glycated hemoglobin (HbA1c) values, percentages of hypoglycemias, hyperglycemias, and normoglycemias were determined for each patient, while Diabetes Treatment Satisfaction Questionnaire (DTSQ) was used to assess patients' treatment satisfaction at baseline and at 6 and 12 months.
Results:
Children and adolescents in the E group had a statistically significant decrease in HbA1c values and increase in percentages of normoglycemias and DTSQ scores, in comparison to children and adolescents in the C group. In the E group, a statistically significant positive linear correlation was found between DTSQ score and percentages of normoglycemias and a statistically significant negative correlation between changes in percentages of normoglycemias (Δnormoglycemias) and changes in HbA1c (ΔHbA1c).
Conclusions:
The use of the mobile application Euglyca contributes to the improvement of glycemic control and treatment satisfaction of children and adolescents with T1DM.
Introduction
Diabetes mellitus (DM) is a highly prevalent chronic disease worldwide. 1 The level of glycemic control is directly associated with long-term DM complications. 2 In recent years, many therapeutic modalities have been developed aiming at a personalized approach for improvement of glycemic control. 3 Frequent self-monitoring of blood glucose, counting of carbohydrates, meal logs, and activity trackers are fundamental elements of this approach. 4,5
Mobile phones, having been integrated in daily life of all age groups, could combine all these elements in a mobile application. A medical application for DM could remove the burden of complicated calculations, handwritten logbooks, and long-lasting search for evaluation of the nutritional content of foods. In addition, it could strengthen a personalized treatment approach and improve patient's quality of life and glycemic control.
Although many applications designed to achieve these goals have reached the market, few data exist regarding their efficacy and safety. In the sensitive age group of childhood and adolescence these data are scarce. 6 More specifically, Klee et al., 7 Kowalska et al., 8 Goyal et al., 9 and Foltynski et al. 10 assessed the effect of applications developed for children and adolescents with type 1 DM (T1DM). Among them, only Goyal et al. evaluated glycemic control and treatment satisfaction of patients for a 1-year observational period.
Currently, carbohydrates are considered the predominant macronutrient affecting postprandial glucose control and major determinant for calculating mealtime insulin dose in T1DM. 10 Emerging evidence from recent research and the use of continuous glucose monitoring have shown that other nutritional elements of food, such as fat, can significantly affect postprandial glucose excursions. 11 –13 American Diabetes Association (ADA) recommends that diabetics who master carbohydrate counting should receive education on the glycemic impact of fat content as well. 10
Thus, the need for alternative mealtime insulin dosing algorithms, which would include fat food content in their calculations, emerges. Practical approaches to take into consideration these findings for improvement of glycemic control are not successful as yet. Among others, this is due to interindividual differences in response to dietary fat, patients' dietary habits, and glycemia targets. Thus, all this information must be evaluated in a case-by-case basis and include the lipid factor for a fair control of T1DM. 12
To bridge this gap, we developed the mobile application Euglyca ® which intends to provide high quality data regarding safety and efficacy. Euglyca is a mobile application, which calculates the appropriate insulin bolus dose by importing in the equation carbohydrates, lipids, glucose levels, and personalized parameters. Thus, in this prospective randomized open-label controlled study, the safety and efficacy of this application were evaluated on parameters of diabetic children's and adolescents' glycemic control and treatment satisfaction.
Subjects and Methods
Subjects
This randomized, prospective, open-label controlled clinical trial was conducted in a university pediatric endocrinology clinic. The protocol was approved by the Ethics Committee of the Aristotle University in Thessaloniki, and the study was in accordance with the Code of Ethics of the World Medical Association (Declaration of Helsinki) for experiments involving humans. The present study is registered in
Children and adolescents (7–17 years old) with T1DM who visited consecutively this clinic between April and September 2017 were asked to participate in the study provided they owned an Android smartphone and were familiar with its use. Patients were included after one of their parents or their legal guardian signed an informed consent. Inclusion criteria were as follows: (1) Treatment with multiple daily injections or continuous subcutaneous insulin infusion (CSII). Patients using CSII in the E group were instructed to use Euglyca instead of bolus wizards, while patients on CSII in the C group continued as they used to; (2) satisfactory knowledge of the concept of carbohydrate and lipid counting acquired from previous training by the physicians and nutritionist of the department, including the insulin correction factor and carbohydrate factor.
Exclusion criteria were as follows: (1) Use of another medical application for T1DM in the previous 3 months; and (2) lack of capacity of reading Greek. Eighty patients were finally eligible to participate in the study. They all consented to participate in the study. Subsequently, they were randomized in two equally numbered groups by drawing one of two nontransparent envelopes which contained one ticket inscribed with either an E (for Euglyca group) or a C (for Control group) (Fig. 1). To ensure equal allocation rates within the two groups, block randomization was used. Patients' anthropometrics and disease characteristics are reported in Table 1.

Flow diagram of the progress through the phases of the study in the two groups.
Characteristics of Study Participants
Data are reported as mean ± SD.
P values refer to either t-test for continuous variables or chi square test for categorical variables.
CGM, continuous glucose monitoring; CSII, continuous subcutaneous insulin infusion; MDI, multiple daily injections; SD, standard deviation.
Protocol
At baseline (first visit), patients randomized to the E group were advised to download the Euglyca application on their smartphones and they were asked to use the application for the calculation of the bolus insulin dose they were injected. Patients randomized to the C group were advised to calculate bolus insulin dose they were injected, the way they used to. Patients repeated their visit to the endocrine pediatric clinic at 3 (second visit), 6 (third visit), and 12 (fourth visit) months, the latter set as the terminal time point of the study. All patients were instructed to perform at least seven measurements each day and record them (before every meal, before sleep, and during the night resulting in 2–3 h difference between the measurements). In cases of physical activity, disease, serious hypoglycemia, or hyperglycemia, certain patients were even performing more than seven measurements per day on their proper initiative.
Patients' compliance to the use of the application was not based on the data imputed into the application. A technical issue in the application's record display function did not permit this action at the time of the study. However, patients in the E group had to record on their own any bolus dose calculation they carried out without using Euglyca. During every follow-up visit patients and their parents were asked to present these records and report patients' compliance with the Euglyca use. At all four visits, anthropometrics (weight, height, BMI), blood pressure measurement, and heart rate were noted down, while a peripheral blood sample was drawn from all patients in the morning of each visit after an overnight fast for measurement of glycemia and glycated hemoglobin (HbA1c) values.
All blood glucose values recorded from the patients or downloaded from their glucose meters following the previous follow-up visit were reviewed in the next one, and the percentage of normoglycemic, hypoglycemic, and hyperglycemic episodes during the preceding trimester was calculated for each patient. Percentages of normoglycemia, hypoglycemia, and hyperglycemia were calculated by dividing the normoglycemic, hypoglycemic, and hyperglycemic events over the total number of blood glucose measurements. Glucose measurements between 70 and 180 mg/dL were categorized as normoglycemia; any glucose measurement below 70 mg/dL was categorized as hypoglycemia; glucose measurements at 2-h postprandial measurement found above 180 mg/dL were categorized as hyperglycemia. At each follow-up visit, patients were instructed to evaluate the performance of their glucose meter by comparing its result to that measured by the biochemical laboratory on the same venous blood sample.
At baseline (first visit), at 6 (third visit) months, and 12 (fourth visit) months, all patients filled the World Health Organization-Standard Diabetes Treatment Satisfaction Questionnaire (DTSQ). The latter is a valuable tool designed to evaluate changes in satisfaction according to changes in treatment regimen, appropriate also for comparing satisfaction levels in patients using different treatment regimens. The change of HbA1c values from baseline to 12 months visit for each group was set as primary outcome, while the percentage of normoglycemic, hypoglycemic, and hyperglycemic events during the preceding trimester of each visit was set as secondary outcome.
Biochemistry
HbA1c was determined by Siemens DCA Vantage point-of-care immunoassay analyzer (Siemens Health Care Diagnostics Ltd., Frimley, Camberley, United Kingdom) with intra- and interassay coefficients of variation (CV) 5% and 8%, respectively; glycemia was determined by glucose god/pap kit with intra- and interassay CVs 5.7% and 7.8%, respectively.
Euglyca application
Euglyca is a mobile application developed by two of the authors (C.C. and D.F.). The application contains a database of 7000 foods and food products met in Greek everyday cuisine, as well as the corresponding amount of carbohydrates and lipids for each of them. Subsequently, the amount of carbohydrates and lipids contained in a meal is calculated automatically by the application. Euglyca provides a structured approach for the calculation of the bolus insulin dose. By taking into consideration the amount of carbohydrates and lipids to be consumed, the preprandial and target postprandial glycemia concentrations, the insulin correction factor for the patient, the carbohydrate and lipid factors, the level of physical activity after the meal, and the active insulin (in case of CSII), Euglyca calculates the required bolus dose of insulin. All parameters can be adjusted any time of the day for any type of meal.
Insulin correction factor is calculated by dividing 1800 by the total daily dose (TDD) of insulin administrated to the patient. The resulting figure indicates the reduction of glycemia in mg/dL caused by 1 unit of rapid-acting insulin for the specific patient.
Carbohydrate factor (insulin-to-carbohydrate ratio) is calculated by dividing 500 by TDD of insulin and must be evaluated on a case-by-case basis. It represents the amount of carbohydrates expressed in grams metabolized by 1 unit of rapid-acting insulin. 14
Lipid factor (insulin-to-lipid-ratio) is influenced by marked interindividual differences in response to dietary fat. Patient's food and glucose records need to be evaluated on a case-by-case basis to determine the lipid factor. In general, lipid factor represents one third of the carbohydrate factor.
All these parameters need to be tailored to the patient's specific needs. More specifically, during follow-up visits patients' blood glucose records were reviewed and insulin correction factor, carbohydrate factor, and lipid factor were adjusted accordingly.
Physical activity
Euglyca includes a section of physical activity with a drop-down menu, providing the options of “no,” “mild,” “moderate,” or “intense” physical activity. For each separate option, examples are provided to be clear for the users, what each option represents.
Statistics
Sample size was determined by estimating the change in HbA1c values (primary outcome) based on previous studies, 7,8 assuming 0.5% reduction in values in the intervention group with 80% power and 5% significance level. Power calculation resulted in 14 patients per group, while the target of the study had been set at recruitment of 80 patients altogether. Results are reported as mean ± standard deviation for quantitative variables. The absolute difference in a quantitative variable between two different time points was defined as Δ.
All quantitative variables (HbA1c; ΔHbA1c; percentages of normoglycemic, hypoglycemic, and hyperglycemic events over the total number of glucose measurements; and DTSQ's scores) were normally distributed and they were compared between the two studied groups of patients at the different time points using General Linear Models analysis of variance (ANOVA) and Bonferroni post hoc test. Repeated measures ANOVA involved one factor between patients (factor “Group” with two levels) and one factor for the repeated measures within patients (factor “time” with four or three levels depending on the compared variable). Qualitative variables (gender and type of therapy) were compared using χ2 (chi square) test after having computed absolute and relative frequencies expressed as percentages; statistical significance was set at P < 0.05. An intention-to-treat analysis followed. IBM SPSS V23 Chicago software and open source software R 2.15.1 (The R Foundation for Statistical Computing) were used for statistical analysis.
Results
Eighty children and adolescents with T1DM were recruited in this study and were equally randomized in the E and C groups. Following randomization, there were no dropouts or exclusions of patients in any group. The study began in April 2017 and was completed in September 2018. According to patients' records and statements during the follow-up visits, the compliance rate to the use of Euglyca was 95% ± 2.5%. In addition, patients in the E group reported in average 7 (range: 6–10) blood glucose measurements per day and patients in the C group reported 7 (range: 6–11) blood glucose measurements per day (P = 0.784).
HbA1c values at baseline, 3, 6, and 12 months of the study period and differences Δ among them
HbA1c values in the two groups at the four time points of the study period and their comparisons are reported in Table 2. In the E group, HbA1c values were significantly different between baseline and either 3 or 6 or 12 months (P < 0.05; Table 2), while they did not between 3 and either 6 or 12 months, as well as between 6 and 12 months. HbA1c values in the E group were significantly lower than those in the C group at 3, 6, and 12 months of the study period (P < 0.05; Table 2). ΔHbA1c values between baseline and either 3 or 6 or 12 months were significantly greater in the E than in the C group.
Glycated Hemoglobin Values and Percentages of Normoglycemias, Hypoglycemias, and Hyperglycemias in the E and C Groups at Baseline, 3, 6, and 12 Months of the Study Period
Data are expressed in mean ± SD.
Statistical significance was set at P < 0.05. Data were analyzed using repeated measure ANOVA; Bonferroni correction was used as post hoc test.
The asterisk (*) denotes statistically significant difference between the E and C groups (P < 0.05).
The dagger (†) denotes statistically significant difference in the E group between baseline and either 3 or 12 months (P < 0.05).
ANOVA, analysis of variance; HbA1c, glycated hemoglobin.
Percentages of normoglycemias, hypoglycemias, and hyperglycemias at baseline, 3, 6, and 12 months of the study period and differences Δ among them
Percentages of normoglycemias, hypoglycemias, and hyperglycemias in the two groups at the four time points of the study period and their comparisons are reported in Table 2. In the E group, percentages of normoglycemias were significantly greater at 3, 6, or 12 months than at baseline (P < 0.05; Table 2), while they did not differ between 3 and either 6 or 12 months, as well as between 6 and 12 months. Percentages of normoglycemias were significantly greater in the E than in the C group at 3, 6, and 12 months of the study period (P < 0.05) (Table 2). Δpercentages of normoglycemias between baseline and either 3 or 12 months were significantly greater in the E than in the C group.
DTSQ results at baseline, 6, and 12 months of the study period and differences Δ among them
In the E group, DTSQ scores were significantly greater at 6 (29.1 ± 4.0) and 12 (29.3 ± 3.9) months than at baseline (26.8 ± 5.9) (P < 0.05), while they did not differ between 6 and 12 months. In the C group there was no significant difference in DTSQ scores between baseline (25.6 ± 5.8) and either 6 (26.1 ± 3.3) or 12 (25.9 ± 2.8) months. DTSQ scores were greater at 6 and 12 months in the E than in the C group (P < 0.05). ΔDTSQ scores between baseline and either 6 or 12 months were greater in the E than in the C group (P < 0.05).
Correlations among DTSQs, percentages, and Δpercentages of normoglycemias and ΔHbA1c
In the E group, a statistically significant positive linear correlation was found between DTSQ score and percentages of normoglycemias at 6 months of the study period (r = 0.45, P = 0.018) (Fig. 2A), while in the C group, no statistically significant linear correlation was found between DTSQ score and percentages of normoglycemias at any time point of the study period (Fig. 2B). In the E group, a statistically significant negative correlation between the changes in percentages of normoglycemias (Δnormoglycemias) and the changes in HbA1c (ΔHbA1c) from baseline to 12 months was found (r = −0.32, P = 0.008).
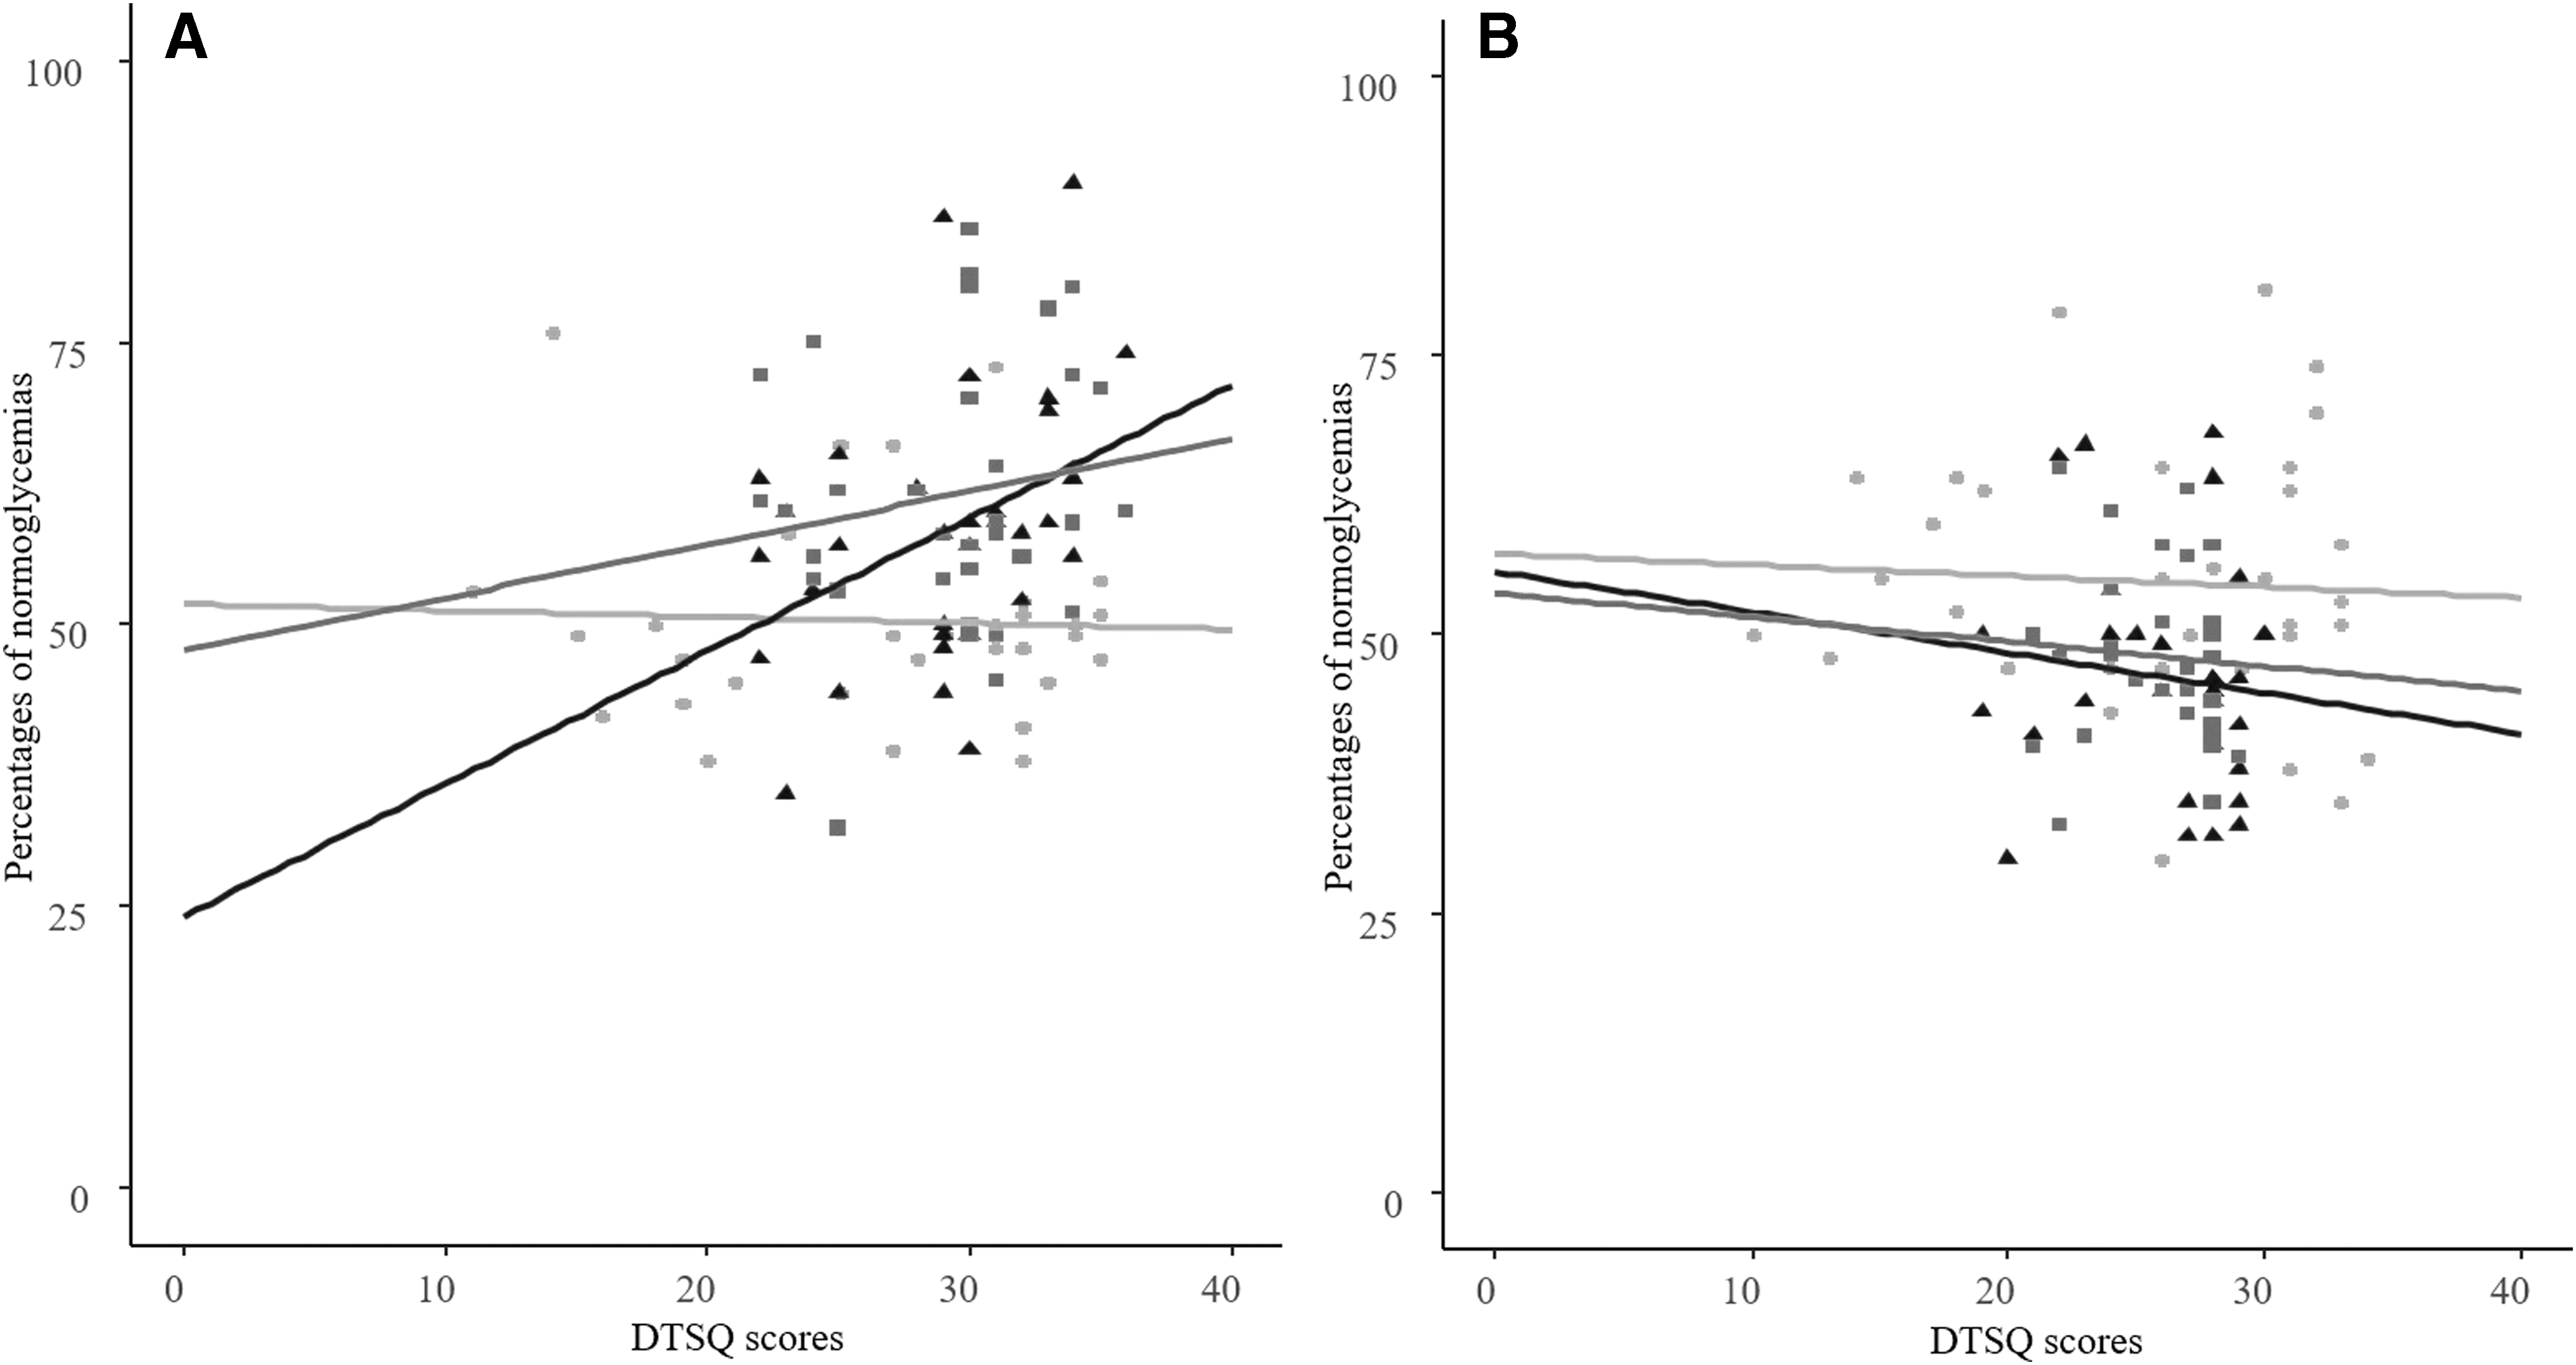
Scatterplot illustrating the linear correlation between percentages of normoglycemias and DTSQ scores in the E
Predictors
In the E group, no predictors were found when forward stepwise regression analysis was used to reveal potential predictors of the HbA1c values at 12 months (dependent variable) with baseline percentages of normoglycemias, hypoglycemias, and hyperglycemias, baseline HbA1c values, and baseline DTSQ score taken as independent variables.
In the C group, forward stepwise regression analysis was used to reveal potential predictors of the HbA1c values at 12 months in the C group (dependent variable) with baseline percentages of normoglycemias, hypoglycemias, and hyperglycemias, baseline HbA1c values, and baseline DTSQ score taken as independent variables. At baseline, percentages of hypoglycemias and hyperglycemias were found to be negative (P = 0.007; b = −0.22) and positive (P = 0.026; b = 0.13) predictors of the HbA1c values at 12 months, respectively.
Discussion
We found that patients in the E group presented with statistically significant lower HbA1c values compared to the C group at all time points of the 1-year study period except baseline. Subsequently, the difference ΔHbA1c between the HbA1c values at baseline and either 3 or 6 or 12 months of the study period was significantly greater in the E compared to the C group. Of note, at baseline, children and adolescents in both groups did not satisfy the recommended by the ADA glycemic target for HbA1c value (<7.5%), 15 while after the commencement of the study, this target was achieved only by children in the E and not in the C group.
When Klee et al. used an insulin bolus calculator mobile application, they reported a statistically significant decrease of HbA1c values in their target group at the third month of the study. 7 Kowalska et al. calculated the bolus insulin dose used for a specific food with a system composed by a dedicated USB kitchen scale and a computer software with a database of nutrients. Children, who used that system and were analyzed per protocol, observed a statistically significant reduction of their HbA1c values at 6 months and 2 weeks. However, in the intention-to-treat analysis there was no difference between the target and control groups. 8 In contrast, Goyal et al. developed a DM self-management mobile application, which they studied in a 12-month study. At their primary analysis, no statistically significant reduction in HbA1c values was found in the target group at 12 months of the study. However, they reported a significant reduction in HbA1c values in the subgroup of children self-monitoring their blood glucose ≥5 times daily. 9
In the present study, percentages of normoglycemias at 3, 6, and 12 months and Δpercentages of normoglycemias between baseline and either 3 or 12 months of the study were significantly greater in the E than in the C group. Kowalska et al., in per protocol analysis, reported an increase of normoglycemias at 6 months and 2 weeks of the study in children who used their system compared to those who did not. 8 Foltynski et al. developed a bolus calculator mobile application with automatic speech recognition. At 3 months of the study, they found an improvement of normoglycemias in the patients who used their application compared to those who did not. 10 In the present study, in the E group, Δpercentages of normoglycemias correlated negatively with ΔHbA1c during the entire duration of the study, suggesting that the observed decrease of HbA1c values to the target set by ADA was the result of the significantly greater number of normoglycemias in this group compared to those observed in the C group.
Furthermore, in the E group, at 6 and 12 months of this study, DTSQ scores were significantly greater than in the C group, indicating increased patients' treatment satisfaction with the use of Euglyca. In addition, in the E group, DTSQ scores correlated positively with percentages of normoglycemias at 6 months of the study period indicating that the increase in the DTSQ scores in this group followed the improvement of glycemia. Of note, values of HbA1c and percentages of normoglycemias of patients in the E group improved most within the first 3 months of the study and remained significantly improved compared to baseline until the end of the study. Consistent with these findings, DTSQ scores of patients in the E group improved most during the first 6 months of the study and remained significantly improved compared to baseline until the end of the study. These results indicate that Euglyca improves glycemic control and satisfaction of patients promptly and this improvement is sustained thereafter. In the studies by Klee et al. and Goyal et al. no improvement in patient's satisfaction was reported.
Moreover, in the present study, when forward stepwise regression analysis was used in the E group, no predictors of the HbA1c values at 12 months were revealed with percentages of normoglycemias, hypoglycemias, and hyperglycemias, HbA1c values, and DTSQ scores taken all at baseline as independent variables, indicating that Euglyca can help any child or adolescent with T1DM to improve their HbA1c values regardless of their baseline level of glycemic control. However, in the C group, percentages of hypoglycemias and hyperglycemias were revealed as negative and positive predictors of HbA1c values at 12 months, respectively. This finding indicates that because children and adolescents in the C group did not achieve satisfactory decrease of their HbA1c values, the percentages of hypoglycemias and hyperglycemias at baseline remained predictors of HbA1c at 12 months.
Only the decrease of percentages of hypoglycemias and hyperglycemias with concurrent increase of the percentage of normoglycemias in the E group led to disruption of this mathematical prediction. To the best of our knowledge, till now, there is no study reporting the efficacy of an application for improvement of patients' glycemic control with regard to baseline HbA1c values and normoglycemias.
In summary, the use of the mobile application Euglyca, in children and adolescents with T1DM, improved their glycemic control. This is the only study with a 12-month observational period showing improvement in both glycemic control and treatment satisfaction of children and adolescents with T1DM. Use of the mobile application Euglyca led to increased percentage of normoglycemias, decrease in values of HbA1c, and improvement in children's treatment satisfaction.
One of the limitations of the present study is the absence of assessment of patients' compliance to the use of the application, using the data imputed into the application. However, patients in our department are well educated and informed about the importance of accurate recordings. For the present study extra care was given on alerting patients' parents about the importance of accurate recordings. In addition, during every follow-up visit patients and their parents were extensively interviewed about patients' compliance with Euglyca, including assessment of their recordings' accuracy, whereas they were further prompted to insist on this till the next follow-up visit. In any case, this feature is now added to the application and will be in use for future studies.
The reported positive results regarding patients' glycemic control should be corroborated to the improvement in accuracy of the insulin bolus dose calculation which, in the case of Euglyca, is based not only in the carbohydrates but also in the fat content of foods. This explanation is in agreement with the findings of Bell et al. who suggested that the inclusion of fat content in the insulin dose calculation improves glycemic control. 13 The great variety of foods and food products included in the Euglyca application provides an excellent source for accurate calculation of carbohydrate and fat content.
The improvement of the treatment satisfaction of patients who used Euglyca, as assessed by DTSQ scores, materializes its efficacy in addition to the reported decrease of HbA1c values. Patients using Euglyca do not need to investigate for and calculate the content of carbohydrates and lipids of a meal as the application performs automatically these calculations on a big database of foods. Thus, children and adolescents using the application feel independent and capable to manage T1DM by themselves in a safe and effective way. New possibilities for mHealth (mobile Health) have arisen by means of the latest advances in mobile communications and technologies. 16 However, more clinical data are needed regarding their efficacy.
Footnotes
Author Disclosure Statement
No competing financial interests exist.