
Abstract
Background:
Achieving glycemic control in critical care patients is of paramount importance, and has been linked to reductions in mortality, intensive care unit (ICU) length of stay, and morbidities such as infection. The myriad of illnesses and patient conditions render maintenance of glycemic control very challenging in this setting.
Materials and Methods:
This study involved collection of continuous glucose monitoring (CGM) data, and other associated measures, from the electronic medical records of 127 patients for the first 72 h of ICU care who upon admission to the ICU had a diagnosis of type 1 (n = 8) or type 2 diabetes (n = 97) or a glucose value >150 mg/dL (n = 22). A neural network-based model was developed to predict a complete trajectory of glucose values up to 135 min ahead of time. Model accuracy was validated using data from 15 of the 127 patients who were not included in the model training set to simulate model performance in real-world health care settings.
Results:
Predictive models achieved an improved accuracy and performance compared with previous models that were reported by our research team. Model error, expressed as mean absolute difference percent, was 10.6% with respect to interstitial glucose values (CGM) and 15.9% with respect to serum blood glucose values collected 135 min in the future. A Clarke Error Grid Analysis of model predictions with respect to the reference CGM and blood glucose measurements revealed that >99% of model predictions could be regarded as clinically acceptable and would not lead to inaccurate insulin therapy or treatment recommendations.
Conclusion:
The noted clinical acceptability of these models illustrates their potential utility within a clinical decision support system to assist health care providers in the optimization of glycemic management in critical care patients.
Background
Since the late 1980s, the Diabetes Control and Complications Trial has established the need in outpatient settings for an intensive therapeutic regimen aimed at optimizing blood glucose control to mitigate and avoid the incidence of adverse outcomes and complications among patients with diabetes mellitus (DM). 1 Over the past 15 years, the health care community has been focused on establishing similar guidelines and recommendations with regard to optimization of glucose control in patients with and without DM in the inpatient setting. Van Den Berghe et al. demonstrated that achieving “tight” glucose control in postoperative intensive care unit (ICU) patients with the use of intensive insulin therapy (to establish tight glycemic control) was associated with improved patient outcomes. 2 In that study, intensive insulin therapy reduced overall inhospital mortality by 34%, bloodstream infections by 46%, acute renal failure requiring dialysis or hemofiltration by 41%, the median number of red cell transfusions by 50%, and critical illness polyneuropathy by 44%. Furthermore, it appeared that patients receiving intensive insulin therapy were less likely to require prolonged mechanical ventilation and intensive care thereby resulting in a reduced ICU length of stay (LOS). Although this initial study established benefit to maintaining tight glucose control in the postoperative and critical care settings, numerous subsequent studies have also demonstrated similar benefits in noncritical care patients. 3 –7
Despite the numerous studies that have established patient outcome benefits that accompany maintaining tight glycemic control, a study in 2009 indicated that achieving control that is “too tight” may also lead to adverse outcomes. This study, known as the Normoglycemia in Intensive Care Evaluation–Survival Using Glucose Algorithm Regulation (NICE-SUGAR) study, elicited controversy among the health care community as it refuted previous findings. 8 This study indicated that mortality increased in the conditions where tight glycemic control was maintained. Some researchers believed the NICE-SUGAR study should be interpreted cautiously and it has generated a debate as to whether establishing tight glycemic control in some inpatient setting benefits critically ill patients. 9 Tight glycemic control reduces infection and improves neurological outcome in critically ill neurosurgical and neurological patients. 10 Some of this discrepancy is attributed to the differences in methodology noted between the Van Den Berghe (Leuven) and the NICE-SUGAR studies. These differences included the target ranges for blood glucose used in the control and intervention groups, routes of insulin administration, insulin infusion algorithms used, blood glucose sampling sites, blood glucose monitoring devices used, nutritional strategies, and variable levels of expertise among ICU nurses. Of important note is that the small studies that comprised the NICE-SUGAR study were all statistically underpowered to detect a mortality difference. 11
Furthermore, generally, there is a physiological basis that establishes benefit in avoiding hyperglycemia and maintaining closer-to-normal glycemic control during a patient's LOS in the ICU or hospital. Persistently elevated glucose values result in immune system dysfunction causing an increased risk of infection that can be accompanied by inflammation, tissue damage, and altered tissue/wound repair. Patients with hyperglycemia spend more days in the ICU receiving ventilator support, and are more likely to have a complication. 11 It is evident that hypo- and hyperglycemia should be avoided throughout a patient's LOS in the ICU and the hospital, regardless of a particular stance on the importance of inpatient glycemic control. The complexity of patients and their conditions in the ICU makes maintenance of glycemic control challenging. Achieving glycemic control in critically ill patients with and without DM is of paramount importance and can yield reductions in mortality, 12 –16 ICU LOS, 13 and morbidities such as infection. 17,18 Moreover, as this relates to trauma, a national databank analysis of patients with traumatic brain injury, overall mortality was higher in patients with versus without diabetes. 19 In addition, polytrauma patients have a higher mortality rate if they were diabetic as compared with those who were not diabetic, and have higher complications rates, including renal failure, myocardial infarction, acute respiratory distress syndrome, pulmonary embolism, and deep vein thrombosis. 20
Of further note, maintenance of glycemic control in critically ill patients is one of the most costly and labor-intensive tasks in the ICU, 21 in that blood glucose values need to be addressed frequently (every 1–2 h) and insulin administration modified accordingly. This process requires significant physical and cognitive demands from health care staff. Therefore, technology solutions such as clinical decision support systems (CDSSs) are required to simplify this process where possible while not sacrificing patient safety and care.
Since the advent of continuous glucose monitoring (CGM) technologies, the development of predictive models that leverage CGM data has been a focus of previous research and development efforts. Most of this previous research and development has been focused on prediction of glucose in patients with type 1 DM (DM1) in an outpatient setting. 22 –25 These models have been shown to be accurate in prediction of glucose concentration using model prediction horizons (PHs) of up to 60 min. Modeling approaches have ranged from machine learning-based (e.g., artificial neural networks [ANNs] 22 –24 ) to autoregressive (AR) or recursive linear modeling approaches. 25 Members of our research team have also developed predictive models for patients with DM1 that take into account a more comprehensive set of model input features to include factors such as lifestyle and emotional states that have been demonstrated to predict glucose values with a model PH of up to 75 min. 26
This article summarizes the development of a neural network-based model to predict glucose in patients in the inpatient critical care unit (ICU) setting rather than the outpatient setting of the approaches mentioned previously. The developed model is intended to be applicable to a broad population of patients admitted to the ICU with lack of glycemic control with or without a diagnosis of DM. The model developed and summarized in this effort builds off of our research team's previous work in this area 22,23,27 and demonstrates that an increase in the model PH from 75 to 135 min is possible without sacrificing model accuracy and performance. The use of CGM data to support development of algorithms to provide model predictive control (MPC) to modify insulin administration and optimize glycemic control in inpatient critical care settings has been a focus of previous efforts; however, the various data sources used by the algorithm from the patient health record and capabilities (i.e., factors such as the model PH and applicability to only intravenous administration) of these previous approaches has been limited due to CGM not being a standard of care for the inpatient setting. 24 It is the ultimate vision of our research team that the model developed in this study will be instantiated as the primary predictive model or predictive component of future CDSS technologies that will serve to assist health care providers (HCPs) in the optimization of inpatient glycemic control in patients with and without DM. The predictive model developed by our team provides a significant model PH that to our knowledge has not been achieved to date in the inpatient critical care setting. The accuracy of the predictive model developed in this effort will be the primary consideration in demonstrating the potential utility and clinical acceptability of model-generated predictions to derive insulin dosage recommendations in future CDSS technologies. Although the developed model was established using data from the ICU, it is hypothesized that they may have applicability for additional inpatient populations as well.
Materials and Methods
Patient recruitment and enrollment criteria
The study protocol was approved by The Ohio State University Institutional Review Board. All patients or their next of kin (if the patient had lost decision-making capacity) provided written informed consent. This prospective clinical study enrolled 127 patients admitted to ICUs that were distributed across The Ohio State University Wexner Medical Center (OSUWMC) and included a cardiovascular ICU (CVICU), a surgical ICU (SICU), a neurocritical care unit (NCCU), a trauma ICU (TICU), and a medical ICU (MICU). Inclusion criteria were either a diagnosis of DM1 or type 2 DM (DM2) or no preexisting DM diagnosis but an initial glucose ≥150 mg/dL upon ICU admission. Exclusion criteria were defined as female subjects who were pregnant, as indicated by a positive urine or serum pregnancy test (performed in those <45 years of age) or patients who did not have the capacity to participate based on the opinion of clinical staff.
Of the 127 patients enrolled to the study, 15 patients were admitted to the MICU, 9 to the NCCU, 87 to the CVICU, 10 to the SICU, and 6 patients to the TICU. Eight patients were diagnosed with DM1 and 97 patients with DM2. A total of 22 patients did not have a formal diagnosis of DM1 or DM2, but had an elevated glucose level (i.e., ≥150 mg/dL) upon ICU admission. A total of 46 women were enrolled with an average age of 62.1 ± 11.0 years and body mass index (BMI) of 35.3 ± 10.0; there were 81 men enrolled with an average age of 61.5 ± 10.3 years and BMI of 32.5 ± 8.1.
Clinical study and patient data collection
Upon enrollment, a CGMS iPro 2 recorder (Medtronic Diabetes, Northridge, CA) was placed subcutaneously at an appropriate and accessible site (i.e., not impeded by surgical or other procedural site) to record interstitial glucose concentration measurements every 5 min for the first 72 h of each enrolled patient's ICU admission. The CGM devices were calibrated retrospectively using point-of-care (POC) blood glucose values measured routinely at the patient's bedside per each ICU's glycemic control protocol. The calibration of the CGM device is achieved automatically through Medtronic software provided with the device. All POC glucose values are entered into the software manually after the device is removed from the patient. The sensor currents are then used to predict CGM values based on the Medtronic algorithm. Glucose values that are erroneous or have a significant deviation (defined by the manufacturer) from serum blood glucose values are not reported until an accurate reading is obtainable by the calibration algorithm. This calibration method ensures that CGM values reported by the device are sufficiently reflective of serum blood glucose values collected at the bedside and mitigates incidence of device measurement error that may be encountered during use such as, for instance, the use of interfering compounds such as acetaminophen that may be used more frequently in an inpatient setting. 28 The CGM devices used were chosen because they monitor interstitial glucose concentration retrospectively, and do not require calibration by HCPs at the bedside, and as such, will not impact routine care. The device shown in Figure 1 consists of a recorder unit and a disposable subcutaneous sensor. The use of this CGM device did not impact routine clinical care, increase HCP workload, or cause unwanted disturbances in ICU care.
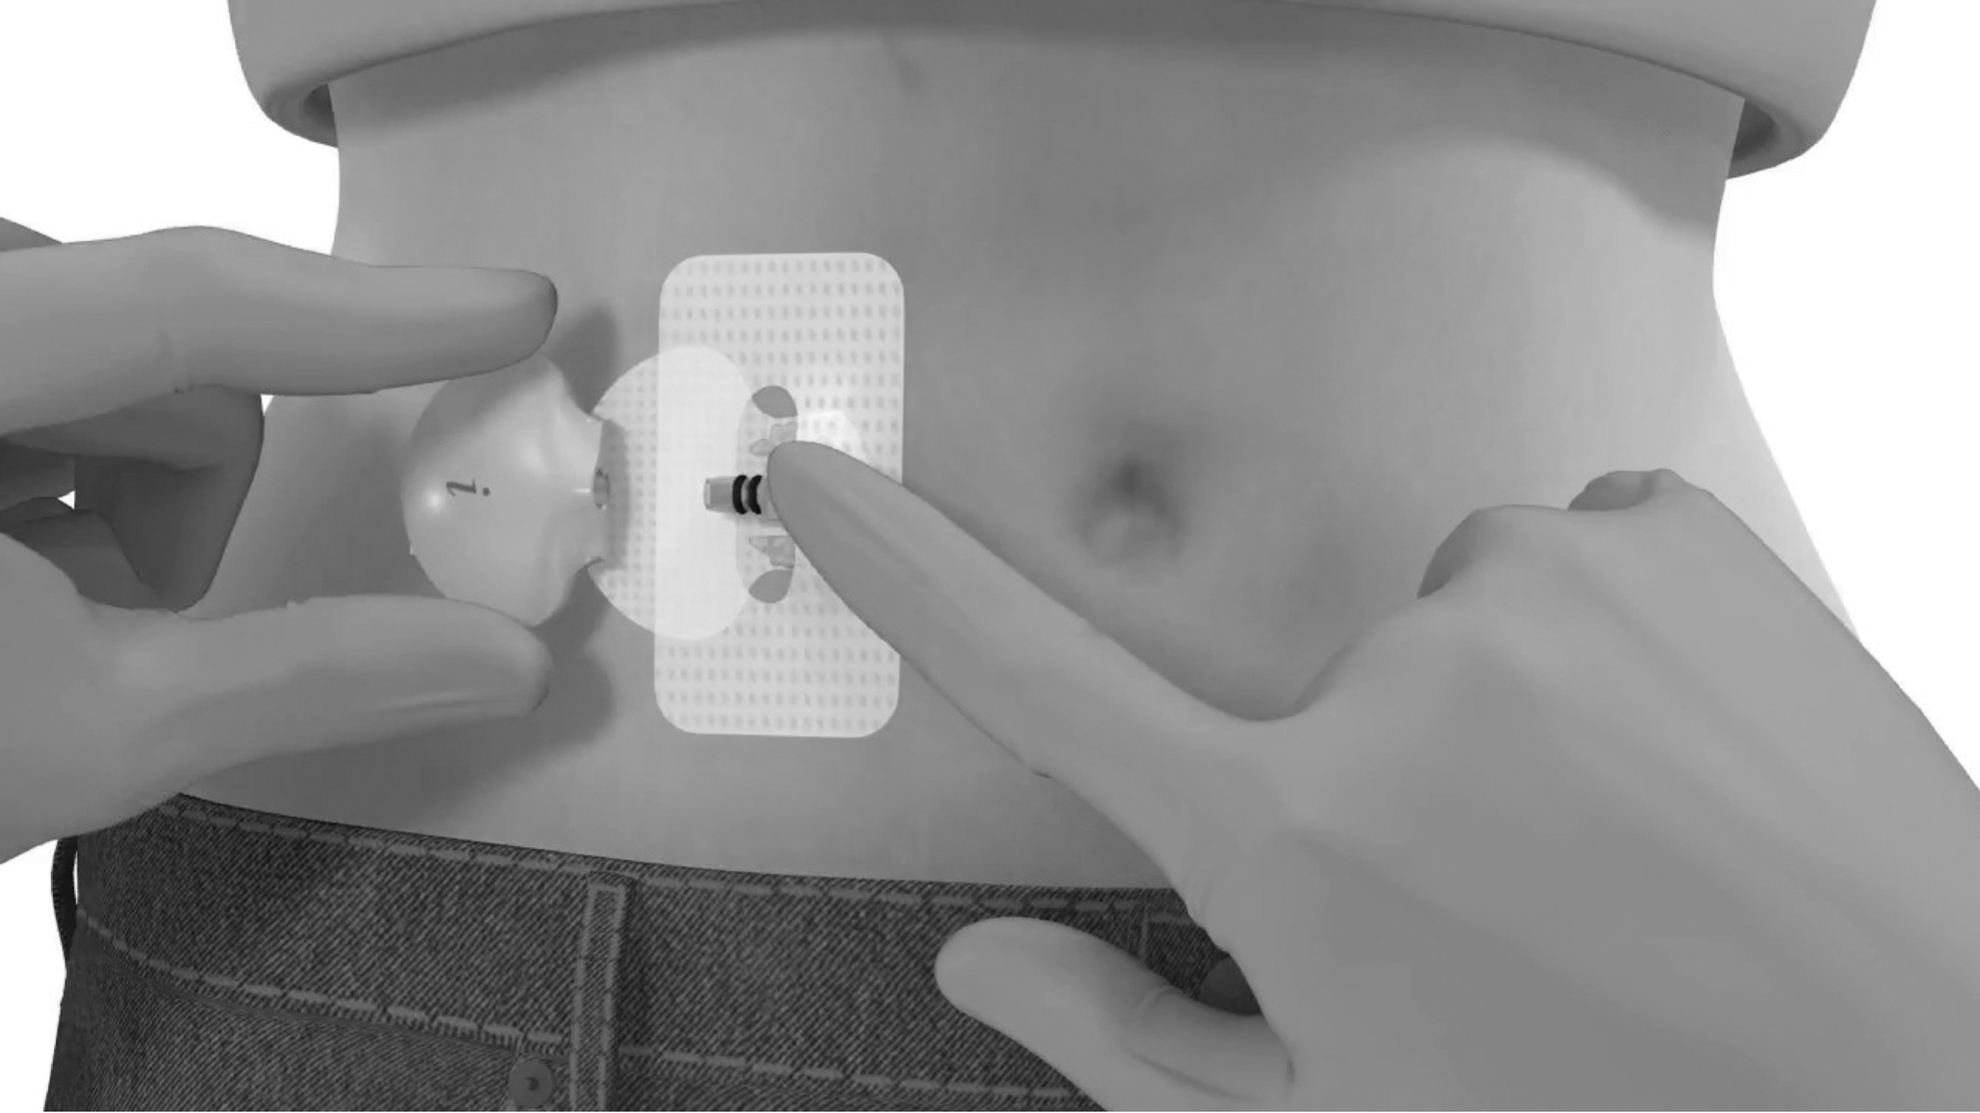
Medtronic CGMS iPro 2 Recorder used for CGM in the summarized clinical study. CGM, continuous glucose monitoring.
All patient electronic medical records (EMRs) were documented routinely throughout the patient's ICU LOS using the EMR provider of OSUWMC (Epic Systems, Verona, WI). All data were exported to CSV files by the OSUWMC Bioinformatics Department, merged with CGM data, and were used in the predictive model development efforts.
Predictive model development
A software program MATLAB® (Mathworks, Inc., Natick, MA) was used to merge the patient CGM data with their corresponding EMR data. A total of 41 model input features were used for the predictive model. Each model input was assigned and provided a timestamp represented on a decimal value 24-h scale with a resolution of every 5 min (i.e., the sampling rate of the CGM device). For instance, a value of 14.5 represented a value of 2:30 PM. All model inputs were assigned to the timestamp that was closest to the value reported in the institution's EMR. All model input features were chosen based on previous research completed by members of our research team 29,30 that included literature review, discussions with clinical staff and subject matter experts supporting our team, and application of feature selection algorithms such as greedy search and genetic algorithms. The various data sources that were leveraged as inputs for the predictive model included vital signs (e.g., heart rate and respiration rate), laboratory results (whole blood lactate, serum creatinine, white blood cell count, etc.), nutritional intake/nutritional status, dosage and use of inotropes, insulin delivery data (infusion and subcutaneous), POC blood glucose measurements, and both real-time and historical CGM data (1-h history or 12 CGM values). Nutritional intake/status was encoded as model input either as NPO (no food by mouth) or specification of a tube feeding rate where applicable in milliliters per hour. Insulin administration data were encoded as individual model inputs that represented all types of insulin (lispro, glargine, aspart, etc.) available to the institution (OSUWMC), the dosage, and a time difference from the current time stamp (in hours) corresponding to the last time the specified dosage was given/delivered (for subcutaneous injections). If the patient was on an intravenous drip, the infusion rate was specified every 5-min timestamp in units per hour. If no model input was available at a current time 24-h stamp, a value of −1 was represented to the model. This was useful for model inputs where data were taken intermittently, or when something such as a medication could have been enacted at any given time. For example, a −1 for the model input corresponding to nutritional intake was −1 when the patient was NPO, whereas the value was set to the tube feeding rate when active as described previously. All model input features used by the predictive model are specified in a table within the Supplementary Data. A model training set for the predictive model developed was generated using MATLAB. This routine excluded (randomly) 15 patient records from the comprehensive dataset to be utilized for model validation. The resulting comprehensive dataset was used for the purpose of model training and consisted of 79,898 glucose values that were matched to referenced EMR data across the remaining 112 patients.
The predictive model developed in this investigation was designed to forecast a complete trajectory of patient glucose values up to a PH of 135 min. The model architecture was created using NeuroSolutions® (NeuroDimension, Gainesville, FL), which is a neural network development environment. The model output was defined as 27-node output layer representing 27 predicted glucose values that spanned across a model PH ranging from 5 to 135 min in 5-min increments from a current timestamp. The approach used in the model design was not only similar to that previously reported 29,31,32 but also provides increased predictive capabilities with a 135-min PH. The model developed in this effort is different from the model developed in our previous work in that the complexity of the model is enhanced to include two hidden layers versus a single hidden layer. Significant improvements in model accuracy were not achieved with more than two hidden processing layers, and models with additional hidden layers were prone to more overfitting. The additional hidden layer from our initial development may provide a reason for increased model accuracy and performance as the network has more weights that can be adapted and adjusted to find different patterns in the model input feature set. The complexity increases in the model (i.e., addition of another hidden layer) were made minimal, to minimize complexity of the model and still provide a model that can be adapted and retrained in real-world use without significant additional training time commitments or processing power. Another difference in the model developed in this study with respect to previous predictive models is the presence of a set of model input features exported directly from a health care institution's EMR. Previous models were developed with a custom-built software application to record relevant supporting EMR data from the patient's medical record in an electronic format. 29 However, in this study, a comprehensive EMR (Epic Systems) was available to automatically export data into a spreadsheet for model development and training. This assisted in the mitigation of any data entry errors, and access to a more thorough and comprehensive set of data for model development and validation. The model was trained using CGM values as the ground truth to provide the 135-min model PH with a resolution of predictions every 5 min across the prediction trajectory (forecast window) generated by the model. POC blood glucose values were only leveraged as model input features when available to provide further insight to the model. The maximum model PH of 135 min was chosen to accommodate for potential delays that may exist between interstitial (CGM) and blood glucose values. 25 Delays are the most significant during rapid changes in glucose concentration. Historically, delays have been reported in the literature to range between 5 and 15 min 25,26 ; however, CGM technologies continue to be advanced and accuracy is continually increasing with respect to reference blood glucose data. As such, extending the PH of 15 min accommodates for potential delays and provides a 2-h PH. The predictive models developed were feed-forward ANNs and designed using 2 hidden layers with 15 and 10 processing elements in each of these layers, respectively. This architecture was chosen as it reached a compromise in both required training time and model performance (i.e., prediction accuracy) of the multiple architectures that were evaluated. Weight optimization of the ANN was accomplished by using Levenberg–Marquardt back propagation. 29
Predictive model validation
The predictive model developed was validated using the data from the independent 15 patient records that were not used in the training set. The data from these patients can be used to demonstrate the validity, performance, and clinical utility of the predictive models. Predictive accuracy across this population represents a measure of the anticipated model performance that would be expected in a real-world clinical setting. To evaluate the model's accuracy, the predictive error was calculated as the percentage of the mean absolute difference (MAD%) between the predicted (GlucosePredicted) and reference glucose (GlucoseReference) values using Equation (1). Model error was calculated with respect to reference CGM data (i.e., interstitial glucose values) and the POC blood glucose values. Furthermore, the percentage of hyperglycemic and hypoglycemic CGM and POC glucose values successfully predicted were reported. To provide an evaluation of the model's clinical acceptability (i.e., those not leading to adverse therapy recommendations), a Clarke Error Grid Analysis (CEGA) was completed to compare the predictions against the actual reference glucose measurements.
31
This CEGA assumes a linear relationship exists between the model's glucose predictions compared with a gold standard or reference glucose monitor. Regions A and B of the error grid are regarded as clinically acceptable, and predictions that fall within these regions would not contribute to poor clinical guidance. Regions C, D, and E of the error grid, however, would potentially lead to inappropriate treatment if insulin delivery or therapy was guided by predictions from within this grid region.
Results
Model performance demonstrated that the developed model was accurate in predicting glucose values with respect to both reference CGM and POC blood glucose values. For this study a total of 3494 POC blood glucose measurements were collected and there was an average error (MAD%) of 10.0% calculated between all reported CGM (interstitial glucose) values and corresponding POC blood glucose values. In terms of predictive model performance, there was a linear increase in model error (MAD%) with respect to CGM data as the model PH increased. Overall MAD% ranged from 1.0% for a PH of 5 min to 10.6% for the maximum PH of 135 min. Table 1 demonstrates the linear increase in model error that was observed for model predictions when compared against reference glucose measurements for PHs ranging from 15 to 135 min. A similar increasing trend in average model error was observed for model-generated predictions with reference to POC blood glucose measurements. However, a narrower error range was observed. Overall MAD% ranged from 10.2% for a PH of 5 min to 15.9% for the maximum PH of 135 min.
Model Error Across at Various Points of Time Across the Model Prediction Horizon Expressed as Mean Absolute Difference Percent
CGM, continuous glucose monitoring; MAD, mean absolute difference; POC, point of care.
CEGA of model predictions with respect to CGM and POC blood glucose results are given in Tables 2 and 3. For predictions evaluated against CGM results, 99.6% of model predictions were clinically acceptable for a corresponding model PH at 135 min. This analysis was performed against 11,023 reference CGM values. Similar results were observed for model predictions when evaluated against POC blood glucose values, where 99.4% of model predictions were clinically acceptable. This analysis was performed against 469 reference POC blood glucose values.
Summary of Clarke Error Grid Representing the Distribution of Model Predictions with Respect to Reference Continuous Glucose Monitoring Values Shown in Figure 5
Summary of Clarke Error Grid Representing the Distribution of Model Predictions with Respect to Reference Point–Of-Care Blood Glucose Values Shown in Figure 5
The predictive model generated, successfully predicted 94.4%, 90.7%, and 86.2% of hyperglycemic CGM (interstitial) glucose values for PHs of 30, 60, and 135 min, respectively, which included a total of 2777 CGM glucose values that were defined as hyperglycemic (≥180 mg/dL) in the 15-patient model validation dataset. The predictive model successfully predicted 53.6%, 34.4%, and 0.0% of hypoglycemic values (≤70 mg/dL) reported in CGM data for PHs of 30, 60, and 135 min. The validation dataset included a very small number of hypoglycemic glucose values reported by the CGM device (N = 46) but none reported in POC glucose monitoring results. We suspect that no hypoglycemia was reported by POC monitoring, as it is less frequently sampled than CGM and for this reason, can miss occurrences of hypoglycemia. Patient glucose values can “rebound” in between POC glucose monitoring results for reasons such as but not limited to counter-regulatory hormone release or medication utilization. Hypoglycemia routinely occurs in patients with better glycemic control. For such patients, HCPs in the ICU would likely monitor glucose values less frequently. The model successfully predicted 74.7%, 66.7%, and 59.8% of hyperglycemic POC blood glucose values for PHs of 30, 60, and 135 min, respectively, which included a total of 82 POC blood glucose values that were recorded as hyperglycemic in the 15-patient dataset. No hypoglycemic POC values (≤70 mg/dL) were reported in POC glucose monitoring data.
Figures 2–4 provide a visual representation of model predictive accuracy for 3 of the 15 patients with a PH of 135 min. These figures include predictions with respect to CGM (Figs. 2–4 left) and POC blood glucose values (Figs. 2–4 right) using the model's maximum PH (135 min). Figure 2 provides details of a patient whose model performance was the best among the validation cohort where MAD% of ∼7.1% and 8.6% was achieved for model predictions with respect to reference CGM and POC blood glucose values, respectively. Figure 3 represents a patient's details whose model performance was average (or in the middle) among the validation cohort where MAD% of ∼11.8% and 17.3% was achieved for model predictions with respect to reference CGM and POC blood glucose values, respectively. Finally, Figure 4 provides details of a patient whose model performance was the poorest among the validation cohort where MAD% of ∼17.9% and 23.1% was achieved for model predictions with respect to reference CGM and POC blood glucose values, respectively. All other model accuracy falls somewhere in between the performance shown in Figures 2 and 4. To further demonstrate model performance all plots of the predictive model output with respect to CGM and POC data for the remaining 12 patients are included in the Supplementary Data. As given in Table 1, model predictive accuracy improves linearly at lower PHs. Pearson correlation coefficient values of 0.96 and 0.97 were achieved between predictive model error and model PH for predictions with respect to CGM and POC values, respectively.
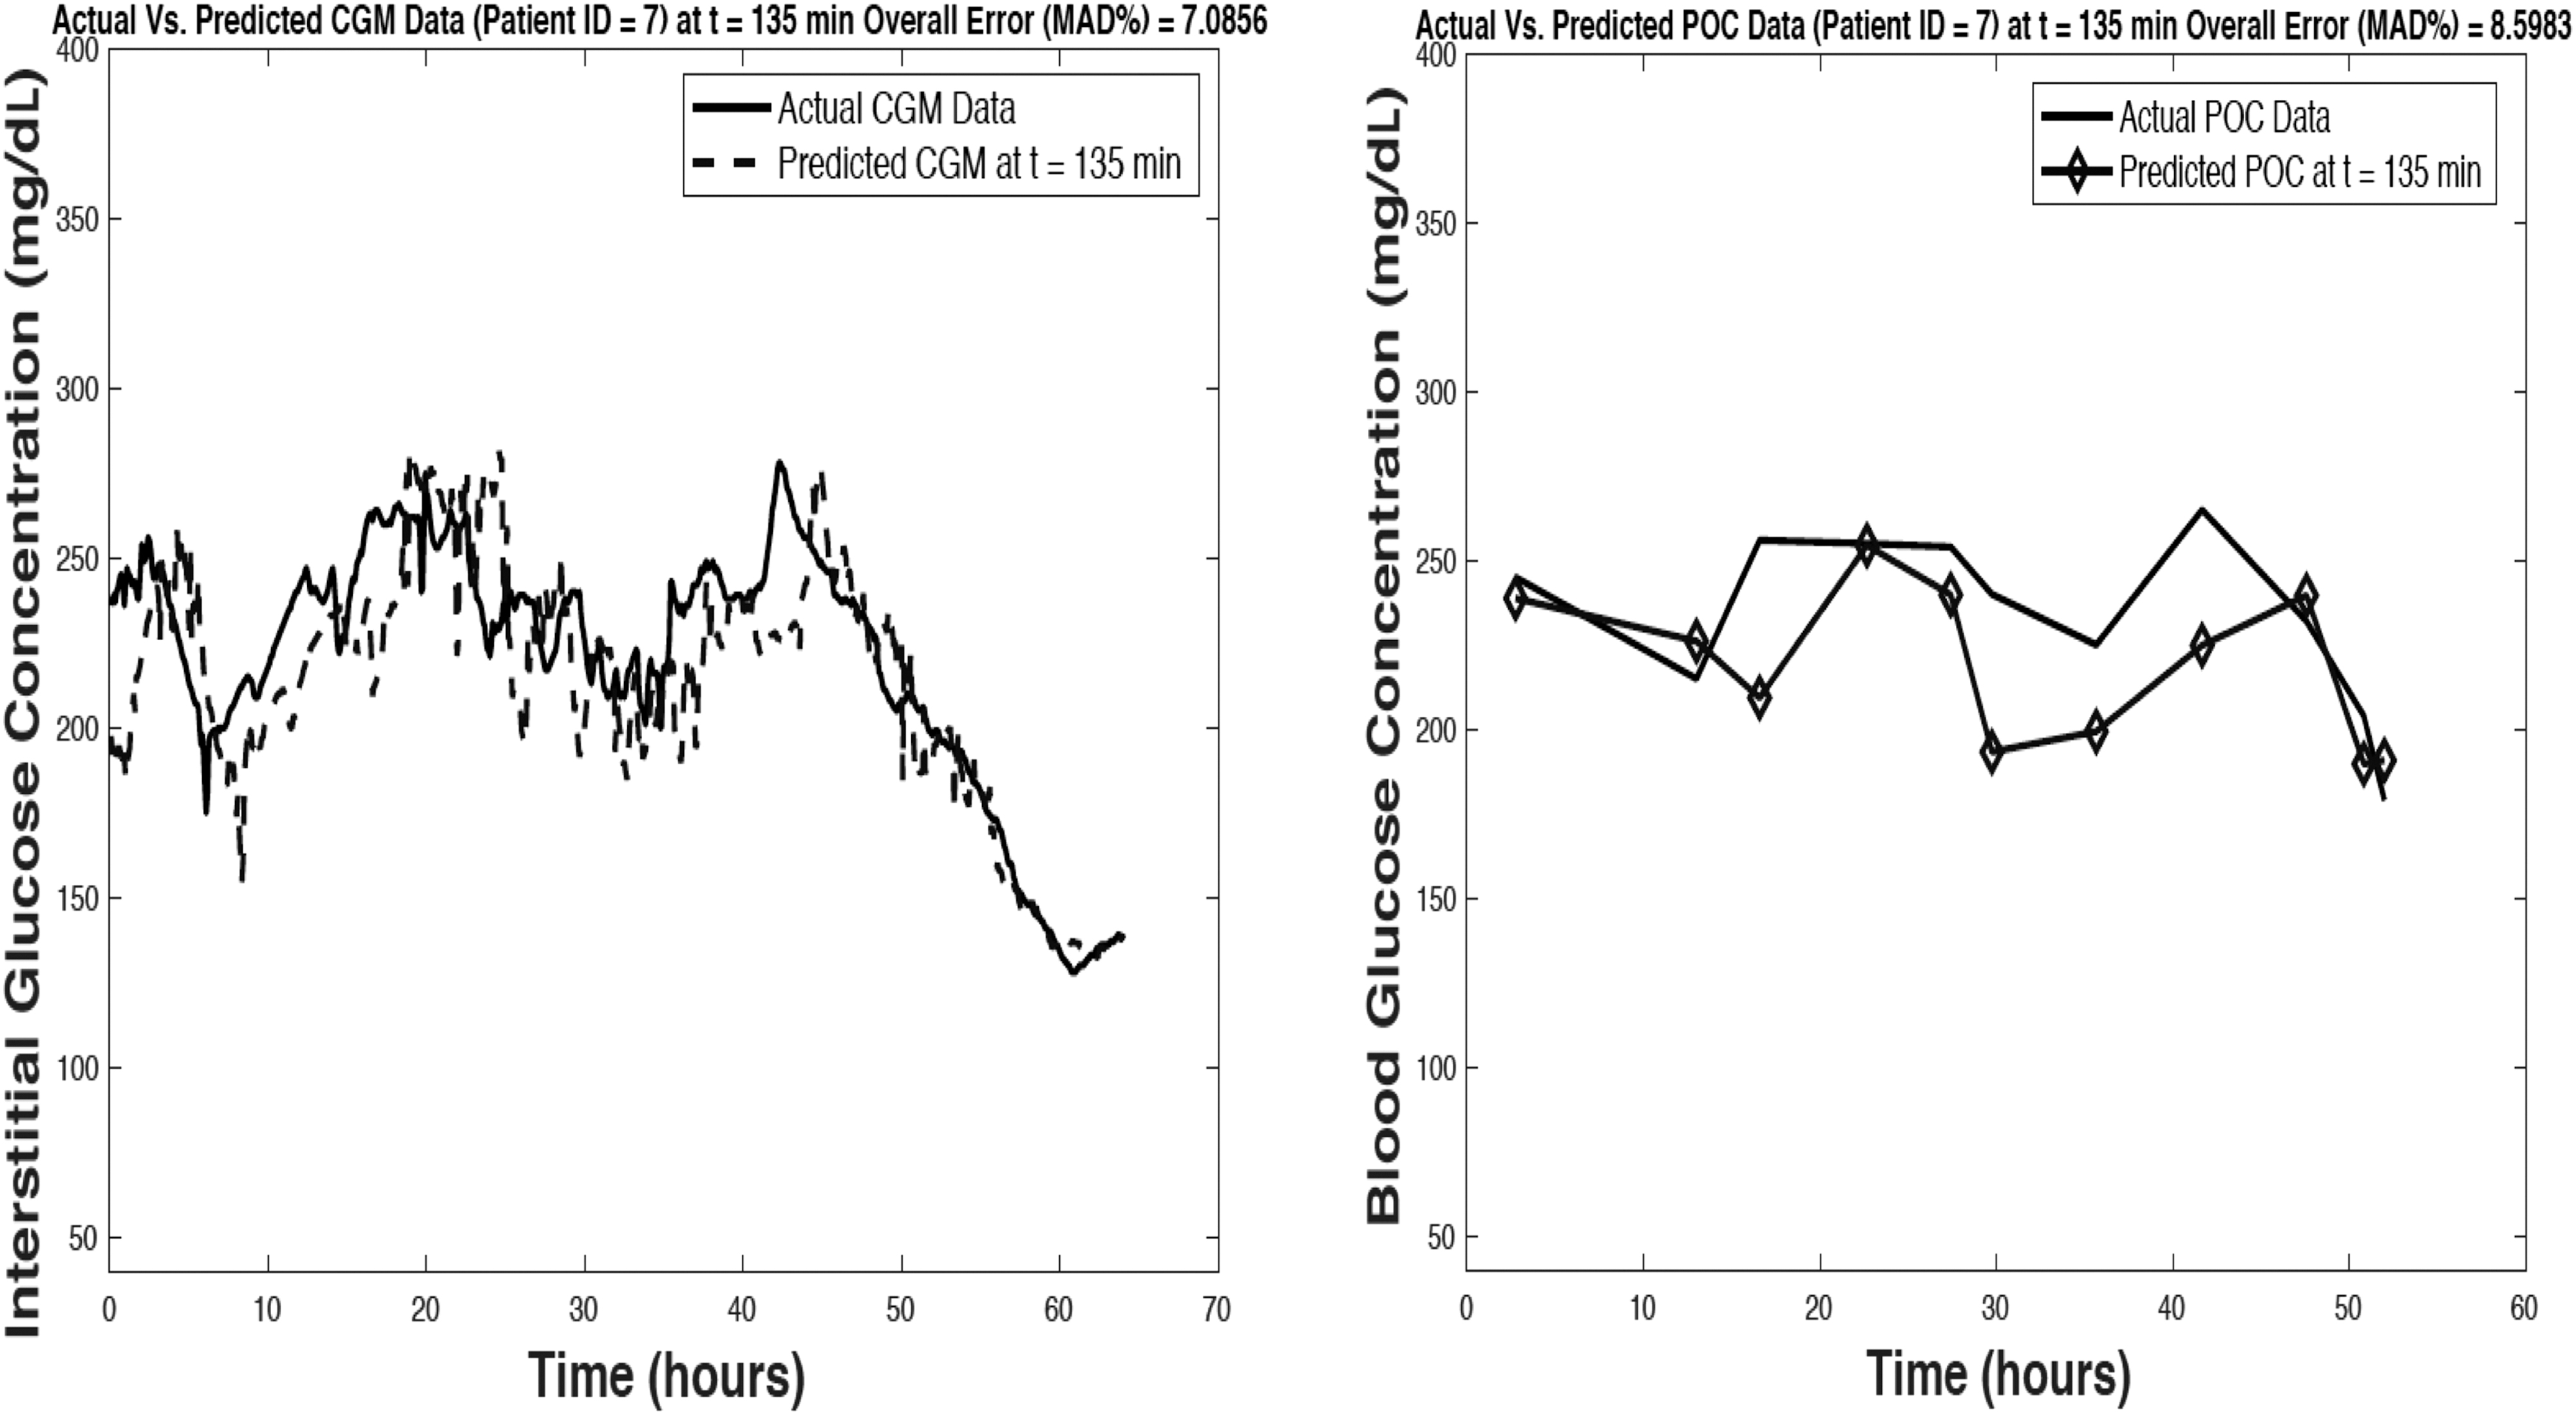
Visual representation of model predictive accuracy (model prediction horizon of 135 min) with respect to reference CGM measurements (left) and POC blood glucose values (right) data for a single patient record used for model validation. Representation of best model performance among validation cohort. MAD, mean absolute difference; POC, point of care.

Visual representation of model predictive accuracy (model prediction horizon of 135 min) with respect to reference CGM measurements (left) and POC blood glucose values (right) data for a single patient record used for model validation. Representation of average model performance among validation cohort.
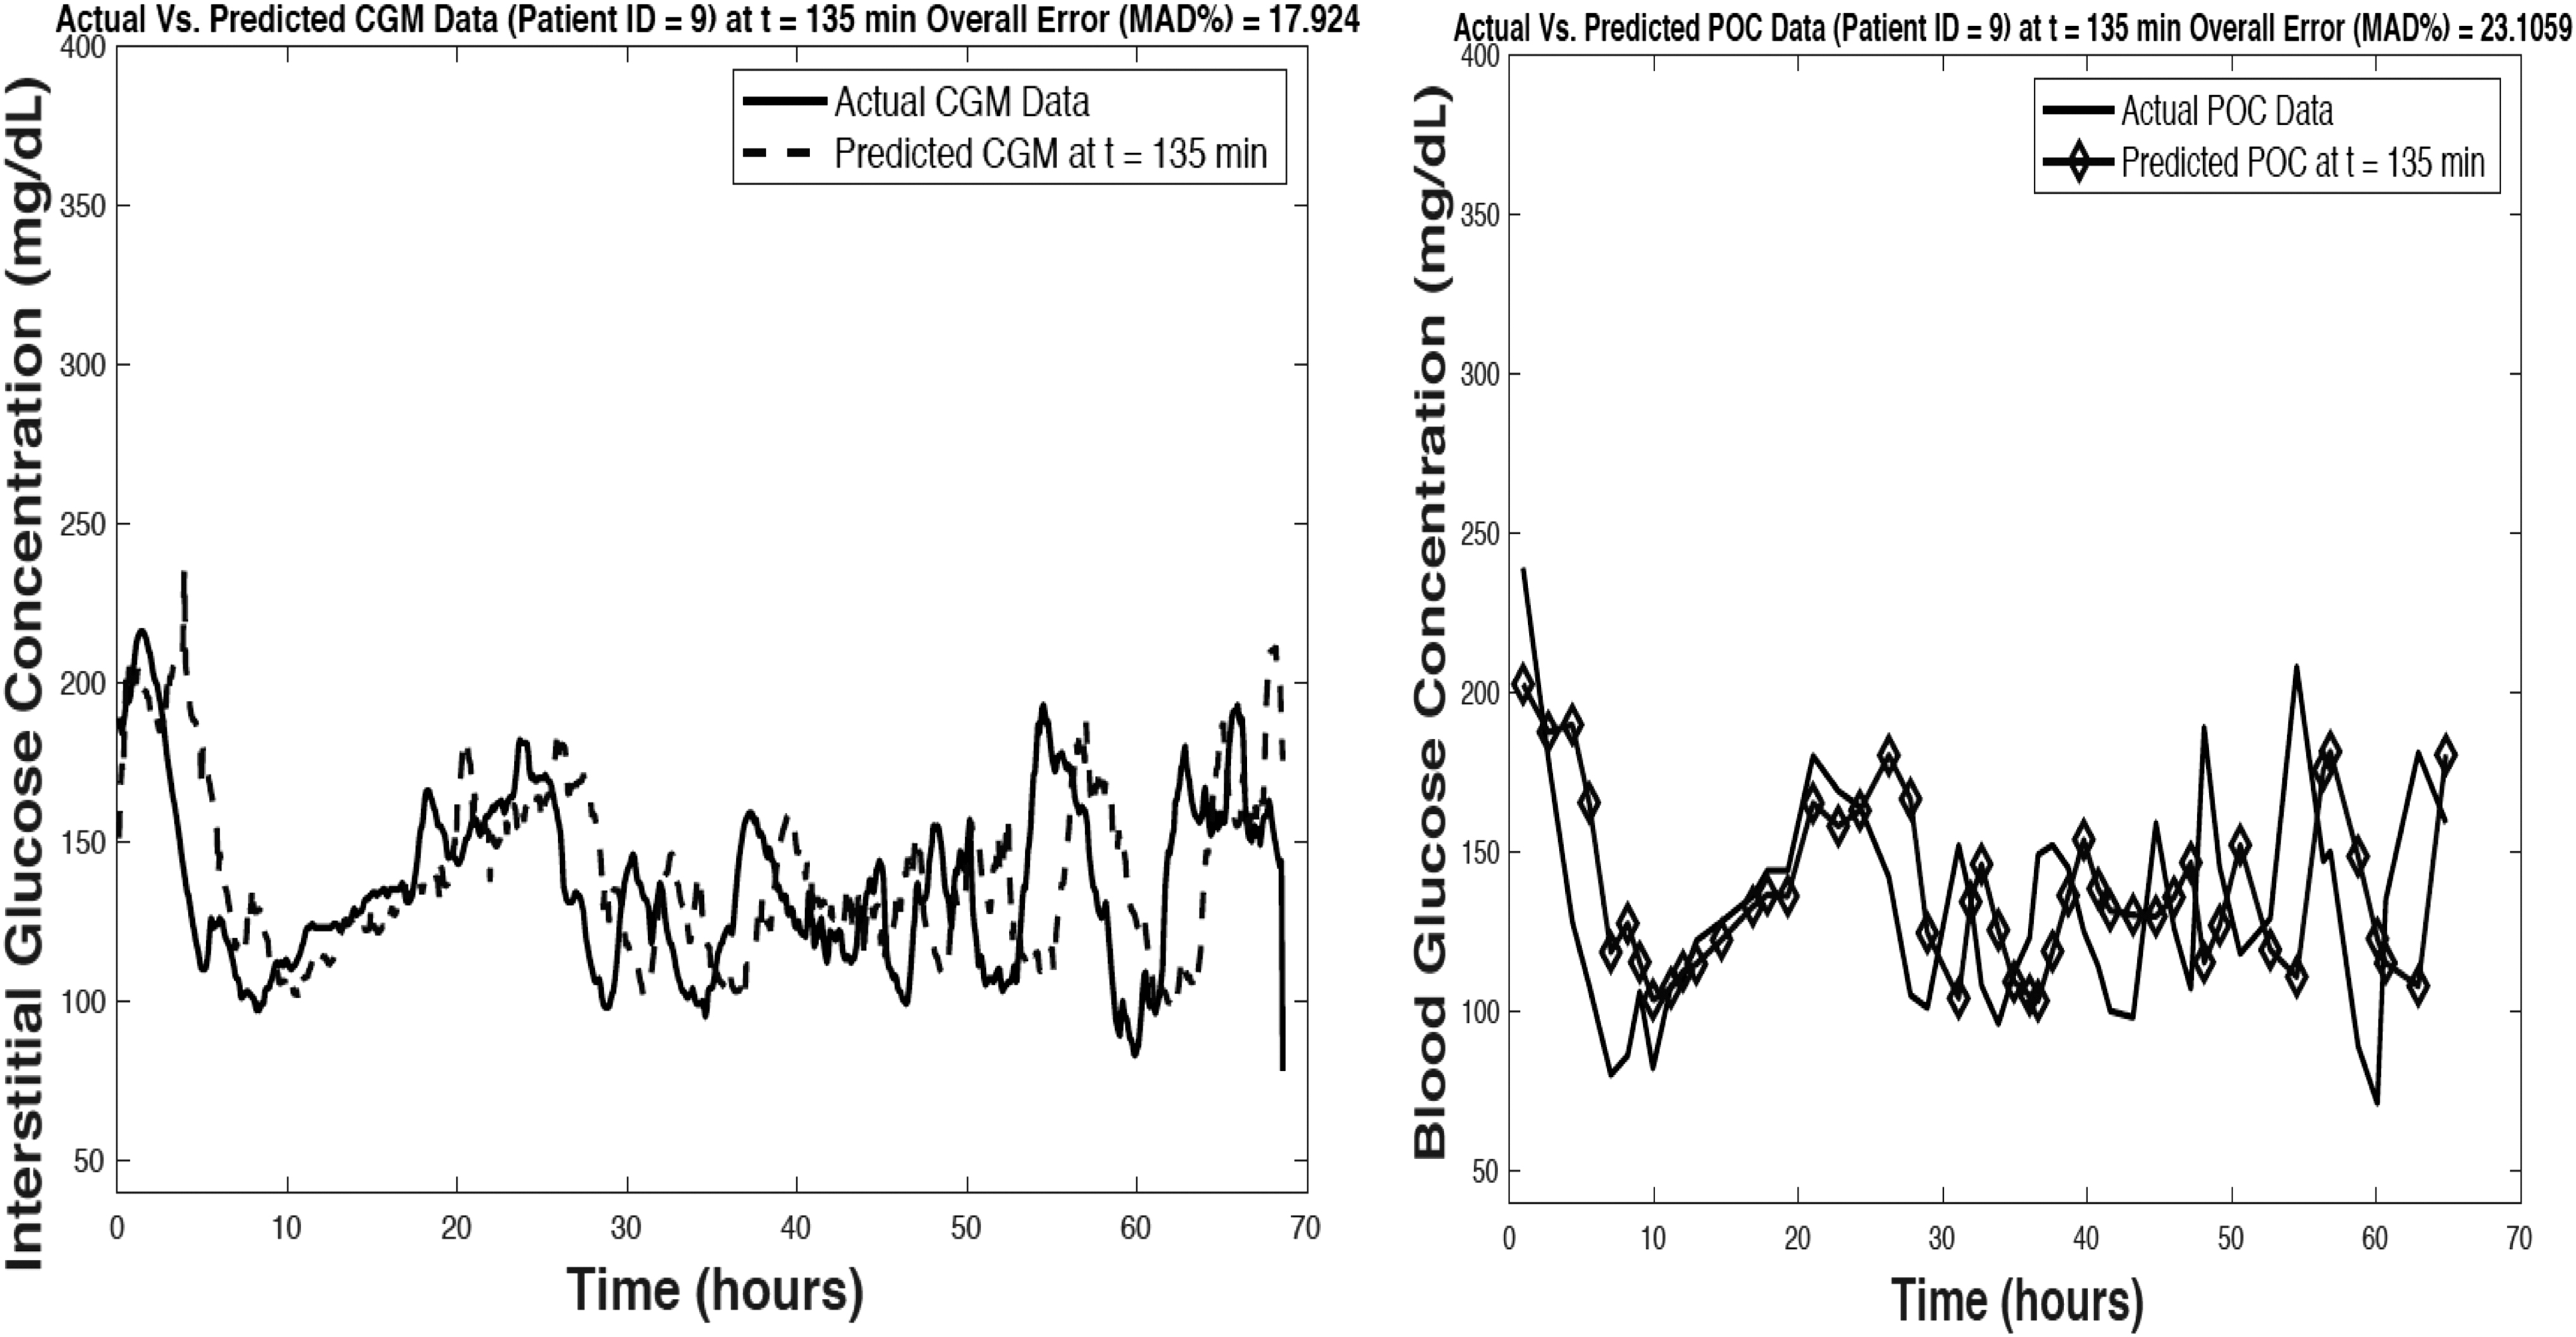
Visual representation of model predictive accuracy (model prediction horizon of 135 min) with respect to reference CGM measurements (left) and POC blood glucose values (right) data for a single patient record used for model validation. Representation of poorest model performance among validation cohort.
Figure 5 represents Clarke Error Grids for the model-generated predictions across all 15 patients used to validate the model for a PH of 135 min with respect to CGM (Fig. 5 left) and POC blood glucose values (Fig. 5 right). The Clarke Error Grids represented in Figure 3 demonstrate model prediction accuracy with a graphical depiction of results similar to what can be inferred through a confusion matrix. Predictions that occur in regions C, D, and E of the error grid include predictions that would be represented as false positives or false negatives (depending on reference and predicted glucose values) and would lead to inappropriate glycemic management practices. This is shown in Figure 5 (left) where model predictions (located in region D) indicate that the patient is in a normoglycemic state when they are actually in a hypoglycemic state as measured by the CGM device. This can be interpreted as an example of a false negative in terms of predicting hypoglycemia with respect to reference CGM data. This is also demonstrated in Figure 5 (right) where model-generated predictions indicate that the patient is in a normoglycemic state but reference POC blood glucose values indicate the patient is hyperglycemic (>225 mg/dL). This is an example of a false negative in prediction of hyperglycemia with respect to reference POC glucose values. Tables 2 and 3 include a summary of the Clarke Error Grids generated for model predictions. These tables include the total number of predictions falling into each region of the error grid, and the percentage of the total predictions that are represented in each region of the error grid. Figure 5 further illustrates the results reported in Tables 2 and 3, where a majority of the predictions at the model's maximum horizon of 135 min can be regarded as clinically acceptable and would not result in an inaccurate therapy or treatment recommendation.
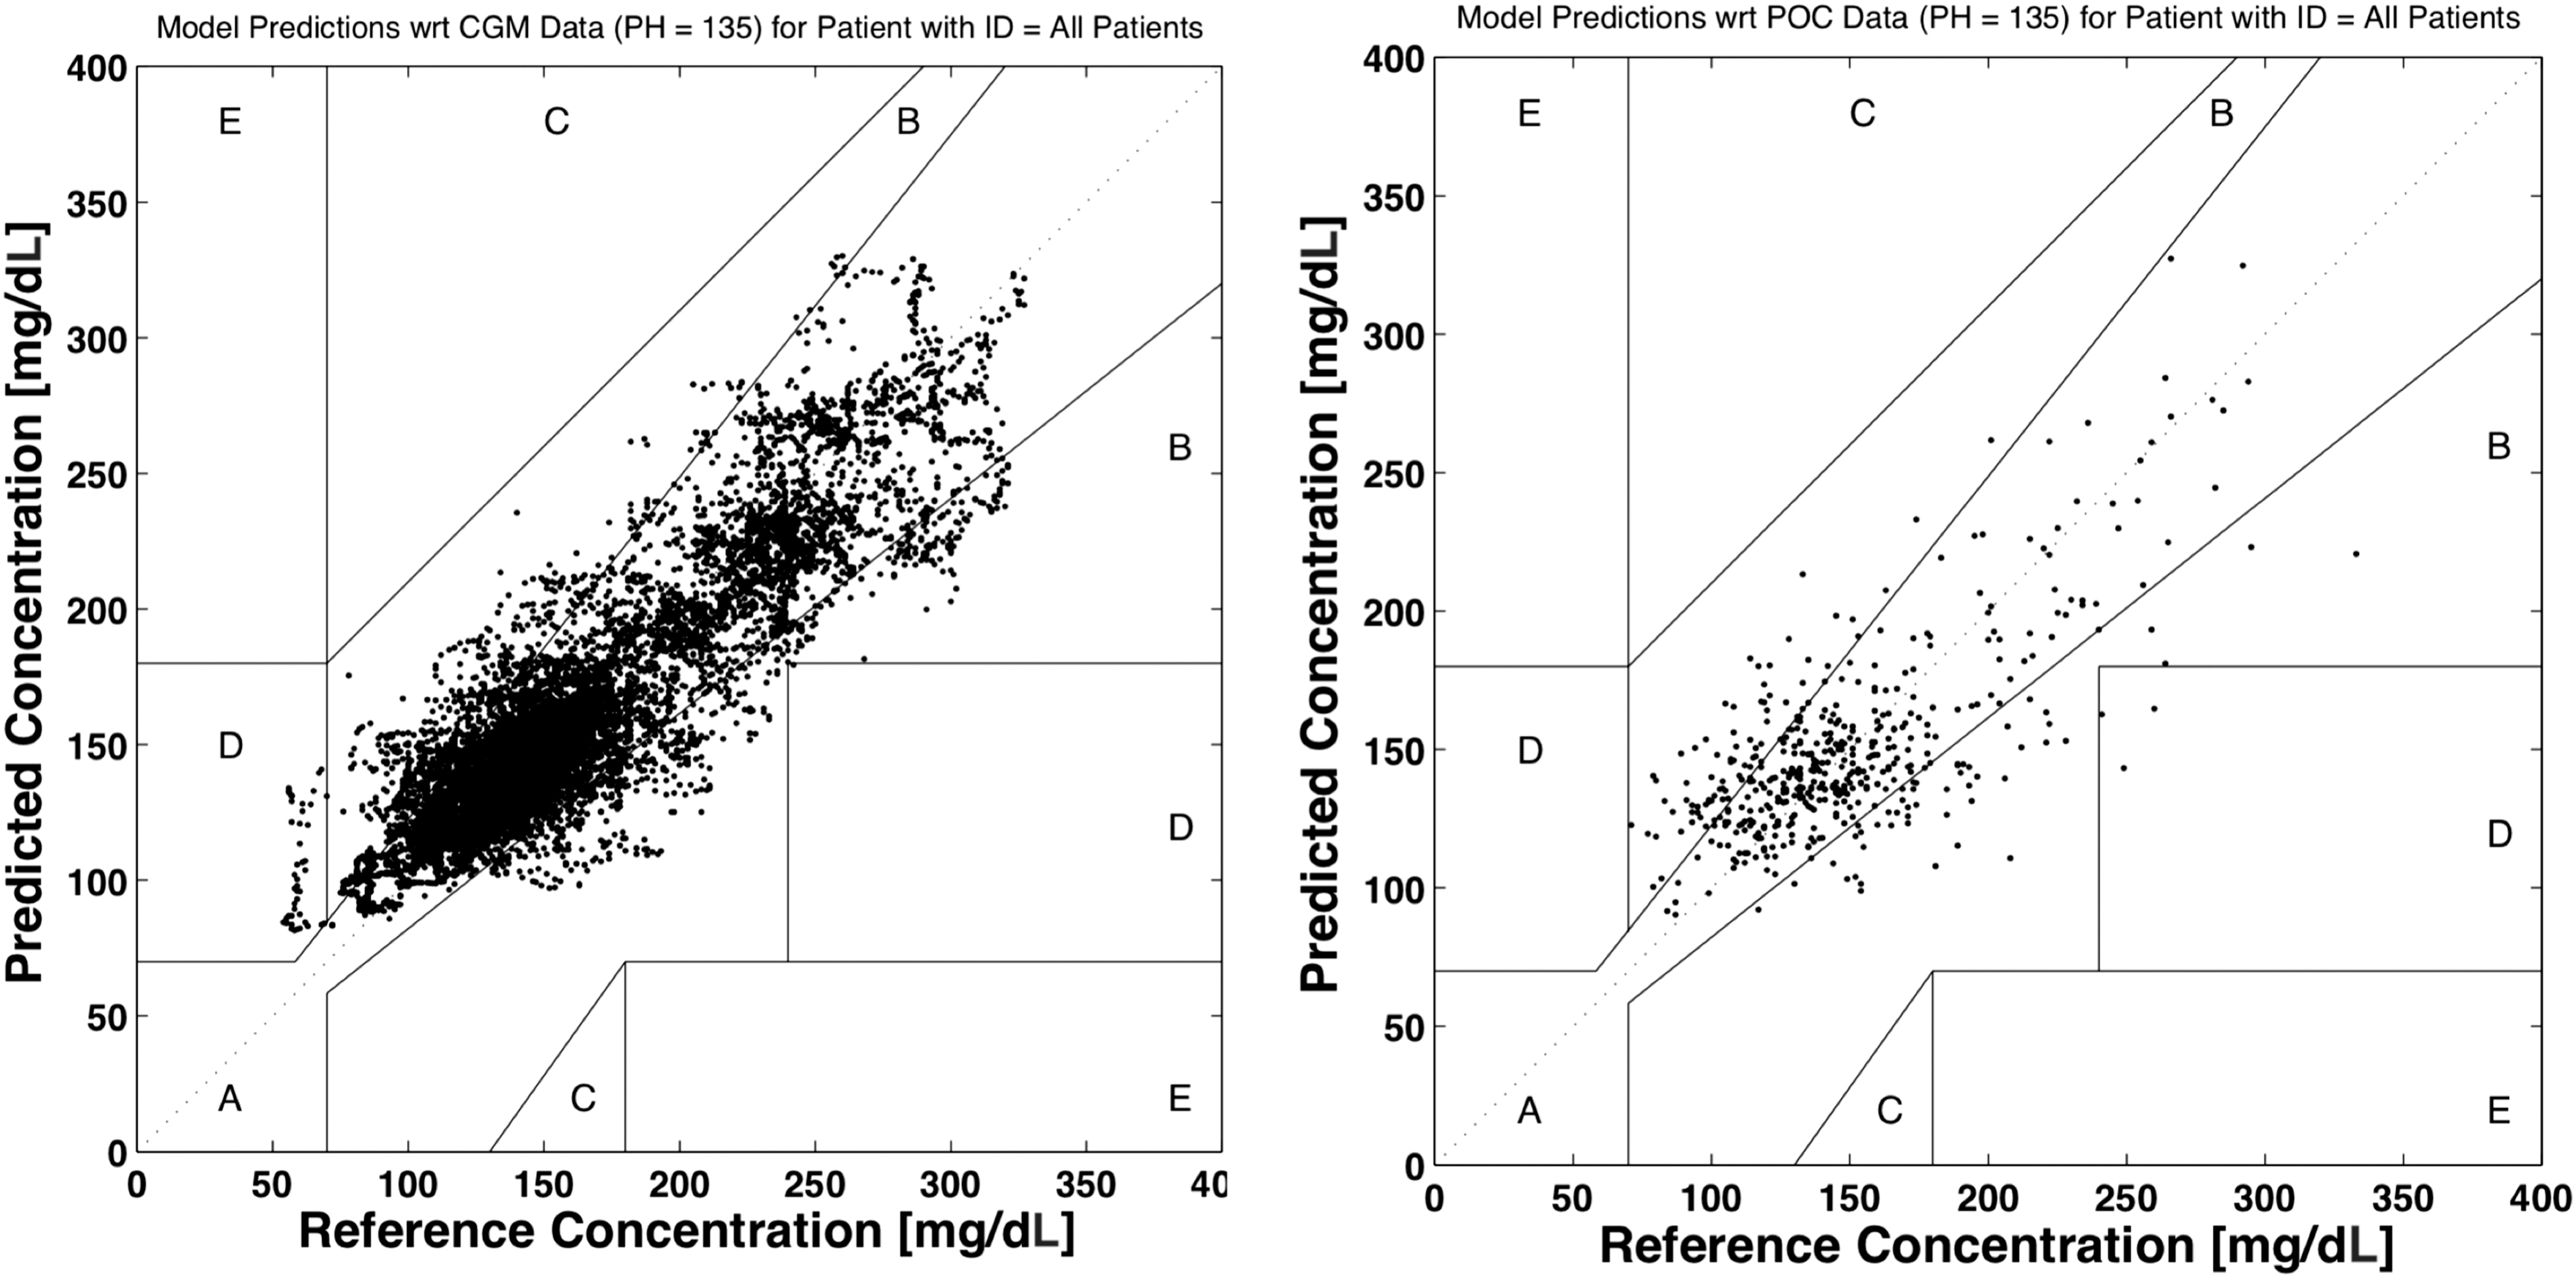
Clarke Error Grids generated for all model predictions compared against reference CGM glucose measurements (left) and POC blood glucose values (right) for a model prediction horizon of 135 min.
Discussion
The results of this study demonstrate improved accuracy and a longer PH with respect to models previously developed by our team during a smaller scale clinical study. 27 The improvement in accuracy of the predictive models with respect to this previous study was anticipated because of the increased size (i.e., factor of 7.9) of the dataset available for training and the increased population size (111 vs. 14 patients). Given that these predictive models are machine learning-based, they possess the ability to “learn” patterns and trends in data over time as more data are available. Such models often adapt and improve in accuracy as more data are collected and appended to a comprehensive training dataset. In addition, with respect to previous and related work, previous predictive models developed used a separate custom-built software application to record relevant supporting data from the patient's medical record in an electronic format. 27 However, in this study, a comprehensive EMR (Epic Systems) was available. This assisted in the mitigation of any data entry errors, as well as access to a more thorough and comprehensive set of data for model development and validation.
The models developed during this effort demonstrated accuracy in prediction of hyperglycemic glucose values (>86% of values predicted for a PH of 135 min). Nonetheless, the predictive accuracy for hypoglycemic values was significantly less. The developed model only predicted 53.6%, 34.4%, and 0.0% of hypoglycemic values (≤70 mg/dL) reported in CGM data for PHs of 30, 60, and 135 min, respectively. As such, only a small percentage of hypoglycemia was predicted with smaller model PHs much less than the maximum model PH of 135 min. The dataset collected during this effort was not especially well-suited to evaluate model predictive accuracy for hypoglycemia. No hypoglycemia was reported by POC blood glucose monitoring completed at the bedside, and only a small number of hypoglycemic glucose values (n = 23) were present in CGM data that comprised the model validation set that equated to only 0.21% of the data used for model validation.
Despite the small percentage of hypoglycemic values present in the model validation set, if the proposed model is to have sufficient clinical utility and be accepted by providers in the targeted inpatient setting, the model needs to be more accurate in prediction of hypoglycemic extremes. Our team is developing additional supporting algorithms that may improve the model's predictability of hypoglycemia, including algorithms that track rate of change in CGM data, as well as AR modeling approaches that capture trends in CGM data as glucose values trend downward below some glycemic threshold. These supporting algorithms will be instituted as a fail-safe to assist in warning or alerting HCPs of impending hypoglycemia that may not be predicted by the ANN-based model or similar modeling approach requiring training data. The use of a CGM time series for prediction of glucose and alerting for hypoglycemia has been a focus of many prior research efforts. Sparacino et al., leveraged a first order AR model to predict future glucose values. 32 AR models with a higher fixed order of 30 requiring 150 min of historical CGM data have been demonstrated to predict hypoglycemia across a broad population of patients with diabetes using a PH of 30 min. 33 More recently, more sophisticated AR models that also leverage other variables such as current activity status (e.g., exercise or sleep) have been investigated. 28 Many of these modeling approaches investigated model PHs ranging from 15 to 60 min with model predictive accuracy decreasing significantly at higher PHs. The model proposed by Bayrak et al. 28 predicted 90% and 59% of hypoglycemic values using PHs of 30 and 50 min, respectively. Comparison of these previous models to our approach is difficult as these previous approaches were evaluated using datasets that had a greater quantity of hypoglycemia and were collected in outpatient settings in patients with DM1 and DM2. It is likely that these patients would have exhibited less glycemic control than the patients in this study who had their glucose monitored and controlled by a team of health care professionals. It is worth noting however, that despite the differences in patient population and dataset our proposed ANN-based approach implements a longer PH (up to 135 min), and overall model error with respect to CGM and POC blood glucose outperforms many of these previous approaches.
As discussed, many of these prior AR-based approaches, however, have been evaluated exclusively in patients with DM1 and DM2 and not in the inpatient critical care setting that was the focus of this effort. Our team believes the proposed ANN-based approach is uniquely suited for the inpatient and critical care patient population who have a variety of clinical data sources and interventions that frequently change and are indicators or predictors of future glycemic trends. AR-based models rely on a CGM time series for its predictions, however, the higher the order of the model the more historical data are required for predictions to be generated. This historical data must be present without any missing CGM values. For the model proposed in this effort, the required history of CGM values leveraged as model input features was defined as 1 h (12 CGM values). Our team believes a hybrid modeling approach where an ANN-based model is combined with an AR or similar approach will further improve model predictive accuracy at hypoglycemic extremes via providing two predictive outputs as a fail-safe. Furthermore, addition of logic to the proposed ANN-based model which serves to alert HCPs to measure glucose values when predictions are below a threshold (e.g., ≤80 mg/dL) will also be valuable.
It is also worth noting that similar performance and lack of prediction of hypoglycemia was also demonstrated in our group's previous work. 27 The reduced accuracy at prediction of hypoglycemic glucose values is directly related to the reduced availability of hypoglycemic data in the model training set. 30 Although there was a significant increase (factor of 7.9) in the number of patients that comprised the underlying model training set, the percentage of hypoglycemic values in the training set was similar to the training set used in previous efforts. 27 For this dataset there were only 206 hypoglycemic glucose values in the model training set that comprised only 0.26% of the model training set that consisted of 79,898 glucose values. Furthermore, no hypoglycemia was reported or recorded by discrete POC glucose monitoring that was completed at the patient bedside and as such, was not captured during routine clinical monitoring either. It is hypothesized that HCPs err on the side of caution and tend to institute less intensive glycemic control practices (i.e., less aggressive insulin administration) so as to avoid hypoglycemia, and fear of poor patient outcomes. 34 –36 Furthermore, the American Diabetes Association recommends inpatient glycemic management practices in which, “A hypoglycemia management protocol should be adopted and implemented by hospitals or hospital systems. A plan for preventing and treating hypoglycemia should be established for each patient. Episodes of hypoglycemia in the hospital should be documented in the medical record and tracked. 37 ” Hospitals and hospital systems are subjected to fines and other financial implications given incidence of hypoglycemia and poor inpatient glycemic management. Optimal inpatient glycemic control has importance, not only for optimizing patient outcomes, but also has financial implications for health care institutions.
The model developed in this study was intended for use in an inpatient setting among a critical care patient population with or without a diagnosis of DM1 and DM2 respectively. Machine learning-based and other predictive modeling has been implemented in the past mostly for prediction of glucose in DM1 patients who are ambulatory, in an uncontrolled setting, and maintain an active lifestyle. 22 –25 Previous research completed by members of our research team resulted in the development of similar predictive models for DM1 patients 26 ; however, the model input features were significantly different from the ICU patient population as they included predictors such as nutritional intake, lifestyle/activity factors, and emotional states. Furthermore, the DM1 patient population used in this study were on only one form of insulin therapy continuous subcutaneous insulin infusion via an insulin pump. The accuracy of predictive models developed by members of our team 26 have been compared against other modeling approaches and have been shown to perform equally or outperform other previous approaches 22 while maintaining a longer model PH and forecast window. The increased predictive capabilities and performance of these models and the model developed in this study may be associated with the comprehensive set of model input features provided to the model to include lifestyle\activity and emotional factors for the DM1 models and a comprehensive set of patient health records extracted from an institutions EMR database.
As discussed in this article, the predictive model developed for this study is intended for an ICU patient population, and as such, it would not be a valid comparison to compare previous modeling approaches intended for patients with DM who are in an ambulatory uncontrolled setting, monitor POC glucose values less frequently, and have other factors that influence glycemic trends. Although patients enrolled in our study experienced significant glycemic variability, they were present in a controlled setting and monitored by health care professionals consistently. Being present in such a controlled setting may or may not be a contributing factor to the model accuracy that was achieved during this study. The patients enrolled in this inpatient study were however subjected to different modalities of insulin therapy such as intravenous infusion and subcutaneous insulin injections with a combination of long-acting and short-acting insulin that needed to be accounted for in the developed modeling approach. Finally, the patients in this study were admitted to an ICU and thus subjected to a variety of other medications, treatments, and interventions that influence future glycemic excursions in different ways. Our team believes a machine learning-based modeling approach such as the model developed during this study is critical to identifying patterns and trends in the patient health care record that relate to future glycemic responses. Although research has been completed to leverage CGM data to support development of algorithms to provide MPC and modify insulin administration and optimize glycemic control in inpatient critical care setting, it is difficult to compare this previous work with the results achieved in our study. 33 We hypothesize that the model developed in this study with its significant model PH has the potential to drive future insulin dosing recommendation algorithms and to recommend an optimal frequency of POC glucose monitoring to ensure patient glucose values remain within a HCPs' desired target range.
The significant accuracy and clinical acceptability of the models generated in this study demonstrate their potential for use in future products and technologies to optimize inpatient glycemic management for patients with and without diagnosis of DM. Predictive model results can be leveraged by future algorithms embedded within CDSSs to recommend optimal insulin dosages and the frequency of POC glucose monitoring required to ensure patient safety and avoid hypo- and hyperglycemia. The accuracy of predictive models is the major consideration in terms of future decision support algorithm development as the ANN model predictions can be used to generate insulin therapy recommendations. Predictive model inputs representing specific insulin therapeutic delivery mechanisms and dosages can be iterated through multiple values by an algorithm. The outputs of this process may be leveraged to determine the insulin dosage(s) that lead to the best degree of glycemic control. Future studies are currently being pursued by our research team to investigate the utility of such a model to drive an insulin dosage recommendation engine such as this.
Although our study yielded promising results, it is important to note its limitations and future work that needs to be accomplished. ANNs can be viewed as a “black box” where it is extremely difficult to determine why model-generated outputs and predictions occur. As such, researchers developing such models need to identify ways to make model-generated outputs more transparent and understandable.43 For health care applications such as this, it is important to provide HCPs with “trust” in the model-generated outputs. Predictive models can serve a “what if” simulation capability that provides HCPs a mechanism to change model inputs and evaluate the impact of treatment decisions (e.g., modification of insulin administration) before committing to them. This combined with the other EMR data visualization capabilities of future CDSSs may help to make a ANN-based model less of a black box solution. Additional limitations of ANNs and other machine learning-based models is that they require a large and significant source of training data to fully capture all patient glycemic responses related to the various model input features. This limitation was noted given the reduced performance of the models developed in this study in the prediction of hypoglycemia as noted previously. Even with large and comprehensive model training sets, there also exists the potential of training models to be specific to patients at a particular health care institution. This could have occurred during this study as the model could have identified patterns and trends in glycemic responses that may be attributed to institution-specific factors such as, for example, the OSUWMC insulin infusion protocol. Further validation of the developed models at other health care institutions both retrospectively and prospectively is warranted and will be the subject of future efforts by our research team.
A further limitation is that the model developed in this effort requires the availability of CGM data. To address this limitation our research team has also developed models for that leverage only historical and real-time POC glucose monitoring results in combination with the various categories of patient data available in the patient's EMR as summarized previously. These predictive models offer the same functionality, that is, prediction of a complete trajectory of glucose values up to a PH of 135 min. As such, these models will provide the same comprehensive functionality using the current standard of care for inpatient settings (POC blood glucose bedside monitoring) and accommodating future CGM technologies that may eventually be adopted and become the standard of care. Future research will require the predictive models embedded to be used prospectively with use of both POC blood glucose values and CGM technologies to compare CDSS recommendations against reference decisions made by expert HCPs to demonstrate their safety and effectiveness.
This study demonstrates the strong potential for data-driven modeling approaches such as the ANN model developed in this effort. As more data are collected to support model refinement and validation, model accuracy may also improve. A unique feature of the developed model is that it provides a capability to predict a complete trajectory of glucose values thereby providing more useful trending information for health care professionals as they evaluate treatment options. For machine learning-based models such as the ANN developed in this study, it would be worthwhile to provide a “what if” simulation capability for their use in clinical settings. This will provide more transparency for model-generated predictions, instill more trust across targeted end users, and increase the potential for adoption of technologies implementing the model across various inpatient settings.
Conclusion
There is a tremendous growth in the adoption and utilization of machine learning-based approaches within health care technologies and software applications. As such, the model developed and evaluated during this study faces less resistance to being adopted and utilized by HCPs in the inpatient setting. Model accuracy has been shown to be significant, and although it requires further studies to evaluate its utilization prospectively, it has value currently in terms of being integrated into future CGM technologies or CDSSs that will serve to support HCPs in the optimization of inpatient glycemic control. In its current state, the model can be used as a decision aide not as a replacement for clinical decisions. With future investigation and development however, such models can potentially provide not only clinical decision support but also can provide a mechanism for semi-closed loop or closed loop insulin delivery.
Footnotes
Acknowledgments
The authors acknowledge sponsors of this study without which the development and clinical study would not have been possible.
Author Disclosure Statement
S.P. is an inventor on the patent for some of the underlying components of the GlyCU system that is licensed by the University of Toledo to Analytic Diabetic Systems, Inc. S.P. is on the Board of Directors and co-founder of Analytic Diabetic Systems, Inc. and holds an equity position in the corporation. B.C. is an inventor on the patent for some of the underlying components of the GlyCU system that is licensed by the University of Toledo to Analytic Diabetic Systems, Inc. The other authors have no competing financial interests.
Funding Information
This study was supported by a $98,366 grant provided by the State of Ohio's Third Frontier Program (Grant No. TECG20140125) and $20,000 provided by the Department of Anesthesiology at The Ohio State University Wexner Medical Center.
Supplementary Material
Supplementary Data
References
Supplementary Material
Please find the following supplemental material available below.
For Open Access articles published under a Creative Commons License, all supplemental material carries the same license as the article it is associated with.
For non-Open Access articles published, all supplemental material carries a non-exclusive license, and permission requests for re-use of supplemental material or any part of supplemental material shall be sent directly to the copyright owner as specified in the copyright notice associated with the article.