




Abstract
Background:
Acarbose (ACA) can effectively reduce the postprandial blood glucose and has similar antidiabetic effects as metformin (MET). To our knowledge, few studies have compared the effect of ACA or MET on glucose fluctuations. In the present study, we explored the effect of ACA or MET combined with premixed insulin (INS) on glycemic control and glycemic variability (GV).
Methods:
This was an open-label randomized trial that was conducted in type 2 diabetic patients taking premixed insulin. The patients were assigned to 12 weeks of MET (n = 62) or ACA (n = 62) treatment combined with INS. The main outcomes were changes in GV and glycosylated hemoglobin A1c (HbA1c) compared with baseline.
Results:
Compared with baseline, several GV indices (standard deviation [SD], mean amplitude of glycemic excursions [MAGE]) and blood glucose control indices (mean glucose [MG], time in range [TIR] and HbA1c) were both significantly improved in INS+ACA and INS+MET after 12-week therapy. However, coefficient of variation (CV) was significantly reduced in INS+ACA but not in INS+MET. Moreover, compared with INS+MET, INS+ACA led to a more pronounced percentage change from baseline in CV (26.3% [1.7%–44.6%] vs. 11.9% [−7.0% to 29.9%], P = 0.022), MAGE (40.5% [20.1%–60.5%] vs. 25.2% [−2.1% to 43.4%], P = 0.007) and SD (38.6% [25.2%–57.9%] vs. 30.1% [10.8%–46.5%], P = 0.041).
Conclusion:
Both MET and ACE combined with INS effectively reduced blood glucose. Compared with MET, ACA combined with INS reduced GV.
Introduction
In 2013,
Soupal et al. showed that GV is higher in type 1 diabetes patients with microvascular complications irrespective of glycemic control. 7 Mechanism research showed that oscillating glucose can have more deleterious effects than constant high glucose on endothelial function and oxidative stress, two key players in favoring cardiovascular complications in diabetes. 8 Another research implied that oscillating glucose was more effective in triggering the generation of nitrotyrosine and inducing the expression of adhesion molecules and IL-6 than stable high glucose. 9 The major aims of glycemia control are to overcome chronic hyperglycemia and to minimize GV as well. 10 However, most clinical trials target mean hyperglycemia as the efficacy measurement and few trials have taken GV into account as an important component of poor glucose control. 10
The Diabetes Epidemiology: Collaborative Analysis of Diagnostic Criteria in Europe (DECODE) study showed that the correlation of 2-h postprandial blood glucose with coronary heart disease and total mortality was closer than that of fasting blood glucose. 11 There was no correlation between fasting blood glucose and all causes of death after 2-h postprandial blood glucose was adjusted for. This finding implied that postprandial blood glucose level might be more closely related to chronic complications of diabetes compared with fasting blood glucose level.
Acarbose (ACA) is a widely used oral antidiabetic agent in Chinese population who take carbohydrate as main food composition. It inhibits the activity of alpha-glucosidase in the epithelial cells of the upper brush margin of the small intestine. 12 Thus, it delays digestion of carbohydrates and delays absorption of glucose from the decomposition of disaccharides and polysaccharides. Therefore, acarbose can effectively reduce blood glucose, especially postprandial blood glucose, thereby reducing the fluctuation of blood glucose, and it is one of the monotherapy antidiabetics in the Chinese type 2 diabetes guidelines. 13,14
Metformin (MET) is another commonly used oral antidiabetic drug, which can reduce hepatic glucose production and peripheral insulin resistance and thereby reduce blood glucose. 15 It is a first-line oral antidiabetic drug recommended by Chinese and international guidelines for type 2 diabetes. 14,16 In 2014, the results from an open-label, noninferiority randomized trial in Chinese newly diagnosed diabetes patients implied that acarbose and metformin had similar antidiabetic effects, as evaluated by the reduction of glycosylated hemoglobin A1c (HbA1c). 17
Thus, we speculated that while ACA has a similar overall antidiabetic effect as MET, it can better reduce the fluctuation of blood glucose. Premixed biosynthetic human insulin (INS) is an effective antidiabetic injection. However, it has the risk of causing a high incidence of hypoglycemia and a large glycemic fluctuation. 18 To our knowledge, there was no study that had compared the effect of ACA or MET on glucose fluctuations in INS users. Therefore, in the present study, we explored the effect of ACA or MET combined with premixed INS on glycemic control and GV evaluated by continuous glucose monitoring (CGM), which is a monitoring technology that can capture blood glucose fluctuations over 24 h.
Methods
Trial design and participants
The present study was a 12-week, open-label, randomized controlled clinical trial. Subjects referred to the outpatient clinic at the Department of Endocrinology and Metabolism of Shanghai Jiao Tong University Affiliated Sixth People's Hospital were consecutively recruited. We enrolled patients who were treated with premixed biosynthetic human INS, but with poor blood glucose control from 2016 to 2018. Premixed INS was defined as 30% regular biosynthetic human INS mixed with 70% isophane biosynthetic human INS.
The inclusion criteria were as follows: (1) diagnosis of type 2 diabetes; (2) daily dose of premixed INS injection higher than 20 IU/d and lower than 1 IU/(kg·day); (3) age from 30 to 70 years; (4) body mass index (BMI) between 18.5 and 35.0 kg/m2; and (5) 7.0% ≤ HbA1c ≤ 10.0%. The exclusion criteria were as follows: (1) unable to tolerate glucosidase inhibitors or suffering from gastrointestinal diseases; (2) having contraindications to metformin; (3) suffering from severe liver or kidney diseases; (4) taking drugs affecting glucose metabolism; (5) having experienced severe hypoglycemia or unconscious hypoglycemia repeatedly; and (6) taking more than two oral antidiabetic drugs (including two) or taking one oral antidiabetic drug at the maximum therapeutic dose.
Standard protocol approvals, registrations, and patient consents
The study protocol was approved by the Ethics Committee of Shanghai Jiao Tong University Affiliated Sixth People's Hospital and was in accordance with the Declaration of Helsinki. Informed consent was obtained from each participant. This trial is registered at
Randomization, intervention, and procedure
After signing the informed consent, each subject conducted blood tests and physical examinations at the screening visit and was asked to stop taking oral antidiabetic drugs. At least 1 week later, the subjects who met the screening requirements were randomly divided into two groups (1:1) according to the random encoder (metformin group [INS+MET] or acarbose group [INS+ACA]). Then, the eligible patients underwent CGM and a standardized meal test (baseline) before the study drugs were distributed.
The initial dose of ACA was 50 mg three times a day at three meals. One week later, the dose was raised to 100 mg three times a day at three meals. The dose of MET was 500 mg three times a day after three meals from the beginning to the end of the observation. The observation period was 12 weeks. In the first 4 weeks, visits with patients were scheduled every week. Afterward, follow-up visits were arranged every 2 weeks. INS dose was adjusted according to the self-monitoring of blood glucose by the same experienced endocrinologist at each follow-up visit. CGM and standardized meal tests were performed again at the 12-week follow-up visit.
Key withdrawal criteria of the study included severe hypoglycemia and serious adverse events that the investigators considered not appropriate for continuation; severe protocol deviation, including poor drug compliance, inability to continue according to protocol requirements, and unwillingness to follow the study arrangements.
Anthropometric and biochemical measurements
Blood pressure was the average of two measurements made with a sphygmomanometer. Fasting plasma glucose (FPG) and 2-h postprandial plasma glucose (PG2h) levels were measured using a glucose oxidase method. HbA1c was measured by high-performance liquid chromatography. Serum C-peptide (CP) level was measured using a chemical luminescence method. Triglycerides (TG), total cholesterol (TC), high-density lipoprotein cholesterol (HDL-C), and low-density lipoprotein cholesterol (LDL-C) were assayed as previously reported. 19
CGM parameters
A retrospective CGM system (Medtronic, Inc., Northridge, CA) was used for subcutaneous interstitial glucose monitoring for three consecutive days. It was performed at baseline (week 0: −3 days to week 0) and at the end of the study (week 12: −3 days to week 12), and subjects were asked to wear the monitor for at least 72 h each time.
Intraday GV was estimated by the glucose coefficient of variation (CV), mean amplitude of glycemic excursions (MAGE), and standard deviation (SD) of blood glucose values. 19,20 CV was calculated by dividing SD by the average of the corresponding glucose readings. The CV values in this article are multiplied by 100 and expressed as CV, %. MAGE was calculated by measuring the arithmetic mean of the difference between consecutive peaks and nadirs; measurement in the peak-to-nadir or nadir-to-peak direction was determined by the first qualifying excursion; only excursions of more than 1 SD of the mean glycemic values were considered because MAGE was designed to quantify only major swings of glycemic instead of minor ones. 21 Mean glucose (MG) was defined as the mean of daily continuous 24-h blood glucose. The definition of time in range (TIR) was the percentage of time in the target glucose range of 3.9–10.0 mM during a 24-h period. Time below range (TBR) or time above range (TAR) was defined as the percentage of time in the glucose range of ≤3.9 mM or ≥10 mM during a 24-h period.
Standardized meal test
Standardized meal tests were performed at baseline and at the 12-week follow-up visit. Fasting blood samples were collected after an 8-h overnight fast. After that, the patient ate standardized instant noodles containing 69.3 g of carbohydrates, 9.3 g of protein, and 1.5 g of fat; total calories were 327.9 kcal. The caloric contribution of the standardized instant noodles was 16.5% of the total daily energy intake. The caloric contribution of protein to the standardized instant noodles was 11.3%, of fat was 4.1%, and of carbohydrates was 84.5%. Postprandial blood was collected 2 h later.
Outcomes
Primary outcomes are changes in HbA1c and MAGE compared with baseline. Secondary outcomes are changes in CV, SD, MG, TIR, TAR, TBR, FPG, PG2h, fasting serum C-peptide (FCP), and 2-h postprandial serum C-peptide (CP2h), compared with baseline. Changes in BMI, blood pressure, lipid profiles, and daily INS dose compared with baseline were also observed. The safety analysis mainly included the incidence of self-reported hypoglycemia and gastrointestinal adverse events in the two groups.
Determination of sample size and statistical analyses
Since the present study was a pilot study, sample size calculation was not performed, and a convenience sample size was adopted. Variables with an approximately normal distribution are presented as means ± SD, while those with a skewed distribution are shown as median (interquartile range [IQR]). Continuous variables at baseline were compared between the two groups by Student's t-test. Differences in the parameters before and after treatment were analyzed by the paired t-test. The changes in variables were compared with Student's t-test. Skew-distributed variables were tested by the rank sum test. Comparison of categorical variables between groups was performed by the chi-square test. Statistical analyses were performed using SPSS software version 17.0 (SPSS, Inc., Chicago, IL). A P value of <0.05 (two-tailed) was considered statistically significant.
Results
In the present study, 134 patients were recruited, of whom 10 failed in screening, so 124 subjects were randomly assigned, and 115 subjects completed the whole procedure (Fig. 1). The characteristics of the participants are shown in Table 1. The types of taking oral antidiabetics were metformin, alpha-glucosidase inhibitor, sulfonylureas, nateglinide and thiazolidinedione. At baseline, there were no significant differences in most of the clinical parameters, including BMI, duration of diabetes, blood pressure (systolic blood pressure [SBP] and diastolic blood pressure [DBP]), lipid profile (TC, TG, HDL-C, and LDL-C), metrics of glucose control (FPG, PG2h, and HbA1c), measures of insulin secretion (FCP and CP2h), and daily INS dose or INS dose per kilogram body weight (all P > 0.05). As for CGM parameters, there were no significant differences in MG, TIR, TBR, or TAR, but SD, CV, and MAGE were significantly higher in INS+ACA than in INS+MET (SD, P = 0.008; CV, P = 0.001; MAGE, P = 0.008).
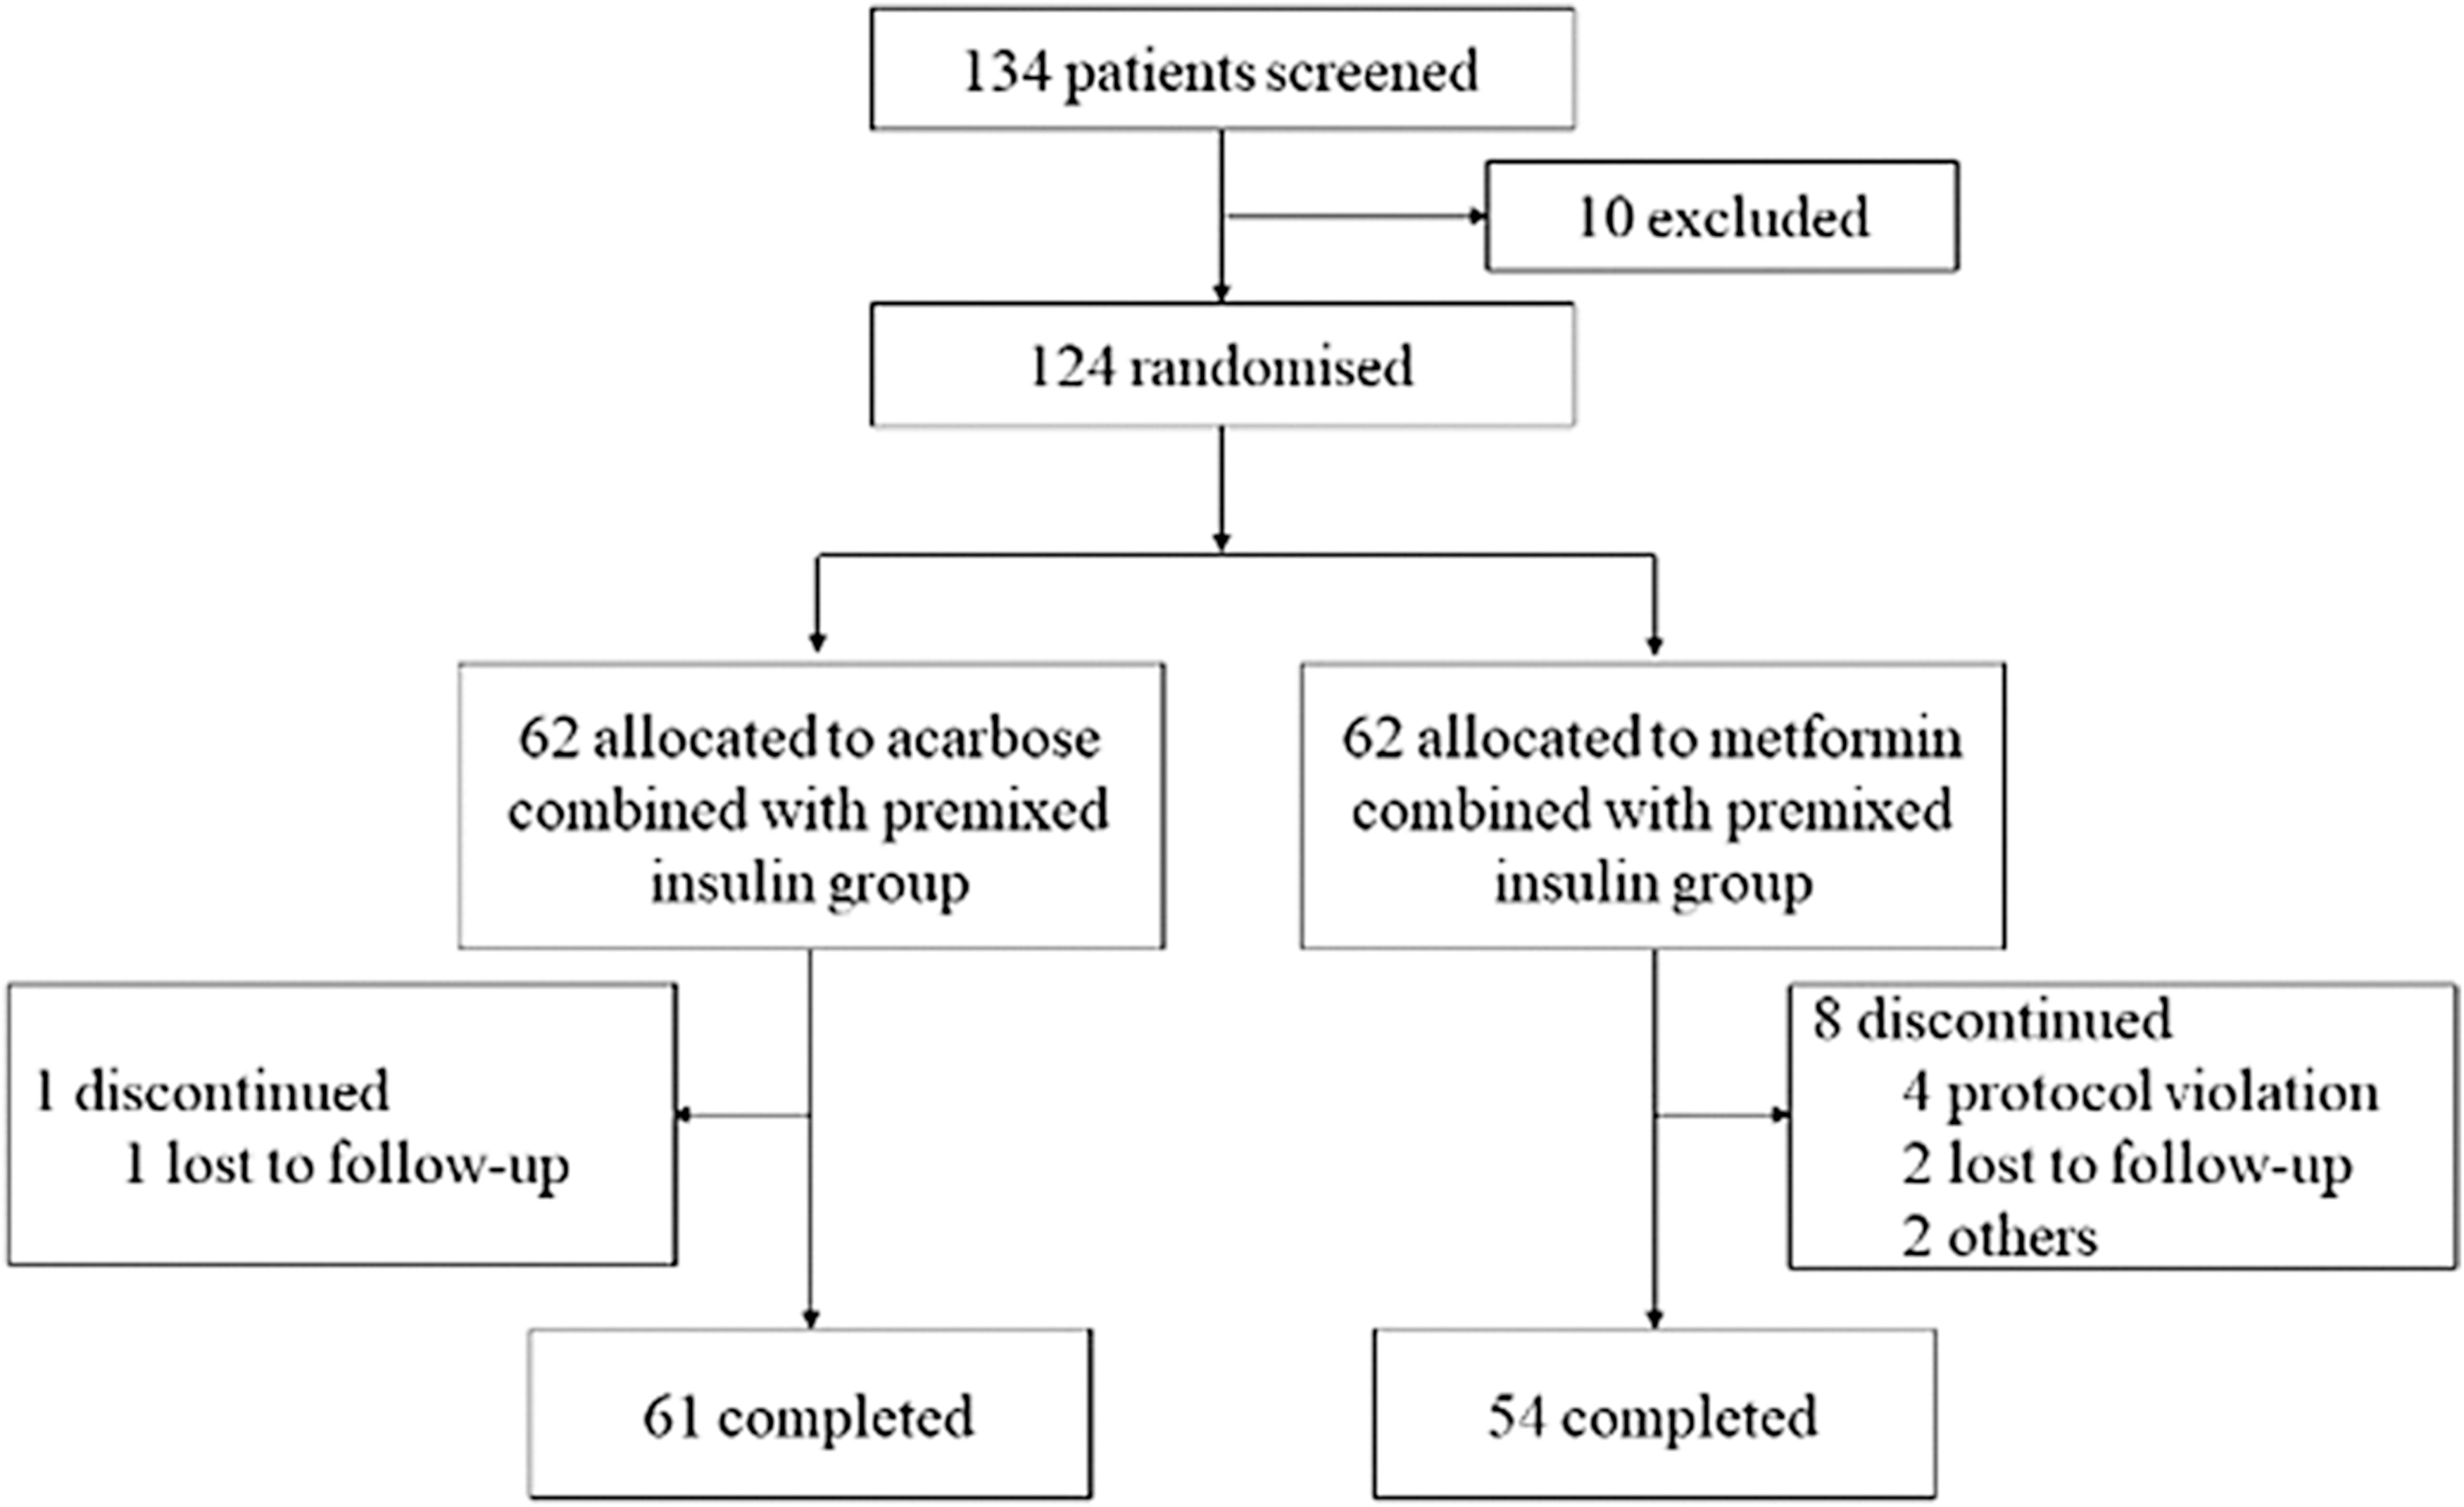
Participant flow.
Clinical Characteristics of the Participants at the Baseline
Continuous variables with approximately normal distribution are presented as means ± SD, while those with skew distribution are shown as median (IQR) and classified variable as frequencies and percentages.
SD of blood glucose values.
BMI, body mass index; CP2h, 2-hour postprandial serum C-peptide; CV, coefficient of variation; DBP, diastolic blood pressure; FCP, fasting serum C-peptide; FPG, fasting plasma glucose; HbA1c, glycosylated hemoglobin A1c; HDL-C, high-density lipoprotein cholesterol; IQR, interquartile range; LDL-C, low-density lipoprotein cholesterol; MAGE, mean amplitude of glycemic excursions; MG, mean glucose; PG2h, 2-hour postprandial plasma glucose; SBP, systolic blood pressure; SD, standard deviation; TAR, time above range; TBR, time below range; TC, total cholesterol; TG, triglycerides; TIR, time in range.
Compared with baseline, the CGM parameters (MG, SD, MAGE, TIR, and TAR) were significantly improved in both INS+ACA and INS+MET (all P < 0.05) (Table 2) after 12-week therapy. CV was significantly reduced in INS+ACA (before: 26.9% ± 9.7%; after: 19.9% ± 7.4%, P < 0.001), but not in INS+MET (before: 21.7% ± 6.8%; after: 19.7% ± 6.8%, P = 0.093) after 12 weeks intervention. TBR was not changed after treatment in either group. The CGM tracings are presented in Figure 2.
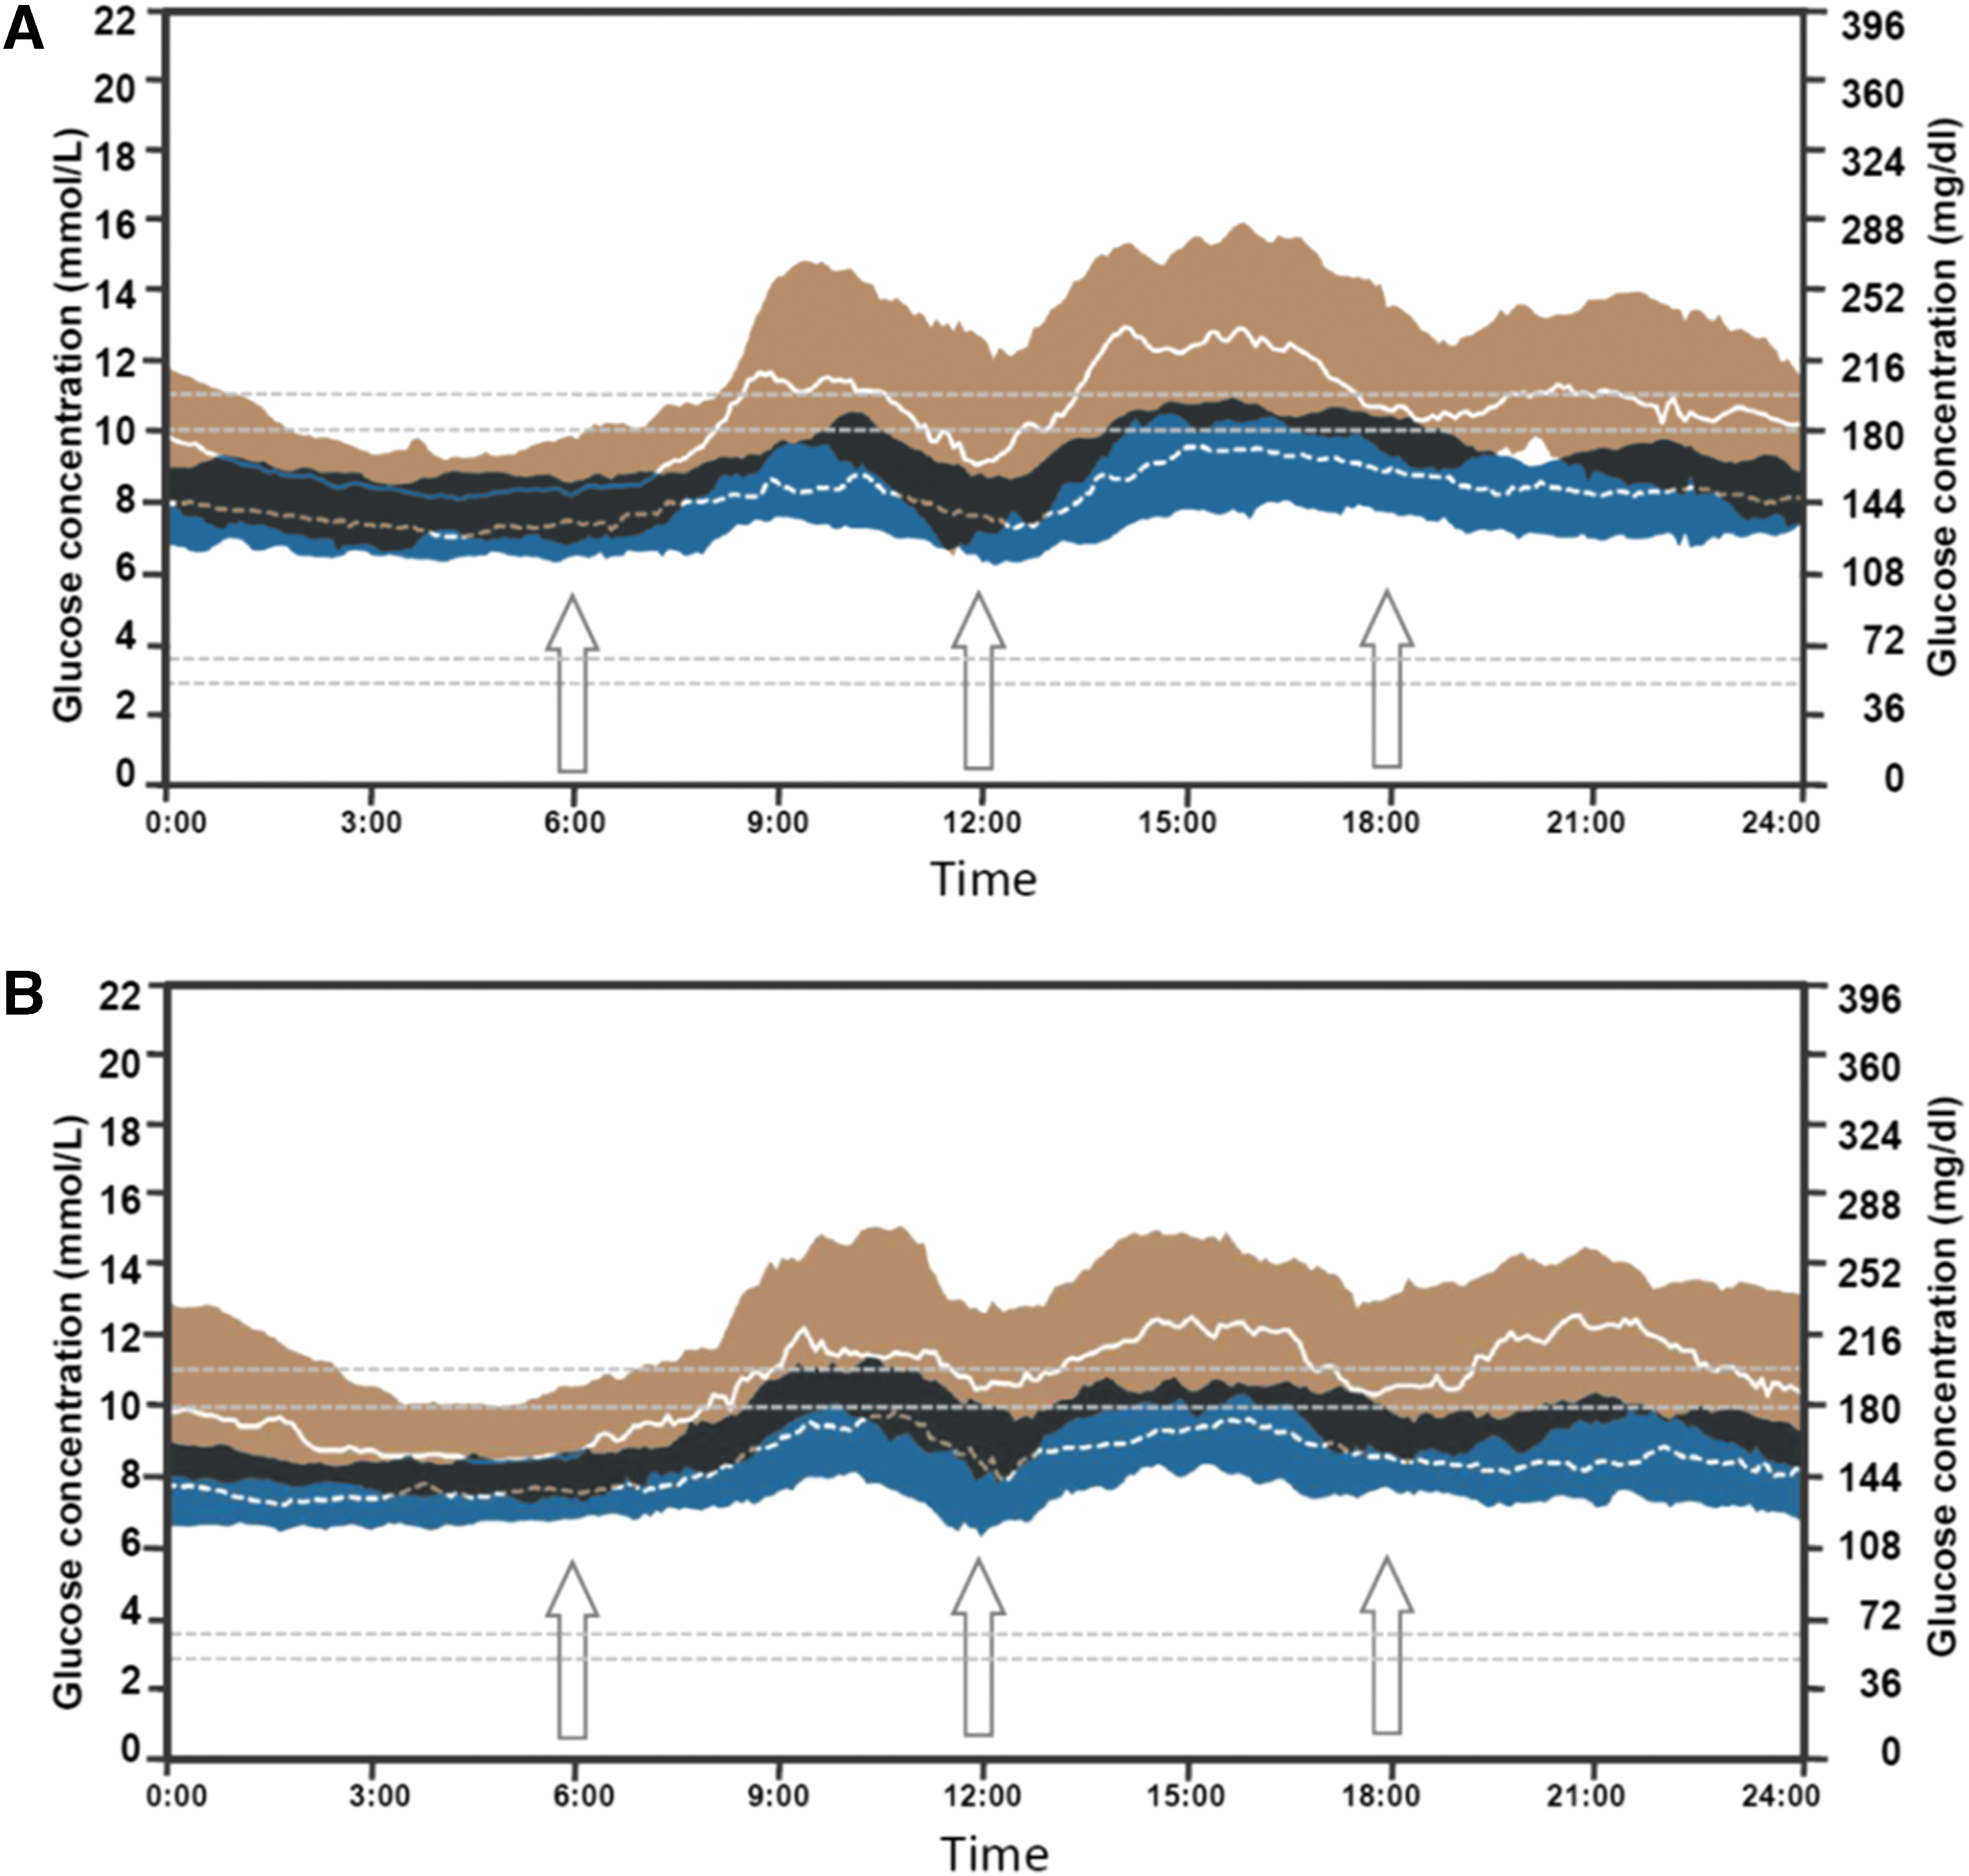
Comparison of average continuous glucose monitoring tracings between the
Changes in Clinical Characteristics After Acarbose or Metformin Treatment
SD of blood glucose values.
P < 0.05 compared with acarbose.
P < 0.01 compared with acarbose.
CI, confidence interval.
Since there were significant differences in the metrics of GV, including SD, CV, and MAGE, between the two groups at baseline, we compared the percentage reduction from baseline between the two groups after 12 weeks of intervention. Compared with INS+MET, INS+ACA led to more pronounced improvements in CV (26.3% [1.7%–44.6%] vs. 11.9% [−7.0% to 29.9%], P = 0.022), MAGE (40.5% [20.1%–60.5%] vs. 25.2% [−2.1% to 43.4%], P = 0.007), and SD (38.6% [25.2%–57.9%] vs. 30.1% [10.8%–46.5%], P = 0.041) (Fig. 3).

The percent of reduction of CV, MAGE, and SD from baseline between the two groups after 12 weeks intervention. Compared with INS+MET, INS+ACA led to more pronounced percent change in CV (P = 0.022), MAGE (P = 0.007), and SD (P = 0.041). CV, coefficient of variation; MAGE, mean amplitude of glycemic excursions.
In terms of other clinical parameters, FPG, PG2h, and HbA1c were significantly improved in both INS+ACA and INS+MET, compared with baseline (all P < 0.05) (Table 2) after 12-week therapy. There were significant decreases in FCP (before: 2.0 ± 1.1 ng/mL; after: 1.9 ± 1.0 ng/mL, P = 0.037) in INS+MET and in CP2h (before: 4.1 ± 1.6 ng/mL; after: 2.8 ± 1.7 ng/mL, P < 0.001) in INS+ACA. Plasma glucose levels and serum C peptide levels at baseline and after 12-week treatment were shown as histograms in Figure 4. Moreover, SBP and BMI were significantly decreased in INS+ACA (SBP: before: 136.11 ± 15.97 mmHg; after: 130.79 ± 13.56 mmHg, P = 0.004; BMI: before: 25.60 ± 2.60 kg/m2; after: 25.24 ± 2.62 kg/m2, P < 0.001), but not in INS+MET (SBP: before: 137.26 ± 12.93 mmHg; after: 133.44 ± 15.61 mmHg, P = 0.094; BMI: before: 26.42 ± 2.76 kg/m2; after: 26.25 ± 2.80 kg/m2, P = 0.157). The improvements in clinical variables were similar between INS+MET and INS+ACA, except that the reductions in PG2h (−8.6 ± 4.9 mM vs. −4.5 ± 3.7 mM, P < 0.001) and CP2h (−1.3 ± 1.5 ng/mL vs. −0.2 ± 1.3 ng/mL, P < 0.001) were significantly greater in INS+ACA than in INS+MET.
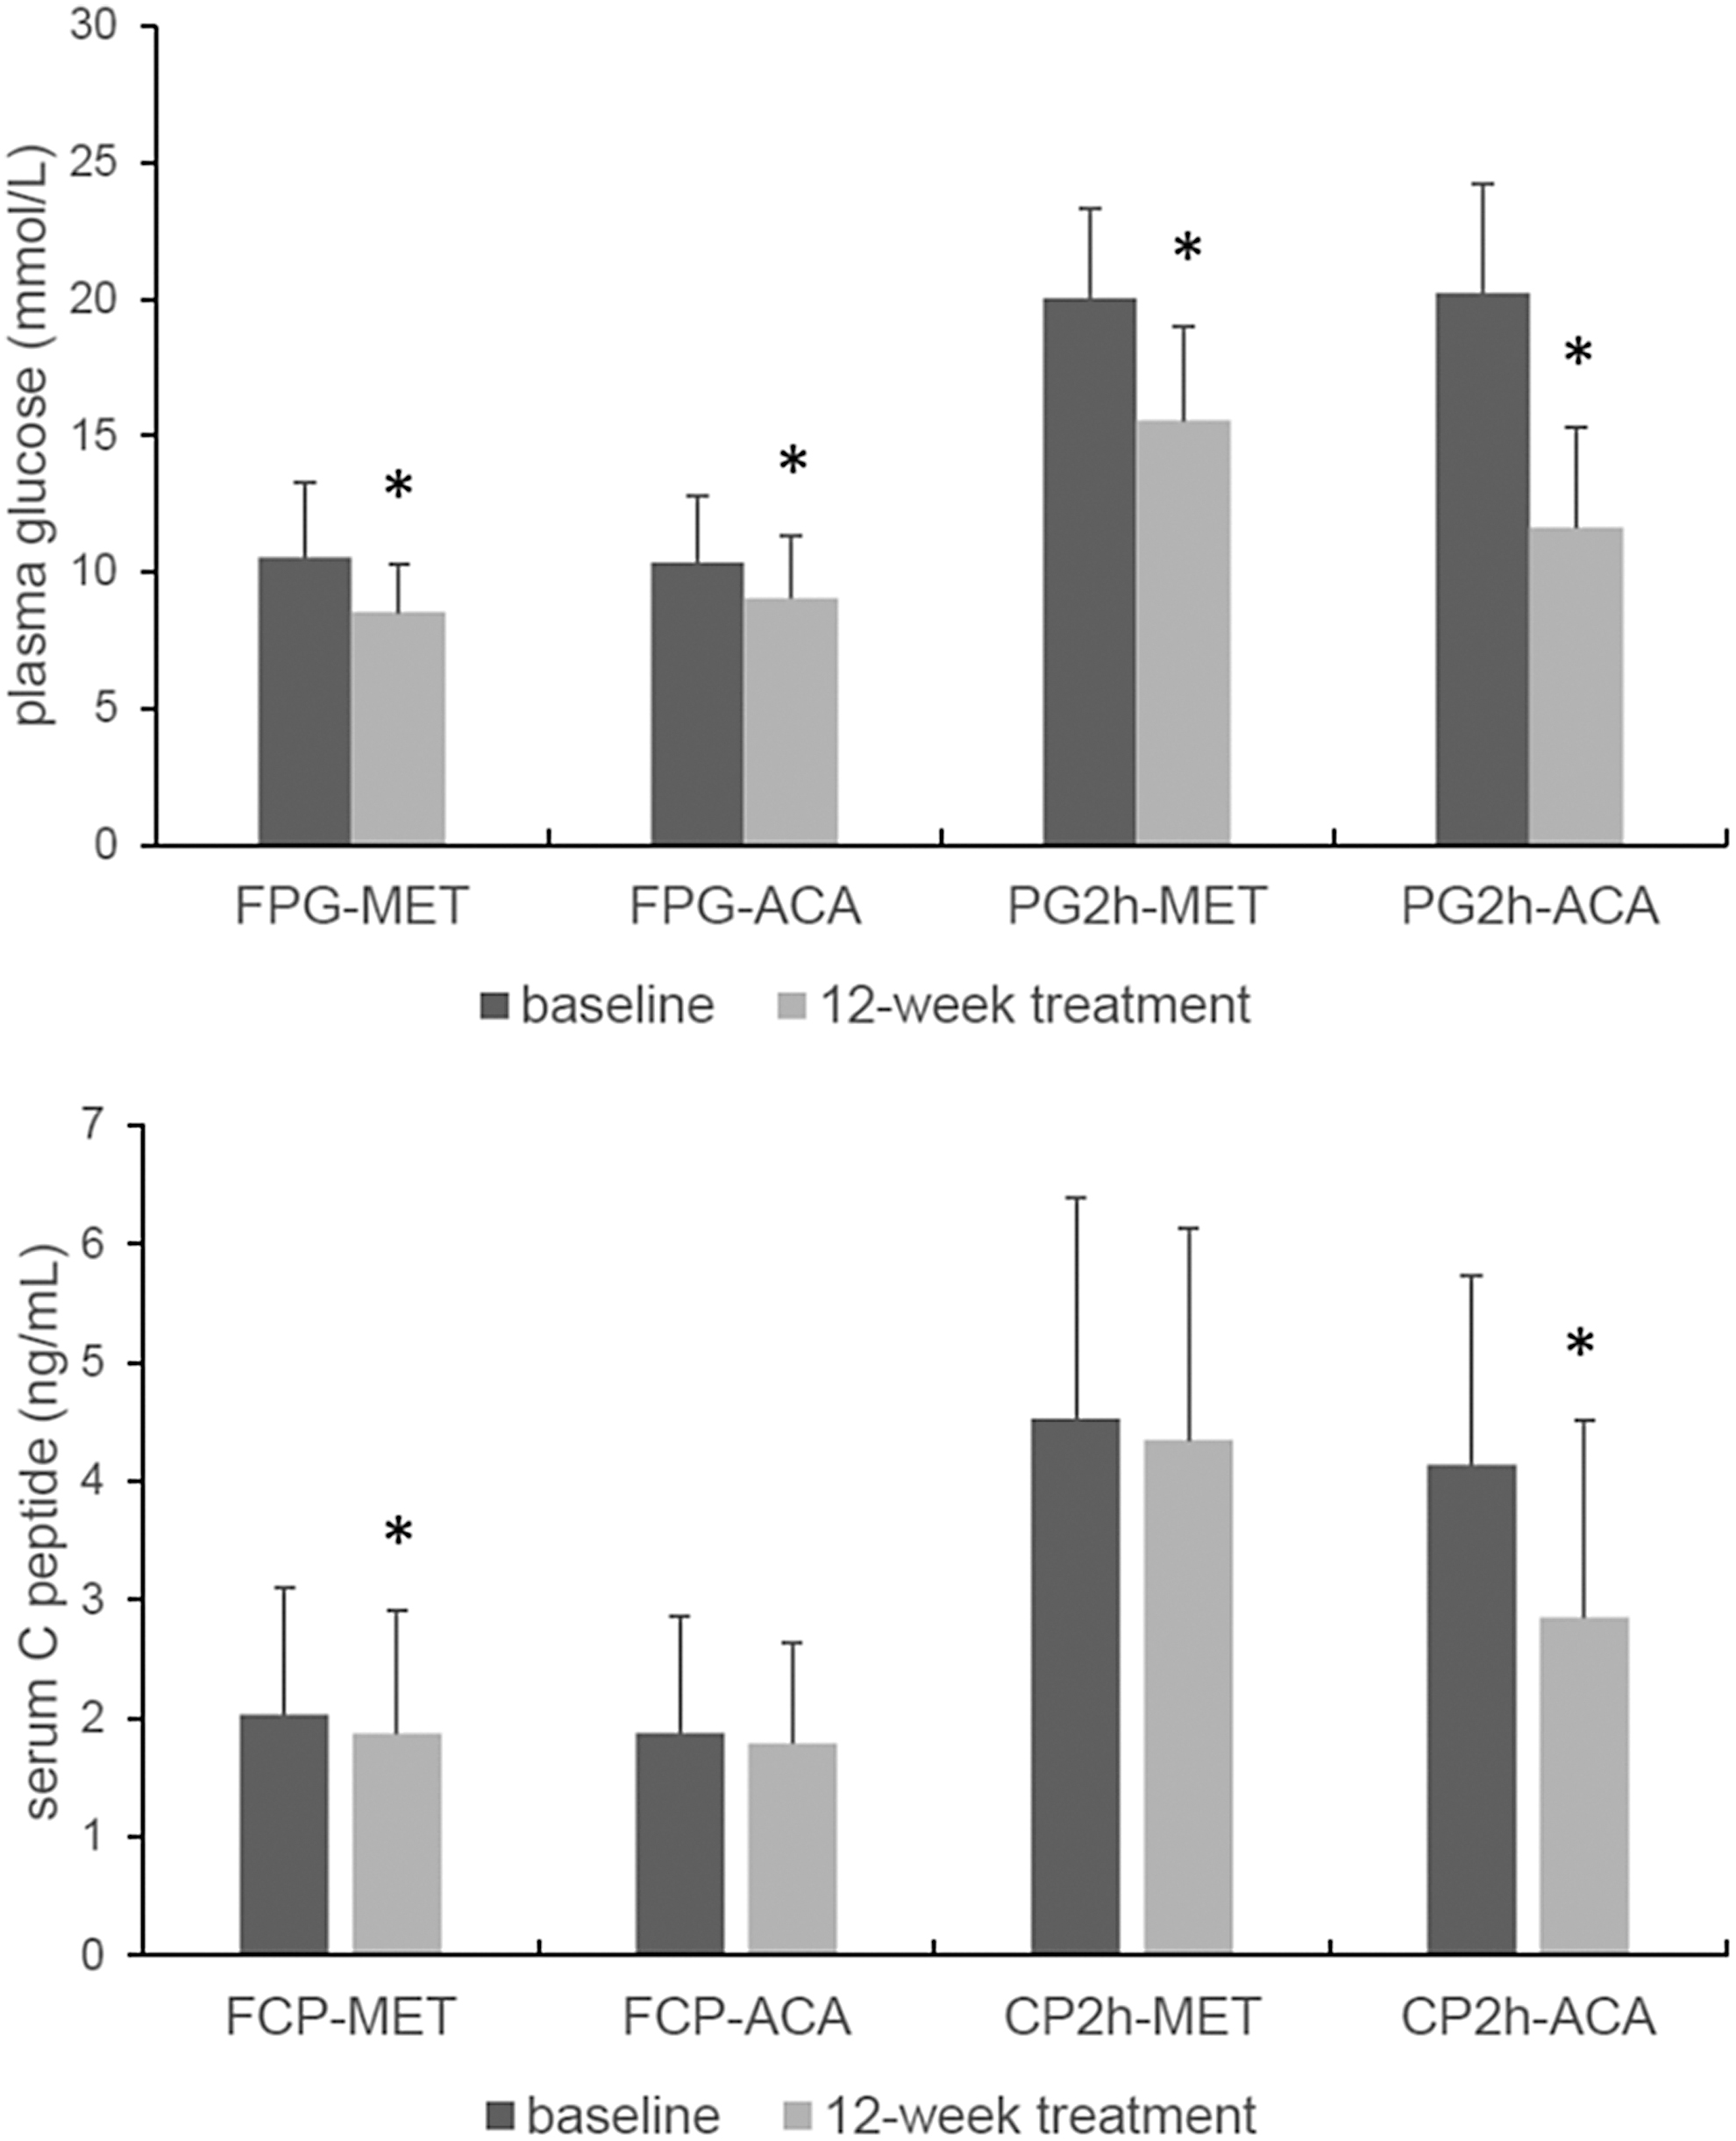
Plasma glucose levels and serum C peptide levels at baseline and after 12-week treatment. At baseline, there were no significant differences in FPG, PG2h, FCP, and CP2h between INS+ACA and INS+MET groups. FPG and PG2h were significantly improved in both INS+ACA and INS+MET compared with baseline. There were significant decreases in FCP in INS+MET and in CP2h in INS+ACA. Plasma glucose levels and serum C peptide levels are presented as means + SD. *P < 0.05. CP2h, 2-hour postprandial serum C-peptide; FCP, fasting serum C-peptide; FPG, fasting plasma glucose; PG2h, 2-hour postprandial plasma glucose.
During the study period, adverse events (except for hypoglycemia) occurred five times in the INS+MET group and six times in the INS+ACA group. One case of gastrointestinal discomfort in the INS+ACA group was considered to be related to the study drug, while the other adverse events were not related to the study drugs. Hypoglycemia was observed in two subjects in the INS+MET group and in six subjects in the INS+ACA group throughout the study, and none of them was severe hypoglycemia. There was no significant difference in hypoglycemia incidence between these two groups.
Discussion
In the present study, it was found that after 12 weeks of treatment, both the INS+ACA group and the INS+MET group showed a significant reduction in HbA1c, but there was no significant difference in the magnitude of HbA1c reduction between the two groups. These results were consistent with previous studies. In the study of Yang et al., it was found that after 24 and 48 weeks of treatment for newly diagnosed diabetes patients, the HbA1c was reduced by 1.17% and 1.11%, respectively, in the acarbose group and by 1.19% and 1.12% in the metformin group, with no difference between the two groups. 17 Another study in patients taking sulfonylureas showed that HbA1c decreased from baseline in both the acarbose group and metformin group after 12 weeks of add-on therapy, and there was no significant difference between the two groups. 4 Similar results were seen in a study using acarbose or metformin in combination with insulin. 22
Furthermore, we evaluated TIR in each subject by CGM. TIR, identified as a metric of glycemic control that provides more actionable information than HbA1c alone, is gradually regarded as an acceptable end point for clinical trials. 23 –26 A recent study evaluated the association of TIR with the development or progression of retinopathy and development of microalbuminuria using the Diabetes Control and Complications Trial (DCCT) data set and showed that TIR was strongly associated with the risk of microvascular complications. 23 Another study in a Chinese population demonstrated that TIR assessed by CGM was associated with diabetic retinopathy in type 2 diabetes. 19 In the present study, we found that TIR was reduced by a similar magnitude between the two groups. Therefore, it seems that both ACA and MET are effective in blood glucose control in both newly diagnosed diabetes patients and those who have received hypoglycemic treatment, and their effectiveness is similar.
We did not find a difference between the two drugs in reducing fasting glucose, which was different from the conclusion in newly diagnosed diabetes patients. Metformin was found to have a better effect in reducing fasting blood glucose than acarbose in newly diagnosed diabetes patients. 17 However, in the study of Wu et al., there was no difference in the reduction of fasting glucose between metformin and acarbose when both were combined with insulin. 22 The differences in population selection criteria might have caused the different results. The duration of diabetes in the study of Wu et al. was ∼8 years, while it was ∼14 years in the present study. The duration of diabetes in the study of newly diagnosed diabetes was less than 1 year.
The present study showed that ACA had a significantly stronger effect on reducing postprandial blood glucose than MET. The MARCH study provided similar results of postprandial blood glucose reduction as the present study. 17 The stronger effect on postprandial blood glucose reduction of ACA might be related to the different mechanism between ACA and MET. The main effect of ACA is to delay glucose absorption, while the main effect of MET is to inhibit liver glucose output. Thus, ACA was hypothesized to reduce GV, which was demonstrated by several previous studies. 27,28
In this study, we also used CGM technology to precisely test this hypothesis. The GV was evaluated by CV, SD, and MAGE. CV is currently considered the most accepted measurement of GV, and higher CV is associated with hypoglycemia. 29 After 12 weeks of treatment, several CGM parameters, such as SD and MAGE, were significantly improved in both INS+ACA and INS+MET, whereas CV decreased significantly only in the INS+ACA group. The reductions in CV, MAGE, and SD in the INS+ACA group were greater than in the INS+MET group. Thus, we believe that ACA had a better effect on reducing blood glucose fluctuations than MET.
In recent years, an increasing number of studies have supported the close relationship between blood glucose fluctuation and chronic complications. A positive association between increased GV and microvascular complications and coronary artery disease has been reported. 30 In type 2 diabetes, the intraday GV determined by a CGM system was associated with the presence and severity of coronary artery disease. 5 Deeper investigation revealed that glucose fluctuations exhibited a more specific triggering effect on oxidative stress (urinary excretion of 8-iso-prostaglandin F2α) than chronic sustained hyperglycemia did. 31 Moreover, glucose fluctuation was associated with endothelial dysfunction and inflammation, both factors traditionally associated with the pathogenesis of vascular damage. 32 A meta-analysis of seven long-term studies confirmed that acarbose, which is used primarily to reduce postprandial glucose, can prevent myocardial infarction and cardiovascular disease in type 2 diabetic patients. 33 Therefore, acarbose could be involved in preventing the onset and progression of diabetic chronic complications by reducing blood glucose fluctuation. This needs to be further confirmed by prospective studies.
The data in the present study show that the INS+ACA group had significantly reduced BMI and SBP compared with the baseline, while the INS+MET group did not show significant changes. Previous opinion held that α-glucosidase inhibitors had a neutral effect on body weight, whereas metformin had a mild weight reduction effect in overweight and obese patients with type 2 diabetes. 16 However, similar to our study, Willms and Ruge showed that the reduction in body weight over the treatment period was greater in the acarbose group than in the metformin group. 34 In clomiphene citrate-resistant polycystic ovary syndrome patients, the reductions in weight and BMI were significant in the acarbose group, but not in the metformin group. 35 Previous studies implied that acarbose might cause weight loss by inhibiting carbohydrate digestion and delaying gastric emptying. 36,37 Thus, the effect of acarbose on body weight reduction and the mechanism of this effect need deeper investigation.
With respect to the reduction of SBP by acarbose, although many previous studies have provided evidence for an effect, 38,39 it is still unclear. Gordin et al. found that daily glucose variability evaluated by MAGE was positively associated with the change in central blood pressure in type 1 diabetic patients. 40 Thus, ACA might be helpful in lowering blood pressure by reducing GV. The underlying mechanisms and their clinical relevance need to be examined further.
To our knowledge, this is the first study to evaluate the effect of acarbose compared to metformin when combined with premixed insulin on GV. Otherwise, this study was a well-documented clinical trial, which increase the reliability of our findings.
Several limitations of the study design should be noted. First, since this clinical trial was a pilot study, the sample size was relatively small and it was a single center study. There may be some bias in the results of our study and these results need to be confirmed by further studies with larger sample size. Second, the open label design of the current study may introduce some extent of bias. However, the different methods of drug delivery make it difficult to conduct a double-blind trial. Third, for ethical reasons, there was no placebo-controlled group in our study. Fourth, there was an imbalance of SD, CV, and MAGE at baseline, which might influence the results. We compared the percentage reduction of SD, CV, and MAGE from baseline between the two groups to weaken the impact. Fifth, in the present study, patients were not required to consume a standard diet during the study or at the CGM measurements, and the effect of individual dietary deviations on GV was not considered. However, before the intervention, each patient received lifestyle education delivered by the investigator who prescribed a meal plan comprising the quantity and type of food products according to China Guideline For Type 2 Diabetes (2013 Edition). 14 Participants were instructed to have three main meals (i.e., breakfast, lunch, and dinner) per day and avoid snacks. We recommended the patients to have 50 g rice or steamed bun in breakfast and had 75–100 g rice in lunch or dinner. Besides, they were encouraged to engage in 150 min or more of moderate-intensity physical activity per week and reduce the amount of time spent being sedentary. The instructions on diet and exercise were reinforced at each visit.
Acarbose's hypoglycemic effects might depend on the dietary starch content. A previous meta-analysis showed that the hypoglycemic effect of acarbose are greater in eastern hyperglycemic populations than in their western counterparts, and it is likely that the superior results in eastern populations are related to the mechanism of action of acarbose. 41 It has been shown that the effects of acarbose are greater when people take the carbohydrate of >50% of all calorie sources. 42 Eastern diets contain a greater proportion of starch (50%–60% energy from cereals) than western diets (30% energy from cereals). 41 This might be the reason why acarbose is more widely used in Asia than in the West.
The predominant side effect of acarbose is flatulence; loose stools and abdominal discomfort have also been reported. Slow titration from low to medium dose, focused patient education, and good dietary advice, including low sucrose consumption and fiber-rich diet, may help ameliorate the gastrointestinal adverse effects associated with acarbose. 43
In conclusion, both MET and ACA combined with INS effectively and safely reduced blood glucose, while adverse events and hypoglycemia in both groups were rare. Compared with MET, ACA combined with INS had a more profound effect on blood glucose fluctuations. In addition, ACA reduced body weight and SBP. All these effects of ACA might have positive impacts on delaying the development and progression of chronic diabetic complications.
Footnotes
Acknowledgments
The authors thank all the patients who took part in this study. The authors also thank all the involved clinicians, nurses, and technicians for dedicating their time and skill to this study.
Author Disclosure Statement
R.A.V. is an employee of Medtronic, Inc. No other potential conflicts of interest relevant to this article were reported.
Authors' Contributions
F.G. and X.M. collected and analyzed data and wrote the article. J.L., J.Z., R.A.V., Y.B., and W.J. interpreted the data and revised the article. J.Z. conceived the study. F.G., X.M., J.P., W.L., and W.Z. conducted the study and collected data. J.Z. are the guarantors of this work and, as such, had full access to all the data in the study and take responsibility for the integrity of the data and the accuracy of the data analysis.
Funding Information
This work was supported by the National Key R&D Program of China (2018YFC2001004); the Shanghai Municipal Education Commission—Gaofeng Clinical Medicine Grant Support (20161430); the Shanghai Municipal Commission of Health and Family planning General Program (201840232) and Bayer Healthcare Co. Ltd. All authors had full access to the data and final responsibility for the decision to submit for publication.