
Abstract
Background:
Glucose variability (GV) measured by continuous glucose monitoring (CGM) has become an accepted marker of glycemic control. Nevertheless, several methodological aspects of GV assessment require further study. We, therefore, investigated the minimum number of days needed to reliably measure GV, assessed GV reference values, and studied the correlation of GV with established glycemic indices (i.e., HbA1c, seven-point oral glucose tolerance test [OGTT]-derived indices).
Methods:
We used cross-sectional data from The Maastricht Study, an observational population-based cohort enriched with type 2 diabetes. Participants with more than 48 h of CGM (iPro2; Medtronic) were included for analysis (n = 851; age: 60 ± 9years; 49% women; 23% type 2 diabetes). We used mean sensor glucose (MSG), standard deviation (SD), and coefficient of variation (CV) as CGM-derived indices (the latter two for GV quantification). We calculated reliability using the Spearman–Brown prophecy formula, established reference values by calculating 2.5th–97.5th percentiles, and studied correlations using Spearman's rho.
Results:
Sufficient reliability (R > 0.80) was achieved with two (MSG and SD), or three monitoring days (CV). The reference ranges, assessed in individuals with normal glucose metabolism (n = 470), were 90.5–120.6 mg/dL (MSG), 7.9–24.8 mg/dL (SD), and 7.74%–22.45% (CV). For MSG, the strongest correlation was found with fasting plasma glucose (rho = 0.65 [0.61; 0.69]); for SD, with the 1-h OGTT value (rho = 0.61 [0.56; 0.65]); and for CV, with both the incremental glucose peak (IGP) during the OGTT (rho = 0.50 [0.45; 0.55]) and the 1-h OGTT value (rho = 0.50 [0.45; 0.55]).
Conclusions:
The reliability findings and reference values are relevant for studies that aim to investigate CGM-measured GV. One-hour OGTT and IGP values can be used as GV indices when CGM is unavailable.
Introduction
Daily glucose variability (GV) is thought to contribute to the development of diabetes-related complications irrespective of mean glycemia, 1 and, hence, is accepted as a valuable marker of glycemic control. 2 Continuous glucose monitoring (CGM) is the preferred method for measuring GV, as it is able to assess many of its aspects (i.e., amplitude, frequency, and duration of fluctuations), 2 whereas other measures (e.g., oral glucose tolerance test [OGTT], repeated self-measurement of blood glucose [SMBG]) only assess singular aspects. CGM is, however, a challenging technology to use in a large epidemiological setting, in part due to its costliness and relative invasiveness. 3
Despite prior efforts, several methodological aspects of GV measurement with CGM need further investigation. First, the required number of days to reliably measure daily GV is unclear for individuals with normal glucose metabolism (NGM), prediabetes, or type 2 diabetes. Second, there is currently little information on GV reference values, which are ideally determined in healthy individuals, that is, individuals with NGM. 4 Third, little is known about the relationship of GV with established glycemic indices, such as fasting plasma glucose (FPG), OGTT-derived indices, and HbA1c. Certain OGTT-derived indices may give a good approximation of GV and could thus be used as alternatives in an epidemiological setting when CGM is not available.
We, therefore, (1) investigated the minimum number of days needed to reliably measure GV with CGM; (2) assessed GV reference values according to glucose metabolism status (GMS); and (3) studied the correlation of CGM-measured GV with established glycemic indices, in a large population-based cohort.
Research Design and Methods
Study population and design
We used data from The Maastricht Study, an observational, prospective, population-based cohort study. The rationale and methodology have been described previously. 5 In brief, The Maastricht Study focuses on the etiology, pathophysiology, complications, and comorbidities of type 2 diabetes, and is characterized by an extensive phenotyping approach. All individuals between 40 and 75 years of age and living in the southern part of the Netherlands were eligible for participation. Participants were recruited through mass media campaigns and from the municipal registries and the regional Diabetes Patient Registry through mailings. For reasons of efficiency, recruitment was stratified according to known type 2 diabetes status, with an oversampling of individuals with type 2 diabetes. The Maastricht Study has been approved by the Institutional Medical Ethics Committee (NL31329.068.10) and the Minister of Health, Welfare, and Sports of the Netherlands (Permit 131088-105234-PG). All participants gave written informed consent.
Continuous glucose monitoring
From September 19, 2016 until September 13, 2018, all participants were invited to undergo CGM (iPro2 and Enlite Glucose Sensor; Medtronic, Tolochenaz, Switzerland) as a part of their standard measurements. To ensure inclusion of a sufficient number of participants with prediabetes and type 2 diabetes within a reasonable timeframe, we reinvited a prediabetes- and type 2 diabetes-enriched group of participants—who had visited The Maastricht Study between January 2015 until September 2016 for standard measurements—to undergo CGM as a separate research visit (further referred to as “catch-up visit”). The CGM device was worn on the lower abdomen and recorded subcutaneous interstitial glucose values (range: 40–400 mg/dL) every 5 min for a 7-day period. During this time, participants were asked to perform SMBG with the use of Contour Next (Ascensia Diabetes Care, Mijdrecht, the Netherlands) four times daily (i.e., before main meals and at bedtime). These SMBG values were used to retrospectively calibrate the CGM values at the moment of data upload to CareLink iPro (Medtronic). Accuracies (expressed as the mean absolute relative difference) of the iPro2 and Contour Next are 11.0% 6 and 3.1%–5.6%, 7 –9 respectively. Participants were blinded to the CGM recording, but not to SMBG values. Diabetes medication use was allowed and no dietary or physical activity instructions were given.
We used the Glycemic Variability Research Tool (GlyVaRT; Medtronic) software to process CGM data. First, the first 24 h of glucose values were removed, because of insufficient calibration. Next, we excluded individuals of whom less than 24 h of recording (less than one data day) remained. Then, we calculated mean sensor glucose (MSG), standard deviation (SD), and coefficient of variation (CV; SD/MSG × 100%) for each period of 24 h (data day) and for the total recording period. Based on international consensus, we used SD and CV as indices of GV. 2 We additionally included MSG in our analyses, as GV indices are preferably interpreted in the context of mean glucose values. 3 As described in the Supplementary Methods, we also calculated other commonly used GV indices with the use of GlyVaRT.
Oral glucose tolerance test
Participants underwent a standardized 2-h 75 gram OGTT after fasting overnight to determine GMS, which was defined according to the World Health Organization 2006 criteria as: (1) NGM, (2) impaired fasting glucose and impaired glucose tolerance (combined as prediabetes), or (3) type 2 diabetes. 10 For safety reasons, individuals using insulin or with a fasting glucose level above 198 mg/dL, as determined by a finger prick, did not undergo an OGTT. For these participants, we determined GMS based on FPG and information about their diabetes medication. During the OGTT, we took venous blood glucose samples at baseline ( = FPG) and at 15, 30, 45, 60, 90, and 120 min. In individuals with complete OGTT data, we calculated the incremental glucose peak (IGP) by subtracting FPG from the highest OGTT glucose value ( = maximum glucose peak).
Measurement of covariates
As described previously, 5 we assessed diabetes duration by questionnaire; assessed use of glucose-lowering medication as part of a medication interview; measured weight, height, and body mass index (BMI) during a physical examination; and measured HbA1c in fasting venous blood. Body weight and glucose-lowering medication use were reassessed in individuals who attended a CGM catch-up visit.
Statistical analysis
To determine the minimum number of CGM days required for a reliable assessment of MSG, SD, and CV, we calculated GMS-stratified reliability (R) with the use of the Spearman–Brown prophecy formula: R = σ B 2 /(σ B 2 + [σ W 2 /n]), where σ B is the interindividual variance, σ W is the intraindividual variance, and n is the number of consecutive monitoring days. 11,12 We used variance component analysis through ANOVA with the different CGM-derived indices as the dependent variable to estimate the participant variance component (interindividual; σ B) and the residual variance component (intraindividual; σ W). For these analyses we included only individuals with more than five complete data days of CGM to ensure optimal reliability. A R of >0.80 was considered reliable. 11
We calculated the distribution of MSG, SD, and CV values (10th–90th, 5th–95th, and 2.5th–97.5th percentile) in GMS-stratified groups. We established reference ranges based on the 2.5th–97.5th percentile of individuals with NGM. 4 As an additional analysis, we calculated the distributions for sex- and age-stratified GMS groups. In addition, MSG, SD, and CV differences between GMS groups were statistically compared with the use of ANOVA with post-hoc Bonferroni correction.
A Spearman's rank test was used to determine the correlation (rho) and 95% confidence interval of CGM-derived indices with FPG, OGTT-derived indices (i.e., 15-, 30-, 45-, 60-, 90-, and 120-min glucose values, maximum glucose peak, and IGP), and HbA1c. As an additional analysis, we used linear regression to calculate unadjusted regression coefficients and their corresponding 95% confidence intervals for the glycemic indices that correlated most strongly with MSG, SD, and CV.
Additionally, several sensitivity analyses were performed: (1) after exclusion of individuals with less than the reliable number of CGM days; (2) after exclusion of individuals who underwent CGM as part of a catch-up visit; and (3) after exclusion of the individuals with data gaps during CGM recording. In addition, the main analyses were also carried out for other commonly used GV indices (i.e., mean amplitude of glucose excursions [MAGE], interquartile range [IQR], and mean of daily differences [MODD]).
Normally distributed data are presented as mean and SD, non-normally distributed data as median and IQR, and categorical data as n (%). We considered a P value of <0.05 as statistically significant. All statistical analyses were performed with the Statistical Package for Social Sciences (version 25.0; IBM, Chicago, IL).
Results
Study population characteristics
The total CGM study population comprised 896 individuals, from which we excluded two participants with diabetes types other than type 2 diabetes. Next, due to the removal of the first 24 h of CGM data, we excluded 27 individuals with <24 h of CGM, as for them CGM-derived indices could not be calculated. Then, we excluded individuals (n = 16) who had less than one data day (24 h) of CGM remaining, which resulted in the final study population that consisted of 851 individuals (Supplementary Fig. S1).
Table 1 shows the GMS-stratified participant characteristics of the final study population, based on the regular study visit measurements. With deteriorating GMS, participants were older, more often male, had a higher BMI, and had higher HbA1c, FPG, and OGTT-derived index values. Individuals with type 2 diabetes were often newly diagnosed by OGTT. More than half of the participants with type 2 diabetes used metformin as their primary diabetes medication (n = 104, 53.1%); insulin use was uncommon (n = 19, 9.6%).
Participant Characteristics of the Total Study Population and of Glucose Metabolism Status-Stratified Groups
Data are reported as mean ± SD, median (IQR), or number (percentage [%]) as appropriate. Data represent the study population of participants with at least 48 h of CGM data.
BMI, body mass index; CGM, continuous glucose monitoring; FPG, fasting plasma glucose; GLP-1, glucagon-like peptide-1; HbA1c, glycated hemoglobin A1c; IGP, incremental glucose peak; IQR, interquartile range; NGM, normal glucose metabolism; OGTT, oral glucose tolerance test; PreD, prediabetes; SD, standard deviation; T2D, type 2 diabetes.
Most participants (n = 772, 90.7%) completed the 7-day recording period, which resulted in six data days of usable CGM data (Supplementary Table S1). A large number of individuals (n = 721, 84.7%) also had five or more consecutive, complete days of CGM. Several participants (n = 66, 7.8%) experienced at least one period during which no glucose values were recorded (i.e., a data gap), the length of which varied considerably (median: 5.3 h [IQR: 0.9–19.6]). SMBG adherence was high (i.e., median average daily calibration frequency: 4.0 [3.7–4.1], Supplementary Table S1).
Of the final study population (n = 851), 603 participants (70.9%) underwent CGM as part of their standard measurements (i.e., regular visits) and 248 participants (29.1%) during a catch-up visit. Supplementary Table S2 shows the participant characteristics stratified for research visit. Participant characteristics were generally comparable after stratification for GMS. The median time between the regular and catch-up visit was 2.1 [2.0–2.2] years (Supplementary Table S3). Only individuals with prediabetes had gained weight between their regular and catch-up visit (from 82.9 ± 15.6 to 84.1 ± 16.2 kg, P = 0.011); large differences in body weight (>10%) were rare (n = 12, 4.8%). Use of glucose-lowering medication was more frequent in individuals with type 2 diabetes at the catch-up visit (71.8% vs. 63.7% at the regular and catch-up visit, respectively, P = 0.035).
Reliability of continuous glucose monitoring
In the reliability analyses, individuals with more than five consecutive, complete days of CGM recording were included (n = 721, 84.7%) (Supplementary Tables S1 and S4). Figure 1 illustrates the reliability for different CGM-derived indices per number of consecutive monitoring days in individuals with NGM, prediabetes, or type 2 diabetes. In case of MSG (Fig. 1; panel A) and SD (Fig. 1; panel B), the reliability was sufficient (R > 0.80) after 1 day of recording for individuals with prediabetes and type 2 diabetes, and after 2 days for individuals with NGM. In case of CV (Fig. 1; panel C), the reliability was sufficient after 2 days of recording for individuals with NGM and type 2 diabetes, and after 3 days for individuals with prediabetes.
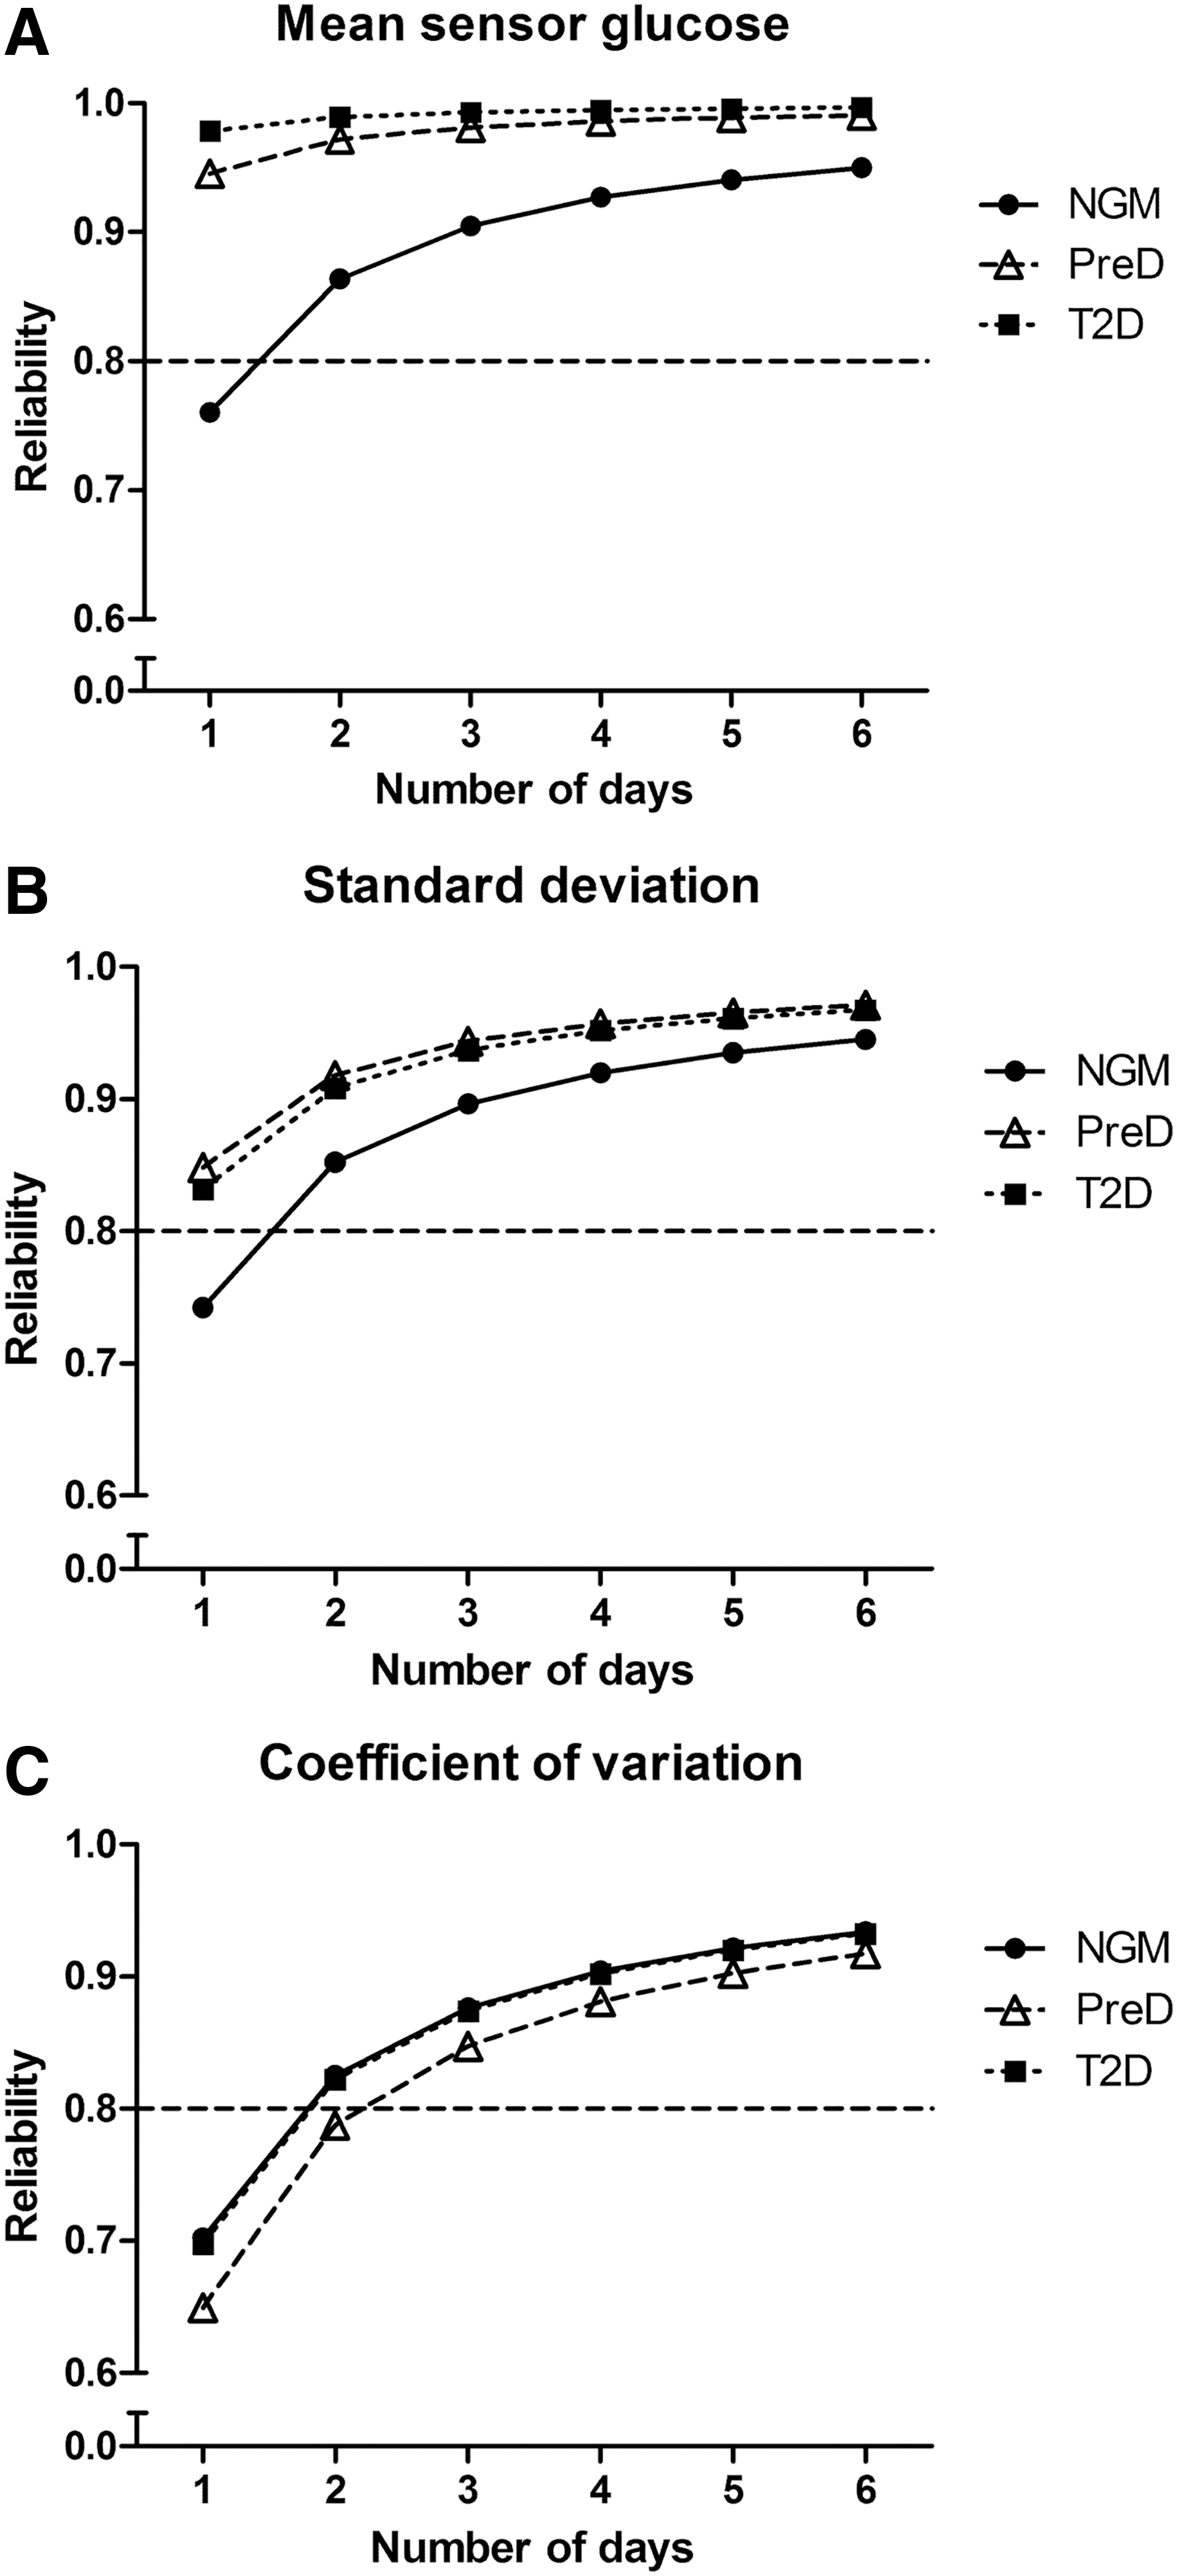
Reliability for MSG
GV according to glucose metabolism status
Table 2 shows the GMS-stratified median, mean, and various percentile values for MSG, SD, and CV. Deteriorating GMS was associated with statistically significantly higher MSG, SD, and CV values (even after Bonferroni correction). The distributions (10th–90th, 5th–95th, 2.5th–97.5th percentiles) of MSG, SD, and CV were broader as GMS deteriorated. The reference values for MSG, SD, and CV, based on the 2.5th–97.5th percentiles of individuals with NGM, were 90.5–120.6 mg/dL (5.03–6.69 mM), 7.9–24.8 mg/dL (0.44–1.37 mM), and 7.74%–22.45%, respectively. Distributions of MSG, SD, and CV were not materially different for age- and sex-stratified GMS groups (Supplementary Table S5).
Distribution of Mean Sensor Glucose, Standard Deviation and Coefficient of Variation in Glucose Metabolism Status-Stratified Groups
P < 0.001 versus NGM.
P < 0.001 versus PreD.
CV, coefficient of variation; MSG, mean sensor glucose.
Correlations with established glycemic indices
Figure 2 and Supplementary Table S6 depict the Spearman correlation coefficients of MSG, SD, and CV with FPG, OGTT-derived indices, and HbA1c. Since a complete seven-point OGTT was not available in all individuals, the number of individuals included in these correlation analyses varied from 744 to 851 (Supplementary Table S6). Correlations with MSG and SD were generally stronger than those with CV. For MSG, the strongest correlation was found with FPG (rho = 0.65 [0.61; 0.69]), followed by HbA1c (rho = 0.63 [0.58; 0.67]) and maximum glucose peak (rho = 0.63 [0.59; 0.67]). For both SD and CV, a similar pattern was observed regarding the OGTT time points: the strongest correlations were found with the 1-h OGTT value and correlations were gradually weaker for the time points that were more distant from this OGTT value. For SD, we found the highest correlation coefficient with the 1-h OGTT value (rho = 0.61 [0.56; 0.65]); for CV, with both IGP (rho = 0.50 [0.45; 0.55]) and the 1-h OGTT value (rho = 0.50 [0.45; 0.55]). Of note, the 1-h OGTT value did not necessarily represent the glucose peak time point during the OGTT. In fact, with deteriorating GMS, the peak time point appeared to shift to a later moment during the OGTT (Supplementary Table S7).
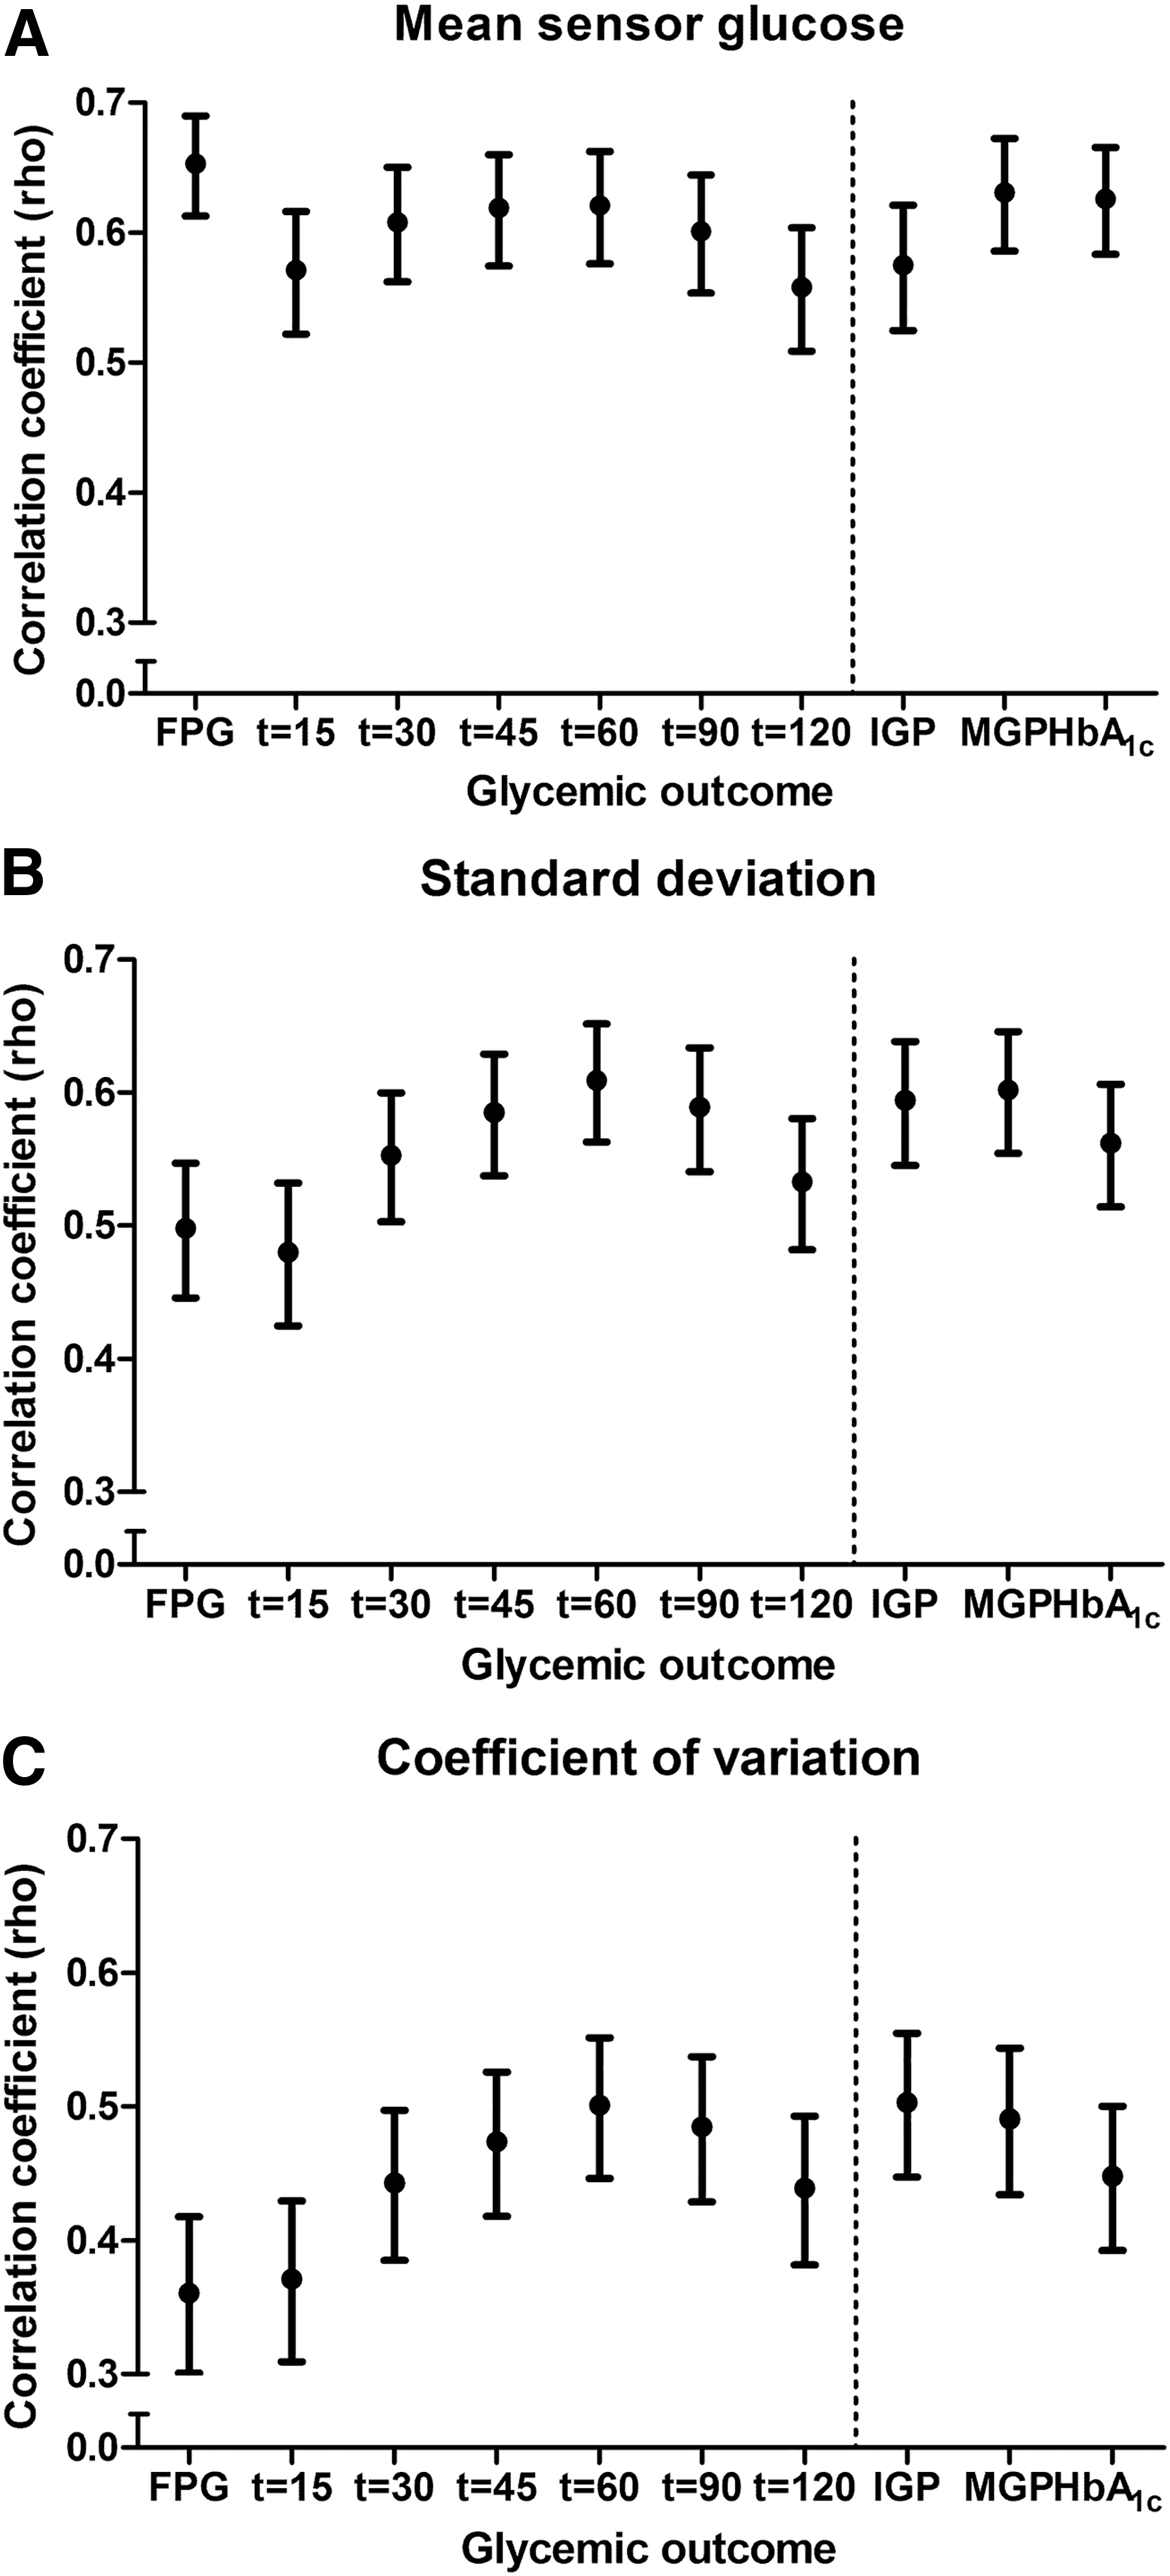
Correlations of MSG
Supplementary Table S8 shows GMS-stratified Spearman correlation coefficients. We found that MSG correlated best with FPG in individuals with NGM (rho = 0.37 [0.29; 0.44]), and with HbA1c in individuals with prediabetes (rho = 0.46 [0.34; 0.57]) and type 2 diabetes (rho = 0.60 [0.50; 0.68]). SD correlated best with IGP (rho = 0.31 [0.22; 0.39]) and maximum glucose peak (rho = 0.30 [0.22; 0.39]) in individuals with NGM, with the 90-min OGTT value (rho = 0.30 [0.16; 0.43]) and HbA1c (rho = 0.30 [0.17; 0.43]) in individuals with prediabetes, and with the 90-min OGTT (rho = 0.54 [0.42; 0.65]) value, IGP (rho = 0.54 [0.42; 0.65]) and maximum glucose peak (rho = 0.54 [0.41; 0.64]) in individuals with type 2 diabetes. We observed that CV correlated best with IGP in individuals with NGM (rho = 0.25 [0.16; 0.34]), with the 90-min (rho = 0.23 [0.09; 0.37]) and 2-h (rho = 0.24 [0.09; 0.37]) OGTT value in individuals with prediabetes, and with IGP (rho = 0.49 [0.35; 0.60]) in individuals with type 2 diabetes.
Supplementary Table S9 displays the regression coefficients of the five glycemic indices that correlated most strongly with MSG, SD, and CV in the total study population. In addition, it shows GMS-stratified regression coefficients of the three glycemic indices that correlated best with MSG, SD, and CV in individuals with NGM, prediabetes, and type 2 diabetes.
Additional analyses
The reliability for MSG, SD, and CV was not materially different after exclusion of participants who returned for the catch-up visit (Supplementary Fig. S2). After exclusion of individuals with less than the reliable amount of recording days, exclusion of individuals who returned for the catch-up visit or exclusion of individuals with recording data gaps, all CGM-derived indices (MSG, SD, and CV) still differed statistically significantly between individuals with NGM, prediabetes, or type 2 diabetes (Supplementary Tables S10–S12). The distributions of MSG, SD, and CV were generally comparable after exclusion of individuals with less than the reliable amount of recording days, exclusion of individuals who returned for the catch-up visit or exclusion of individuals with recording data gaps (Supplementary Tables S10–S12).
No substantially different Spearman correlation coefficients were obtained after exclusion of individuals with less than the reliable number of recording days (Supplementary Fig. S3) or with recording data gaps (Supplementary Fig. S4). Although exclusion of individuals who returned for a catch-up visit resulted in lower correlation coefficients (0.1–0.2 on average), it did not affect the original correlation patterns that were observed for the correlations of MSG, SD, and CV with FPG, OGTT-derived indices, and HbA1c (Supplementary Fig. S5). Last, the reliability, reference value, and correlation results of MAGE, IQR, and MODD are shown in the Supplemental materials (Supplementary Figs. S6 and S7; Supplementary Table S13).
Discussion
We investigated—in individuals with NGM, prediabetes, or type 2 diabetes—the minimum number of days needed to reliably measure CGM-derived indices, assessed their reference values, and studied their relationship with several established glycemic indices. Our study has three main findings. First, a reliable assessment of MSG, SD, and CV can be made with two to three recording days. Second, MSG, SD, and CV reference values were obtained based on individuals with NGM. Third, GV indices correlated most strongly with the 1-h OGTT value, IGP, and maximum glucose peak.
In our study population, the common 7-day recording period—with six functional CGM days—yielded high reliability, especially for MSG. In addition, a reliable assessment (R > 0.80) of CGM-derived indices could be made with relatively few days: 2 days of monitoring in case of MSG and SD, 3 days in case of CV. Our conclusion contrasts with the sampling duration findings of comparable studies (i.e., 12–15 days are minimally required). 13 –15 However, comparison is complicated by the fact that all prior research was performed in individuals with type 1 diabetes. Since this group is characterized by larger day-to-day differences in their glycemic profiles (i.e., higher intraindividual variance), 16 a longer sampling duration is presumably required to achieve sufficient reliability. The differences in statistical methods (i.e., correlation, percentage difference analyses) and cutoff values (i.e., r 2 > 0.70–0.86; overall difference <10%) used, further hamper comparison.
In line with several other studies, we found that MSG and SD values were statistically significantly higher with deteriorating GMS 17 –20 ; more interestingly, we observed statistically significantly higher CV values as well. Since CV quantifies GV adjusted for MSG, it can be concluded that GV is higher in individuals with type 2 diabetes as compared with prediabetes and NGM, regardless of the mean glucose value. The MSG, SD, and CV values observed in the present study were generally lower than previously reported. 17 –19 In contrast to the current study, some of these studies did not observe statistically significant differences between individuals with NGM and prediabetes, 17,19 which could be attributed to their relatively small sample sizes (n = 50–162).
We established reference values for MSG, SD, and CV based on the 2.5th–97.5th percentiles of individuals with NGM, which is preferred when reporting reference intervals. 4 While Bode et al. first aimed to establish normative values in individuals with type 2 diabetes, 16 Zhou et al. were the first to report the distribution (5th–95th percentile) of MSG (84.5–118.9 mg/dL) and SD (6.3–25.2 mg/dL) in individuals with NGM. 21,22 These values were, however, not determined under normal living conditions, as the participants were given dietary instructions as part of the study design. This could explain the lower 5th percentile values for both indices. Gude et al. also reported on SD (5th–95th percentile) in a population-based cohort of Caucasian individuals with and without type 2 diabetes (13.0–87.0 mg/dL and 9.0–24.0 mg/dL, respectively). 23 Although they did not specifically report reference ranges for NGM, their distributions were generally comparable to ours, except for the substantially higher 95th percentile they observed in individuals with type 2 diabetes, who had a higher mean HbA1c (54.0 ± 10.8 mmol/mol) and more frequently used oral glucose-lowering drugs (86%) and insulin (21%).
Of all glycemic indices, MSG correlated best, although moderately, with FPG, maximum glucose peak, and HbA1c. Zhou et al. previously reported similar correlations coefficients for MSG with FPG and HbA1c. 24 We additionally found that, of all glycemic indices, the strongest correlations of SD and CV were observed with the 1-h OGTT value, maximum glucose peak, and IGP. The GMS-stratified correlation coefficients were generally lower than those for the total study population, which can be attributed to the effect of range restriction (i.e., the smaller ranges in the subgroups attenuate the correlation coefficients). 25 Interestingly, not only SD, but also CV correlated quite moderately with indices of mean glycemia (i.e., FPG, HbA1c). This may explain the difficulty of establishing effects of specific GV improvements while maintaining similar HbA1c, FPG, or MSG concentrations. 26
The correlations found with SD and CV legitimate the use of the 1-h or peak glucose value during an OGTT to approximate GV if CGM is unavailable (e.g., in a large observational study 27 ). This sheds an interesting light on prior research that found that the 1-h OGTT value was associated with cardiovascular disease and mortality. 28 Nevertheless, we observed that the strength of the correlation with GV indices was determined by the time point of the OGTT peak. The 1-h OGTT value was often not reflective of the glucose peak, especially in individuals with NGM (15.3%) and T2D (20.3%) (Supplementary Tables S7 and S8). Accordingly, if the total study population and GMS-stratified groups are taken together, IGP generally correlated most strongly with SD and CV. This suggests that IGP, rather than the 1-h OGTT value, is the preferred OGTT-derived index to use as GV proxy.
Our findings have important implications for the study of GV. First, the CGM period may be shortened to three functional days of recording for individuals with NGM, prediabetes, or type 2 diabetes to alleviate participant burden without compromising reliability of GV assessment. Importantly, a longer recording period may be required in individuals with type 2 diabetes who are treated with multiple daily insulin injections (not highly represented in this study). In addition, a reliable assessment of other CGM-derived indices (e.g., time in range) could require more recording days. Second, our reference ranges can be used to classify individuals as having normal or abnormal MSG, SD, or CV values. However, these reference values need not necessarily represent target values, as is the case for HbA1c. 29 Third, IGP should be viewed as the preferred OGTT-derived index to assess GV, since it correlated most strongly with SD and CV for both the total study population and the GMS-stratified groups. Last, the regression coefficients found could be used to approximate CGM-derived indices based on several established glycemic indices (Supplementary Table S9).
This study has several strengths and limitations. Strengths are (1) the large, population-based study sample; (2) the high overall SMBG adherence, ensuring adequate CGM calibration; (3) the OGTT-based assessment of GMS, allowing the calculation of reference values; (4) the availability of a seven-point OGTT, enabling comparison with multiple time points; and (5) the robustness of the results, as reflected by the consistency of multiple sensitivity analyses. Our study had certain limitations. First, the reliability analyses would ideally have been based on a longer recording period than six functional days, as this could have improved the assessment of intraindividual variation. We were, however, limited by our study design, which aimed to prevent excessive participant strain and was restricted by sensor lifespan. 6 Second, we focused mainly on SD and CV as indices of GV, while others exist (e.g., IQR, MAGE). With the use of MSG, SD, and CV, we assume a normal distribution of CGM-derived glucose values, which is not necessarily true. Nevertheless, SD was shown to have a smaller random sampling error than other GV indices, is widely used and easily interpretable, and can be adapted to the preferred MSG-adjusted GV index (i.e., CV). 2,3 Additionally, the different CGM-derived GV indices have been found to be strongly correlated. 3 Accordingly, the MAGE, IQR, and MODD findings were generally comparable to the SD and CV results (Supplementary Figs. S6 and S7; Supplementary Table S13). Third, the strength of the correlation coefficients of our total study population could have been underestimated due to the inclusion of individuals who returned for a catch-up visit, as there was a median time of 2.1 years between CGM and the measurement of the OGTT and HbA1c values. While the correlations were investigated in only newly recruited individuals (Supplementary Fig. S5), their interpretation is hampered by range restriction (i.e., lower number of individuals with prediabetes and type 2 diabetes in the regular visit when compared with the catch-up visit). 25 Fourth, the fact that the individuals with type 2 diabetes were relatively well controlled (i.e., mean HbA1c: 49.2 ± 10.8 mmol/mol) and uncommonly used insulin (n = 19, 9.6%), may also have influenced our findings. Namely, a wider range of glycemic control could have altered the reliability of CGM-derived indices in individuals with type 2 diabetes by affecting the inter- and intraindividual variance ratio. Additionally, percentile distributions of the CGM-derived indices are inherently determined by the glycemic status of the included individuals. The generalizability of our results is additionally affected by the age-restricted and predominately Caucasian study population, and by the absence of individuals with type 1 diabetes.
In conclusion, we showed that a reliable assessment of CGM-derived indices can be made with two to three recording days. In addition, we established the reference ranges for MSG, SD, and CV as 90.5–120.6 mg/dL (5.03–6.69 mM), 7.9–24.8 mg/dL (0.44–1.37 mM), and 7.74%–22.45%, respectively. We additionally found that the 1-h OGTT value, IGP, and maximum glucose peak correlated moderately with GV indices. These findings are relevant for future studies that aim to use CGM to measure GV, or current studies that only have OGTT-derived indices at their disposal to assess GV.
Data Availability
Data are available from The Maastricht Study for any researcher who meets the criteria for access to confidential data; the corresponding author may be contacted to request data.
Author Contributions
Y.D.F. and M.C.G.J.B. contributed to conception and design, participated in acquisition of data, analyzed and interpreted data, drafted the article, revised the article critically for important intellectual content, and provided final approval of the version to be published. C.J.H.vdK., N.C.S., and C.D.A.S. contributed to conception and design, contributed to analyses and interpretation of data, revised the article critically for important intellectual content, and provided final approval of the version to be published. D.M.E.P. participated in acquisition of data and revised the article critically for important intellectual content, and provided final approval of the version to be published.
Footnotes
Author Disclosure Statement
No competing financial interests exist.
Funding Information
The Maastricht Study was supported by the European Regional Development Fund via OP-Zuid, the Province of Limburg, the Dutch Ministry of Economic Affairs (grant 31O.041), Stichting De Weijerhorst (Maastricht, the Netherlands), the Pearl String Initiative Diabetes (Amsterdam, the Netherlands), School for Cardiovascular Diseases (CARIM, Maastricht, the Netherlands), Care and Public Health Research Institute (CAPHRI, Maastricht, the Netherlands), School for Nutrition and Translational Research in Metabolism (NUTRIM, Maastricht, the Netherlands), Stichting Annadal (Maastricht, the Netherlands), Health Foundation Limburg (Maastricht, the Netherlands), and by unrestricted grants from Janssen-Cilag B.V. (Tilburg, the Netherlands), Novo Nordisk Farma B.V. (Alphen aan den Rijn, the Netherlands), Sanofi-Aventis Netherlands B.V. (Gouda, the Netherlands), and Medtronic (Tolochenaz, Switzerland).
Supplementary Material
Supplementary Data
Supplementary Figure S1
Supplementary Figure S2
Supplementary Figure S3
Supplementary Figure S4
Supplementary Figure S5
Supplementary Figure S6
Supplementary Figure S7
Supplementary Table S1
Supplementary Table S2
Supplementary Table S3
Supplementary Table S4
Supplementary Table S5
Supplementary Table S6
Supplementary Table S7
Supplementary Table S8
Supplementary Table S9
Supplementary Table S10
Supplementary Table S11
Supplementary Table S12
Supplementary Table S13
References
Supplementary Material
Please find the following supplemental material available below.
For Open Access articles published under a Creative Commons License, all supplemental material carries the same license as the article it is associated with.
For non-Open Access articles published, all supplemental material carries a non-exclusive license, and permission requests for re-use of supplemental material or any part of supplemental material shall be sent directly to the copyright owner as specified in the copyright notice associated with the article.