
Abstract
This article goes through the major components of the health care return-on-investment equation, from spending to outcomes, and attempts to identify major causes for its underperformance compared with other types of enterprise. It also explores the role of “middlemen” in prescription drug pricing (broadly defined as any market participant other than the drug manufacturer and the provider/patient, including—but not limited to—insurance companies, pharmacy benefit managers [PBMs], and health plans) and teases out the mechanisms by which PBMs, in particular, contribute to overall health care costs and the types of risks and returns they endure. Like any economic system, the health care system is a net zero-sum construct, whereby costs and benefits are traded off or exchanged between components of the value chain involuntarily (e.g., by regulatory or legal mandate) or voluntarily (e.g., by economic incentive). Ultimately, the question for policymakers as it relates to health care reform is to determine what combination of such exchanges leads to the best overall outcomes. This question of optimization, however, is undoubtedly challenging and complex, and can bring to bear economic, social, political, and moral dimensions. In light of these considerations, the article concludes by touching upon some perspectives for the future and ideas for reform, including payer reform, delivery disintermediation by technology, and consumer-driven health care.
Macro and Micro View of U.S. Health Care Economic Burden
Health care represents a significant proportion of the national economy—total health care spending amounts to ∼$4 trillion per year, which represents ∼20% of the nation's overall economic output, as represented by U.S. gross domestic product (GDP) of ∼$21.5T (3Q’19). 1 Spending related to diabetes alone amounts to ∼$300B per year, 2 or roughly 8% of overall health care spending, and is one of the top classes of disease from an economic burden perspective. Globally, expenditure related to diabetes and its attendant complications amounts to $800B per year. 3 In addition to the overall magnitude, all of these cited spending metrics are growing at rates that exceed benchmark consumer and producer inflation indices, in some cases by >60% (see Fig. 1). 4
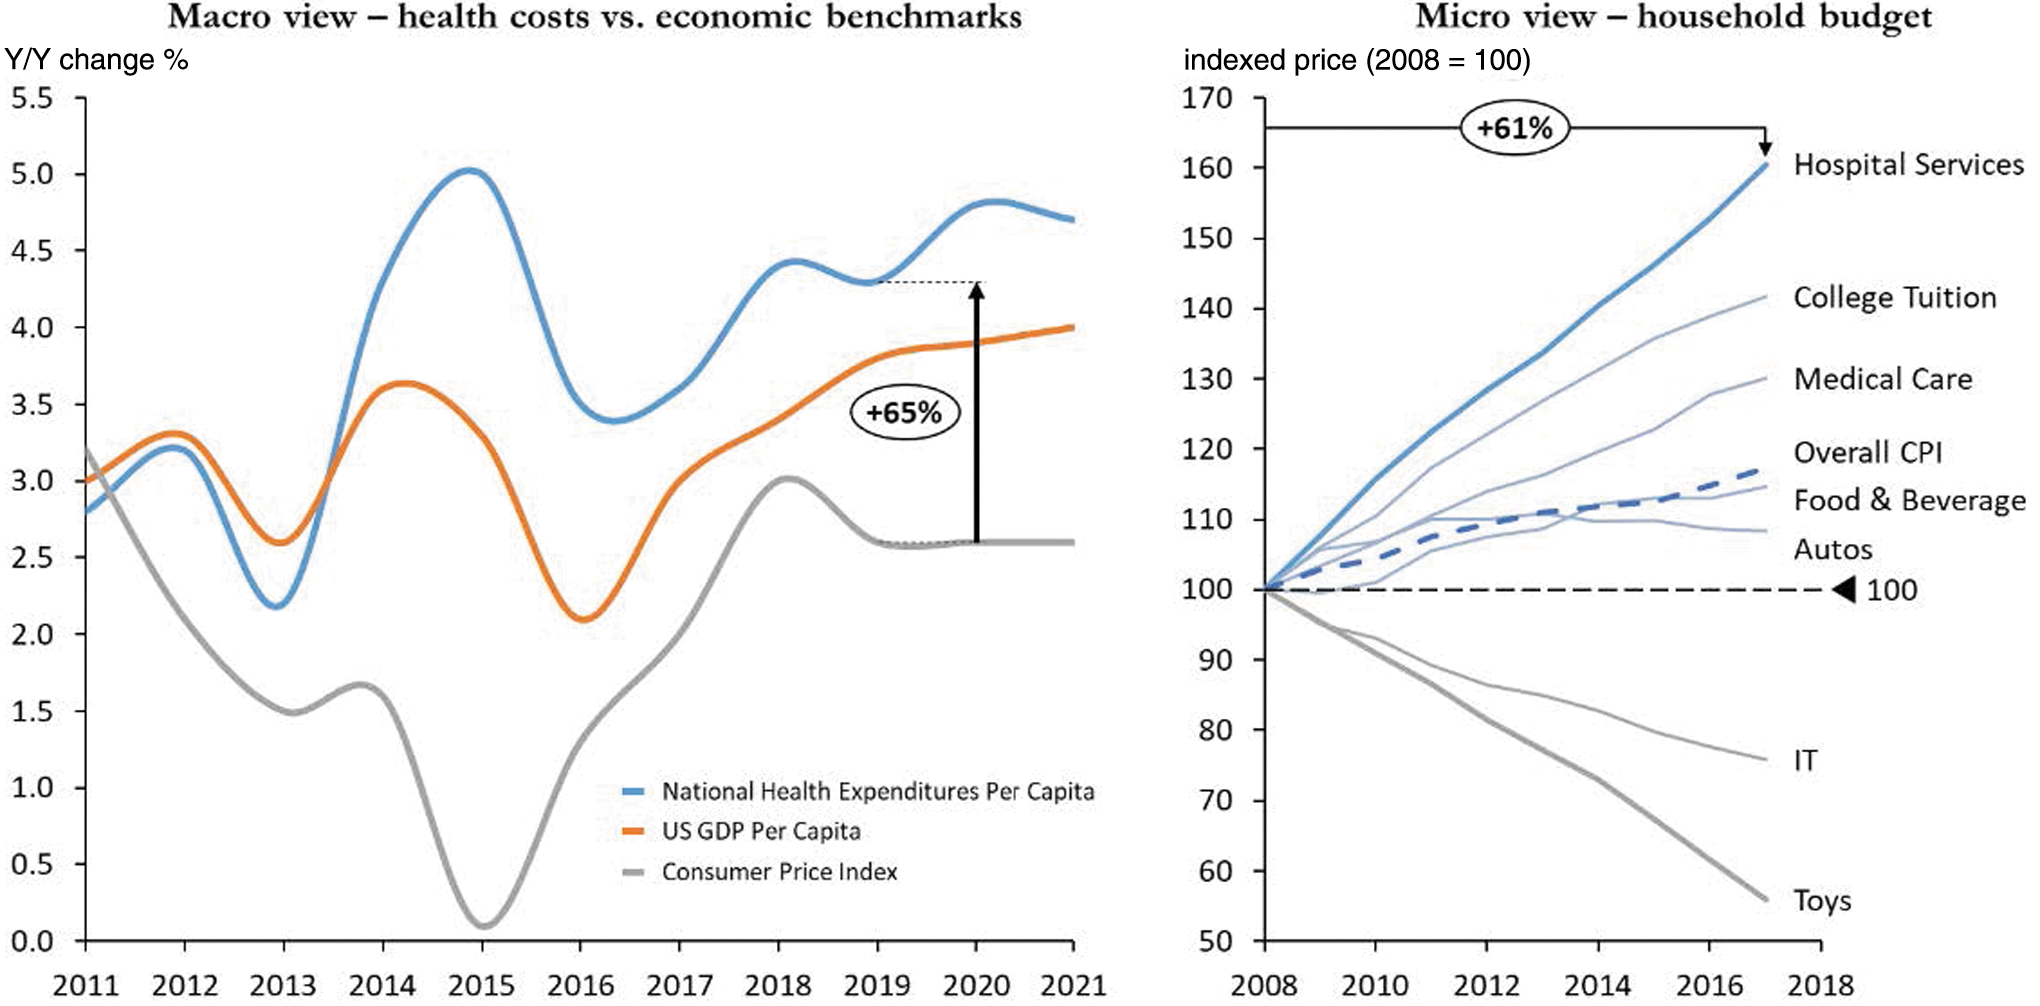
Macro and micro view of U.S. health care economic burden. Data on the left measured as Y/Y percentage change; data on the right measured as indexed price (2008 = 100). Source: Bureau of Economic Analysis, CMS (National Health Expenditure Data); Bureau of Labor Statistics (CPI, U.S. City Average).
Narrowing our perspective from the economy's commanding heights to the household level, health care is also the largest portion of the average American household budget. Utilizing data from the Bureau of Labor Statistics (BLS), the cost of hospital services has grown 61% in the past 10 years, far outpacing other common household items such as college tuition, food, IT, and toys. 5 The broader economic principle illustrated here is that goods with government involvement have tended to become more expensive, whereas those left simply to market supply/demand forces have become cheaper over time. Clearly, health care falls into the former category and can hardly be labeled a “free market” in its unencumbered form (see Fig. 1).
Comparing U.S. health care expenditure as a percentage of GDP versus the rest of the developed world as represented by the Organization for Economic Cooperation & Development (OECD) index for the past 47 years, the gap has grown to a point where the expenditure in the United States is nearly double that of the global average. 6 The dynamics of growth in expenditure can also be traced to how the country allocates resources in the system: data from the National Center for Health Statistics and the Census Bureau track growth in types of health care occupations. Most revealing is that for the past four decades, medical providers have grown by approximately two times while other health care infrastructure has grown 30 times. 7 The growth in size and complexity of health care systems helps explain this dichotomy in resource allocation and is an important factor in assessing cost inflation.
Drivers of Health Care Spending
Given the profile and trajectory of health care spending, what are the key drivers for health care expenditure? We assembled a research study team in 2016 out of the UCLA Anderson School of Management to look at this question for a top five player in the health care insurance industry. As a graduate consulting engagement formally funded by Anderson, we reviewed >50 potential explanatory variables for the past 20 years covering the medical domain, demographic/economic domain, and a number of inflation-specific measures to statistically test for significance.
We subsequently developed a simulated predictive model for health care expenditure using historical data, and the number one driver of health care costs was measured to be prescription drug costs, with a ∼0.70 R 2 correlation to growth in health care expenditure and P-value <0.005. Other variables in the analysis exhibited similarly strong R 2 correlations, especially the prior year's health care spending level (0.62), various consumer price index (CPI) subindices related to medical care (∼0.50) and hospital utilization (0.48), but these would have to be tested further to establish statistical significance within the construct of the model. 8
Many of these high correlations help underscore the resource allocation point mentioned earlier in addition to the prevalence of “waste” in the system. Indeed, a growing body of evidence also suggests that the health care system has a disproportionate amount of waste relative to total output compared with other economic systems, like manufacturing or services. Recent studies estimate that waste (including failure of care delivery, lack of care coordination, pricing failure, fraud, billing complexity, and so on) accounts for ∼25% of total health care expenditure. 9
The relative significance of prescription drug spending in this analysis underscores the need to understand the drug delivery chain and the mechanisms by which prescription drugs in the United States are sourced and priced. This topic will be covered in further detail shortly.
Outcomes, Health Care Return on Investment, and the Public View
Health care in the United States has exhibited a mixed performance record. Although one can readily attribute some of the leading advancements in science and technology to U.S. institutions (e.g., the United States leads all countries by a significant margin in Nobel Prize laureates since the award's inception in 1901 10 ), the overall health profile of the population has trailed expectations and global benchmarks. Identifying a reliable/unique measure of health care outcomes is a controversial exercise, but a recent publication in Lancet devised a “human capital” measure that accounts for expected years lived adjusted for health status. Over the space of 26 years (1990–2016), the United States had the worst decline in this index ranking versus other similarly large countries, declining by 21 spots. 11 Apart from the human capital index, we can also benchmark the United States against other developed countries along the lines of more specific medical and health performance measures. Assessing the data across 13 selected metrics, the United States trails in eight categories (∼60% of the total), and predominantly in areas related to overall health and preventative care (see Table 1). 12
Source: Dalio R, Economic & Investment Studies, Principles (2019)
The confluence of high spending and mixed outcomes has led to waning public support and higher lobbying by the medical industry. If we look at U.S. voter trust by public institution tracked by Gallop, comparing what it was in 1973 with what it is today, the medical system overall has experienced the most severe deterioration by 44% points—worse than the news, church, Congress, and big business. 13 Lobbying tends to go up when industries are easy targets based on deteriorating public trust: from the Center for Responsive Politics, the health care industry spent approximately a half billion dollars in 2018, led by the pharmaceutical industry at ∼$200M alone. 14
An underperforming health care return on investment (ROI) has also manifested in strong public views on health care costs and reform, ensuring this topic retains its top perch among national priorities. A recent meta-analysis of various nationwide public polls revealed some important takeaways regarding the health care cost debate, many of which highlight contradictions in desires (and hence the complexity underlying viable reform).
15
Several central takeaways are synthesized hereunder: Reducing the country's health care costs is a top national priority—this is led by 92% of respondents believing lower prescription drug prices should be a health priority for lawmakers. Most people blame hospitals, drug companies, and insurers for high health care costs (the “supply”), as opposed to overutilization (the “demand”)—although 60% of respondents blame high prices, only 23% say Americans are getting more health care and drugs than they need. Most people believe in prevention and the role of government to bend the cost curve—84% of respondents favor greater effort to prevent disease and live healthier, 67% want the government to make it easier for hospitals to compete on price/quality (but 65% also want the government to establish limits on what providers can charge). Most people want greater price transparency and competition to reduce drug prices—81% support allowing pharmacies to disclose price comparisons, 66% want the FDA to approve more generic, over-the-counter, and biosimilar drugs, and 63% want to require TV drug advertisements to include price information.
Diabetes Market
The incidence and prevalence of diabetes continues to grow and shows no sign of abatement both globally and in the United States. Globally for both men and women, prevalence has doubled since 1980 16 and the same observation can be made for U.S. adult diabetes prevalence since 1995, more than doubling from 4.4% to 9.5% of the population as reported by the CDC. 17 Correspondingly, the market for diabetes drugs and devices totals ∼$50B globally and is forecasted to grow between 3% and 4% annually over the next 5–8 years. Although insulin remains the industry's largest revenue contributor, GLP-1 agonists, SGLT-2 inhibitors, and Continuous Glucose Monitoring (CGM) technology are the leading growth drivers. 18
In the context of overall health care spending, the estimated total global public and private expenditure to treat diabetes is $700–800B per annum. In the United States, the figure is ∼$300B per annum, or ∼8%–10% of total health care expenditure. 19 Although the drivers of type 1 diabetes expenditure are multifaceted, when measuring annual dollars spent per person by treatment modality and its change between 2012 and 2016, insulin costs have grown at 19% compound annual growth rate, leading the next group of categories (e.g., noninsulin therapies, professional, outpatient, and inpatient) by almost double (see Fig. 2). 20 Indeed, insulin costs remain a singular point of tremendous focus in the diabetes cost landscape: consider that insulin prices increased 320% over the past 13 years 21 and that 1 in 4 patients reporting skipping insulin use due to cost from a recent single-center survey. 22 The heightened sensitivity and focus on insulin costs (among other types of drug costs) have led pharmaceutical companies to introduce generic versions, price caps, and pricing disclosures in consumer advertising, with mixed results. At the end of the day, the decoupling of the consumption of drugs versus its payment through insurance (for those with such coverage) mitigates the impact of pricing transparency on consumption decisions, among other factors. 23

Cost of key modalities to treat type 1 diabetes in the United States. Source: Health Care Cost Institute (HCCI), Insulin Use & Spending Trends Brief, January 2019.
Prescription Drug Delivery and Role of “Middlemen”
The supply chain for prescription drugs in the United States is a microcosm of the complexities of health care delivery. Although a “traditional” delivery chain for a “traditional” product or service begins with a manufacturer, then goes through an intermediary to facilitate distribution (if needed) and culminates with the end customer for payment, the model works differently for prescription drugs since the “paying” and “consuming” components are decoupled. Insurance companies and pharmacy benefit managers (PBMs) are the central components of the former function, helping to tie supply with demand as market makers. Since these agents are not intrinsically related to either drug production (i.e., biopharmaceutical companies) or consumption (i.e., providers/patients), this article refers to intermediaries such as “middlemen” (see the schematic in Fig. 3).
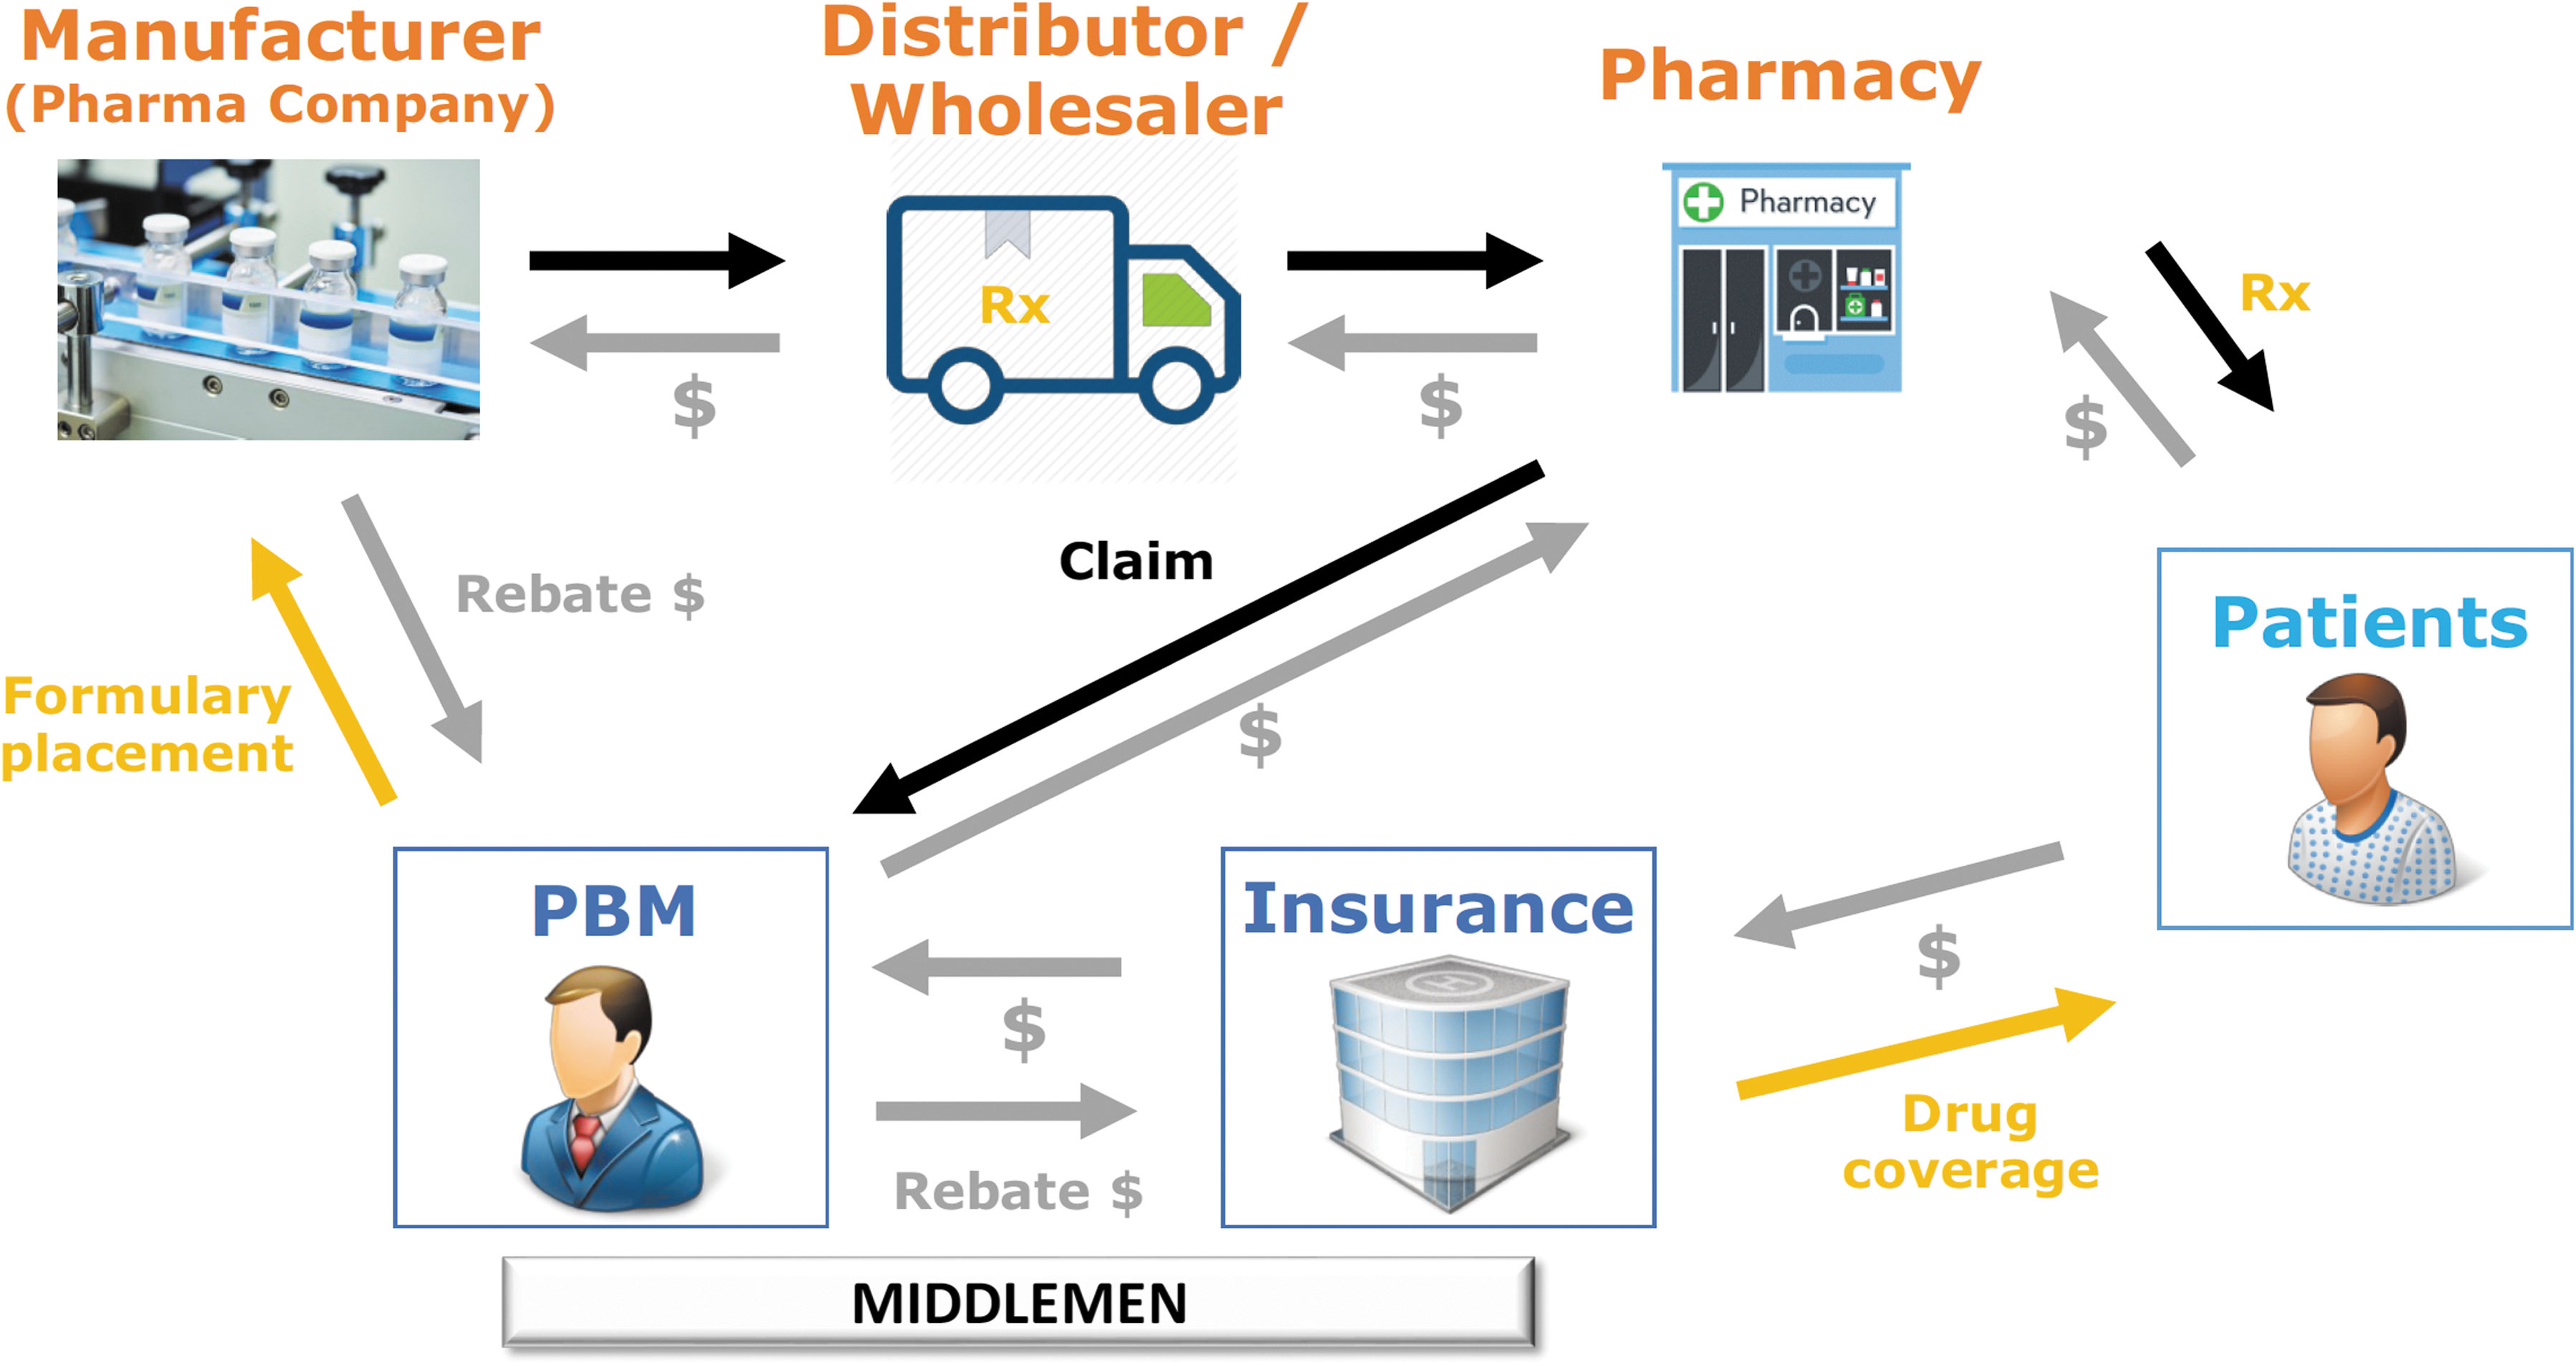
Prescription drug supply chain. Adapted from Wall St. Journal (June 2, 2019).
Insurance companies receive premiums from patients in return for providing insurance coverage. PBMs enable drugs to qualify for various health plans through a formulary system, essentially a list of covered drugs sorted by affordability from the patient's perspective (lowest to highest copay). To get on a higher peg of the formulary list, manufacturers pay rebate moneys to the PBM, who subsequently exchanges this for fees from the insurance company. All things being equal, higher prices lead to higher profitability for these agents, pharmaceutical companies, and providers, whereas lower prices are naturally more beneficial for patients. The greater the market power (i.e., ability to control supply, market share, and distribution channels) of a given agent, the higher price the agent can charge, extracting more benefit at the expense of the next-level agent in the system (the corollary is also true, where greater competition generally leads to lower end prices). As with any economic system, the drug delivery chain is a closed loop that follows these principles: the growth in market power of intermediaries has led to higher end prices at the expense of patients.
A good example is a walk-through of the pharmacy list price for Humalog, as reported by Eli Lilly in March 2019 (see Fig. 4). Starting at the pharmaceutical manufacturer net price of $135/vial, PBMs and insurance companies collectively add $407/vial to the pharmacy counter price. 24 Whether this increase is warranted to repatriate these agents for providing their services and coverage is a matter of continuing public debate and a change from the originally envisioned role of PBMs to aggregate demand from health plans as negotiating leverage with drug manufacturers, to ultimately get the best deal for patients. 25 Consolidation in the PBM industry, to the point where three players enjoy ∼70% market share, has built barriers to entry for new competition and led to higher profits. 26 What remains questionable is whether these excess profits (i.e., savings) are returned to shareholders or passed along to patients. Theory and evidence suggest the former and alternative models to reposition the so-called rebate economy are gaining visibility and traction. 27
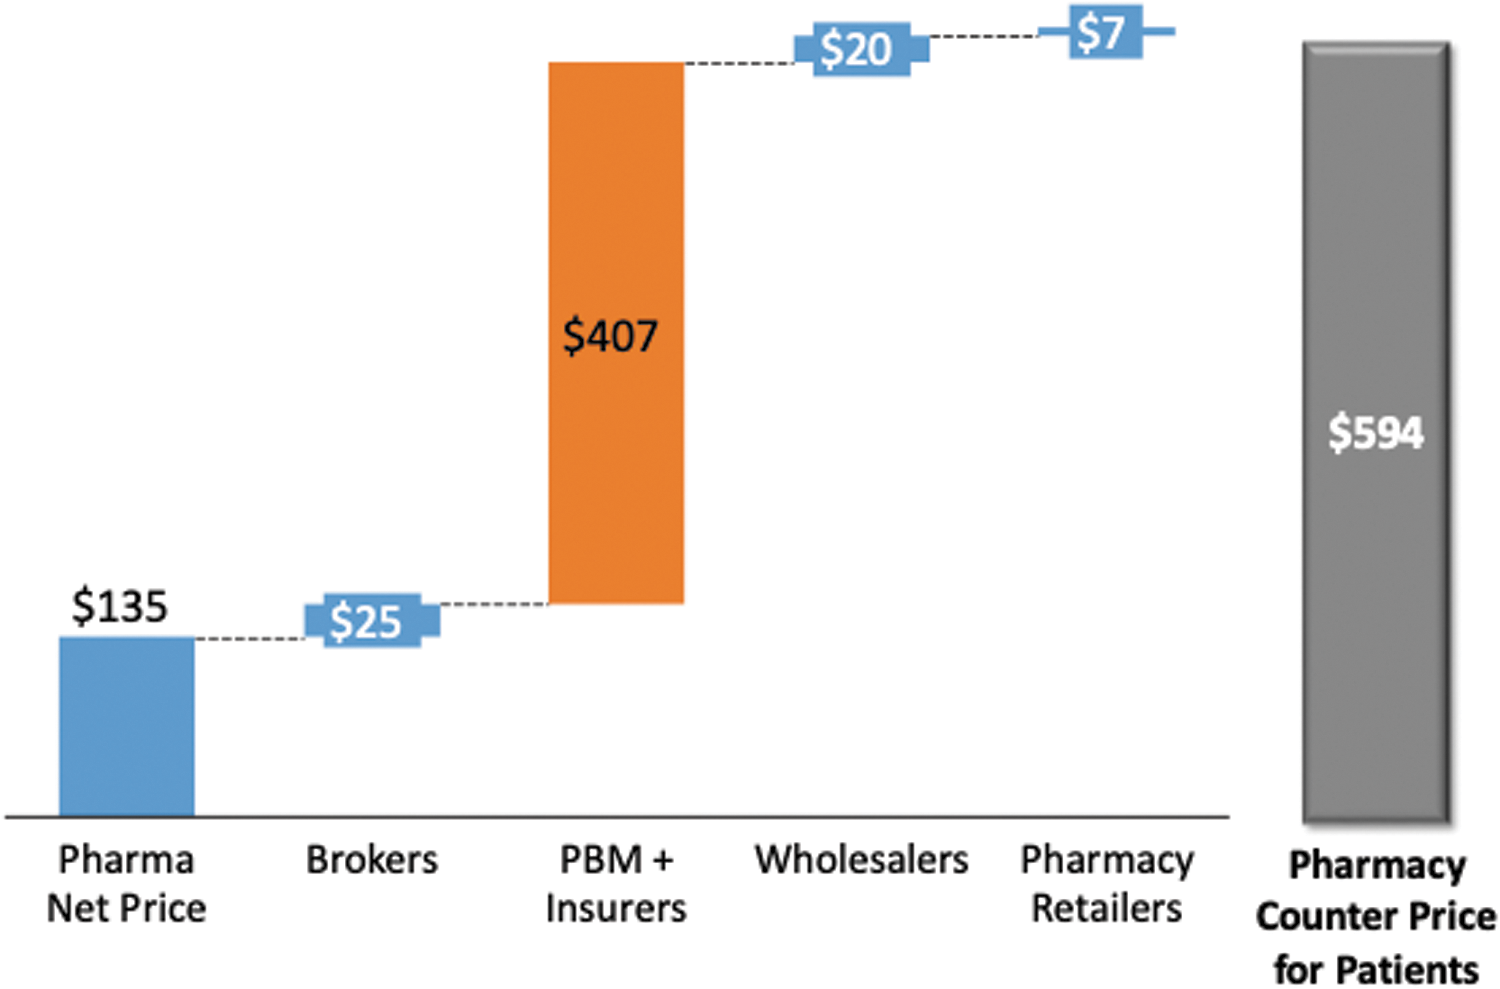
Disaggregation of Humalog pharmacy list price ($/vial). Source: American Medical Association.
Although middlemen extract significant subsidies, biopharma companies are also encountering pressures on all sides of the ROI equation in a tougher competitive environment. Although these companies have enjoyed robust stock returns of late and have benefited from cash-rich balance sheets, R&D ROI has dropped from 10% in 2010 to <2% in 2018. Product development costs have grown 82% (harder to develop blockbusters) and peak sales have dropped 50% (net pricing as slowed as middleman rebates/discounts have increased). 28 The key takeaway here is that there are opportunities for cost savings across the entire value chain, but since everyone's incentives are interrelated and each player faces a different set of risks and returns, whose welfare should we prioritize?
Perspectives for the Future
The systemically important nature of health care to the country's long-term success means that a perennially underperforming ROI is not sustainable. Potential solutions are multifaceted (by necessity) and bring to bear social, political, economic, and moral dimensions and priorities to the forefront. This article concludes by touching upon a couple of areas gaining traction in both the public and private sectors with promising potential to improve the system's economic health.
Payer reform—although the role of middlemen is multidimensional, in helping to bridge supply with demand and create adequate channels for drug delivery, proposals to curb their influence in price setting are gaining traction. At the same time, there is reason to believe increased consolidation on the part of pharmaceutical companies (upstream) or hospitals/providers (downstream) will naturally curb intermediary market power. Payer reform can thus be accomplished by regulatory mandate or economic incentive. In addition, the increasing use of big data in insurance pricing, both by established players and new entrants, can help streamline operations and reduce underwriting costs.
Disintermediation by technology and consumer-driven health care—as mentioned earlier, one of the key impediments to fully realizing the potential of pricing transparency is the decoupling of payment versus consumption in health care. Increasingly, new technologies are empowering patients (consumers) to take more control over not just their health but also their prospective medical bills. Closing the chasm between ownership of a good and its payment could better align incentives and thereby change behavior to be more cognizant of costs and ROI. Results from a recent digital health survey show that over half of the respondents would trust a major technology company (Google, Amazon, and Microsoft) with their health care data. 29 Although privacy concerns loom large, a digital future could mean empowerment, cost efficiencies, and transparency in health care, akin to the type of transformations these companies brought to their respective industries.
Although none of these potential solutions are without risk, continuing down the present path may be the greatest risk of all. Improving the economics of the system would alleviate the burden on future generations to provide affordable quality care, commensurate with living in the world's richest country.
Footnotes
Author Disclosure Statement
No competing financial interests exist.