
Abstract
Background:
The financial strain of type 1 diabetes on the United States health care system, patients, and employers underscores the importance of developing novel treatments for the disease. This study estimated the lifetime economic burden attributable to type 1 diabetes in the United States.
Methods:
A patient-level, Markov state/transition simulation model was developed to compare cumulative societal costs among patients with and without type 1 diabetes. For each patient type, 1 prevalent and 10 incident cohorts were constructed and followed annually over a lifetime horizon. The 1 prevalent cohort with type 1 diabetes entered in the first year of the model and at the current age of each patient, whereas the 10 incident cohorts entered in each of 10 subsequent years and at the age of diagnosis of each patient. Patients were assigned age-specific annual medical expenditures and lost wages. Model outputs included the total cumulative medical and lost productivity costs attributable to type 1 diabetes, defined as the difference in costs between patients with and without type 1 diabetes.
Results:
The model consisted of 1,630,317 patients with type 1 diabetes and an equal number of patients without type 1 diabetes. The difference in lifetime costs was $813 billion (95% confidence interval: $682–$1037 billion), representing a high burden of illness compared with patients without type 1 diabetes. Sensitivity analyses demonstrated robustness in model results.
Conclusions:
Our findings suggest significant investment in research and development of novel treatments for type 1 diabetes is justified, given the high burden of illness associated with the disease.
Introduction
Diabetes contributes $237
Among patients with type 1 or type 2 diabetes, the complications that arise from the disease are a major cause of morbidity, mortality, and financial burden to patients and the health care system. 3,4 In an analysis of 2009 United Healthcare data, patients with diabetes who developed disease-related complications had nearly three times the average annual cost compared with patients with diabetes without complications. 5
Additionally, using data from the California Public Employees' Retirement System health program, members with diabetes and any combination of comorbid heart, cerebrovascular, or renal disease had excess annual per-person expenditures of $21,181 (2008 USD) compared with members with none of these conditions. 6 Moreover, data suggest that the cost impact of an event due to a diabetes-related complication remains high in the 2 years following the event compared with the costs in the year before the event. 7 Furthermore, mean hospital charges per admission for diabetic ketoacidosis, a severe complication most predominantly associated with type 1 diabetes, 8 was $26,566 (2014 USD) based on an analysis of the Nationwide Inpatient Sample. 9
In addition to the costs of complications, the cost of treatment represents a substantial proportion of the overall cost of managing type 1 diabetes. Insulin pump therapy (continuous subcutaneous insulin infusion [CSII]) has become widely used and accepted along with the use of continuous glucose monitors (CGMs). 10 Typically, newer generation pumps can cost upward of $8000, of which patients may be required to pay some of that cost out-of-pocket (OOP) based on insurance coverage. 11 In addition to the cost of CSII and CGMs, patients with type 1 diabetes have to contend with the rising cost of insulin. According to a study by Hua et al., the average price of insulin nearly tripled between 2002 and 2013 12 ; moreover, in 2016, patients with type 1 diabetes spent $5700 per person on insulin, which accounted for 31% of the overall per-person spending for that year. 13
Given the long-term progression of disease and cumulative costs over time, diabetes prevention programs aimed at delaying or preventing progression have demonstrated substantial downstream cost savings, or return on investment. 14 –21 While a number of publications have addressed the financial impact of disease prevention in type 2 diabetes, the same is not true in type 1 diabetes. Only one publication exists that estimated lifetime medical and indirect costs attributable to type 1 diabetes. 22 Using older data from 1999 to 2005, Tao et al. evaluated lifetime costs for a single prevalent cohort and separately for a single incident cohort of patients with type 1 diabetes.
By not combining the two groups, it is difficult to ascertain the total burden of illness across all patients with the disease, including both those currently eligible for a novel intervention (prevalent cohort) and those who will become eligible for a novel intervention in the future (multiple incident cohorts). 23 Combining the two groups allows for an assessment of the overall attributable burden of disease, which informs the total societal return on investment of developing a novel treatment that reduces this burden by delaying disease progression, preventing disease progression, or eliminating the disease altogether. As such, this study aims to estimate the attributable lifetime economic burden of type 1 diabetes among prevalent and multiple incident populations in the United States.
Materials and Methods
Model overview
A patient-level, Markov state-transition simulation model was developed to estimate the lifetime economic impact of type 1 diabetes in the United States.
The economic burden was modeled from the U.S. societal perspective in which both direct medical expenditures and individual lost income were assessed. The model patient types included: (1) patients with type 1 diabetes, and (2) patients without type 1 diabetes. In both types, patients entered the model one at a time and were assigned age-specific annual direct medical expenditures. In addition, patients with type 1 diabetes were assigned age-specific annual indirect income losses, defined as the difference in annual wages between patients with type 1 diabetes and without type 1 diabetes. Model outputs included the total lifetime cost attributable to type 1 diabetes. The model was programmed in TreeAge (TreeAge Software, Inc., Williamstown, MA).
Model structure
For patients with and without type 1 diabetes, we constructed 1 prevalent cohort and 10 incident cohorts, both of which were followed annually and over the course of a lifetime horizon.
Ten incident cohorts were selected for illustrative purposes and to limit model complexity. The prevalent cohort with type 1 diabetes entered the model in the first year of the model simulation, and at the current age of each patient, whereas 10 incident cohorts entered the model in each of 10 subsequent years of the model simulation (beginning with model year 1) and at the age in which each incident patient was initially diagnosed; in both instances, patients entered and passed through the model one at a time based on their simulated age. The prevalent and incident cohorts of individuals without type 1 diabetes were constructed based on the age distribution of patients with type 1 diabetes in their prevalent and incident cohorts.
Model processes
Patients with and without type 1 diabetes in both prevalent and incident cohorts were followed until death. The model, therefore, consisted of two health states: (1) alive and (2) dead, which was an absorbing state. Model cycles of 1 year were assumed. Patients who survived the annual model cycle were aged and entered a subsequent annual model cycle in the “alive” health state. Patients with type 1 diabetes continued to incur direct medical expenditures and indirect income losses after their matched patient without type 1 diabetes died out of the model. A 100-year time horizon (i.e., lifetime) was also assumed, which was determined based on when the last patient with or without type 1 diabetes exited the model. Supplementary Figure S1 illustrates the model process.
Model inputs
Data inputs for the model were derived from published literature and an analysis of a publicly available data source. Table 1 summarizes the key clinical and economic inputs used in the model.
Model Parameters
SMRs for individuals 30–44 years of age are from Miller et al. 29 SMRs for individuals 45+ years of age are from Gu et al.. 28 Expenditure and income estimates are reported in 2016 USD.
This variable was not incorporated as a model input since only age-specific variables were included.
Defined as the difference in annual wages between patients with and without type 1 diabetes; lost annual wages were assigned to individuals with type 1 diabetes in the model.
MEPS, Medical Expenditure Panel Survey; SE, standard error; SMR, standardized mortality rate.
Clinical inputs consisted of prevalence and incidence rates for type 1 diabetes as well as mortality rates for patients with type 1 diabetes and the general population. To construct a prevalent cohort of patients with type 1 diabetes, published estimates of age-specific prevalence rates of type 1 diabetes were applied to age-specific population counts for the U.S. general population. 24,25 Similarly, to construct each incident cohort of patients with type 1 diabetes, published estimates of age-specific incidence rates of type 1 diabetes were applied to age-specific population counts for the U.S. general population. 25,26
Three sets of inputs from the literature were used to assign mortality rates to patients with type 1 diabetes. For patients with type 1 diabetes between the ages of 0 and 29 years, age-specific type 1 diabetes-specific mortality rates were used to estimate the probability of death in a given year. 27 Since the literature is limited for age-specific mortality rates for patients with type 1 diabetes beyond age 29 years, a second approach was undertaken to assign mortality rates to patients with type 1 diabetes ≥30 years of age in our model.
Standardized mortality rates, or the ratios between the observed number of deaths in a population of individuals with type 1 or type 2 diabetes and the number of deaths that would be expected based on the age- and sex-specific rates in a general population of individuals without diabetes, were applied to age-specific U.S. general population mortality rates from the Centers for Disease Control and Prevention (CDC) life tables to estimate the probability of death in patients in this population. 28 –30 Estimates of age-specific mortality for individuals without type 1 diabetes were assumed the same as the U.S. general population and were obtained from the CDC life tables. 30
In addition to clinical inputs, economic inputs, including total annual direct medical expenditures and annual income for patients with and without type 1 diabetes were obtained from an analysis of the Medical Expenditure Panel Survey (MEPS) dataset. 31 These economic measures were assessed by age, and were assigned to patients remaining alive in each model cycle. A detailed description of our MEPS data analysis, including patient selection procedures and variable creation and analysis, can be found in the Supplementary Appendix SA1. Total direct medical expenditures were defined as the sum of payer and OOP expenditures associated with hospitalizations, ambulatory visits (hospital outpatient visits, physician office visits), emergency department visits, home health agency visits, vision and dental visits, and prescription medication and medical supply use.
Individual income was defined as the self-reported income for the past year for all individuals 18 years of age and older. For individuals between 18 and 64 years of age, individual income was simply estimated as their expected income based on their current age. Instances in which respondents reported an income of zero, MEPS divided the household income evenly by all working-aged persons in the household. For individuals 65 years of age and older, we assumed an individual income of zero since the annual income for a person 65 years of age and above could be a combination of Social Security, pensions, capital gains, and other asset wealth, which we were unable to estimate.
Both total annual direct medical expenditures and respondent annual income were inflated to 2016 USD using the medical care component and all urban consumers component of the Consumer Price Index, respectively. 32 Individual income was assessed for patients with and without type 1 diabetes; the difference between the two patient types was assessed and applied to patients with type 1 diabetes as the potential lost income that was attributable to the disease. All direct and indirect costs were discounted at a rate of 3% annually.
Model outputs
Model outputs included the cumulative attributable burden due to direct medical expenditures, the cumulative attributable burden due to indirect costs (i.e., income loss), and the total cumulative societal burden attributable to type 1 diabetes over a lifetime; each of these outputs was also estimated on a per-patient basis. The attributable burden was defined as the difference in costs between patients with type 1 diabetes and patients without type 1 diabetes, and the total societal attributable burden was defined as the sum of the differences in direct and indirect costs. Additionally, life expectancy for patients with and without type 1 diabetes was estimated based on age-specific mortality rates for each patient type. The difference in life expectancy between the two patient types represented the number of life years gained or saved had patients with type 1 diabetes lived without the disease.
Analyses
Both primary and secondary analyses were conducted. The primary analyses entailed projecting the total societal attributable burden associated with type 1 diabetes in a cohort of individuals with existing disease (1 prevalent cohort) and in successive cohorts of patients newly diagnosed with type 1 diabetes over the following 10 years (10 incident cohorts). Secondary analyses consisted of three separate subgroup analyses: (1) the total societal attributable burden from 1 prevalent population, (2) the total societal attributable burden from 1 incident population, and (3) the total societal attributable burden from 10 incident populations.
Standard errors (SEs) calculated from the MEPS data analysis of direct medical and indirect expenditures were used to generate 95% confidence intervals for all model results. Specifically, a second-order Monte Carlo simulation was used to draw an estimate from a gamma distribution function for all direct and indirect cost parameters; each distribution was specified by the mean and SE estimated during the MEPS data analysis. Model outcomes are presented at time horizons of 10, 50, and 100 years.
To test the robustness of the base case results, multiple one-way sensitivity analyses (OWSA) were conducted on model input parameters with the most uncertainty. Since MEPS does not include expenditure data related to CGMs or insulin pumps, the total annual direct medical expenditure input was tested for the prevalent and incident cohorts of patients with type 1 diabetes. Similarly, given the uncertainty with age-specific mortality rates for patients with type 1 diabetes greater than 29 years of age, this input was also tested. These model parameters were varied one at a time by 15% above and below the base case input values. OWSA are presented for the primary analysis only.
Results
Based on published age-specific prevalence and incidence rates of patients diagnosed with type 1 diabetes, we estimated 1,207,107 patients with existing disease (i.e., 1 prevalent cohort) and 42,321 patients with newly diagnosed disease (i.e., 1 incident cohort). These estimates align well with statistics published by the American Diabetes Association. 33 In the primary analysis consisting of 1 prevalent cohort and 10 incident cohorts, the model population consisted of 1,630,317 total patients with type 1 diabetes (i.e., 1,207,107 from 1 prevalent cohort plus 423,210 from 10 incident cohorts); an equal number of patients without type 1 diabetes also entered the model.
Figure 1 graphically presents the results from the primary analysis. The rate of increase in the cumulative societal burden attributable to type 1 diabetes is highest in the first 50 years of the model, and plateaus thereafter due to (1) increased mortality among older patients with type 1 diabetes (and thus smaller cumulative differences in direct medical costs) and (2) the assumption of no annual income among all patients ≥65 years of age (and thus no cumulative differences in annual income).
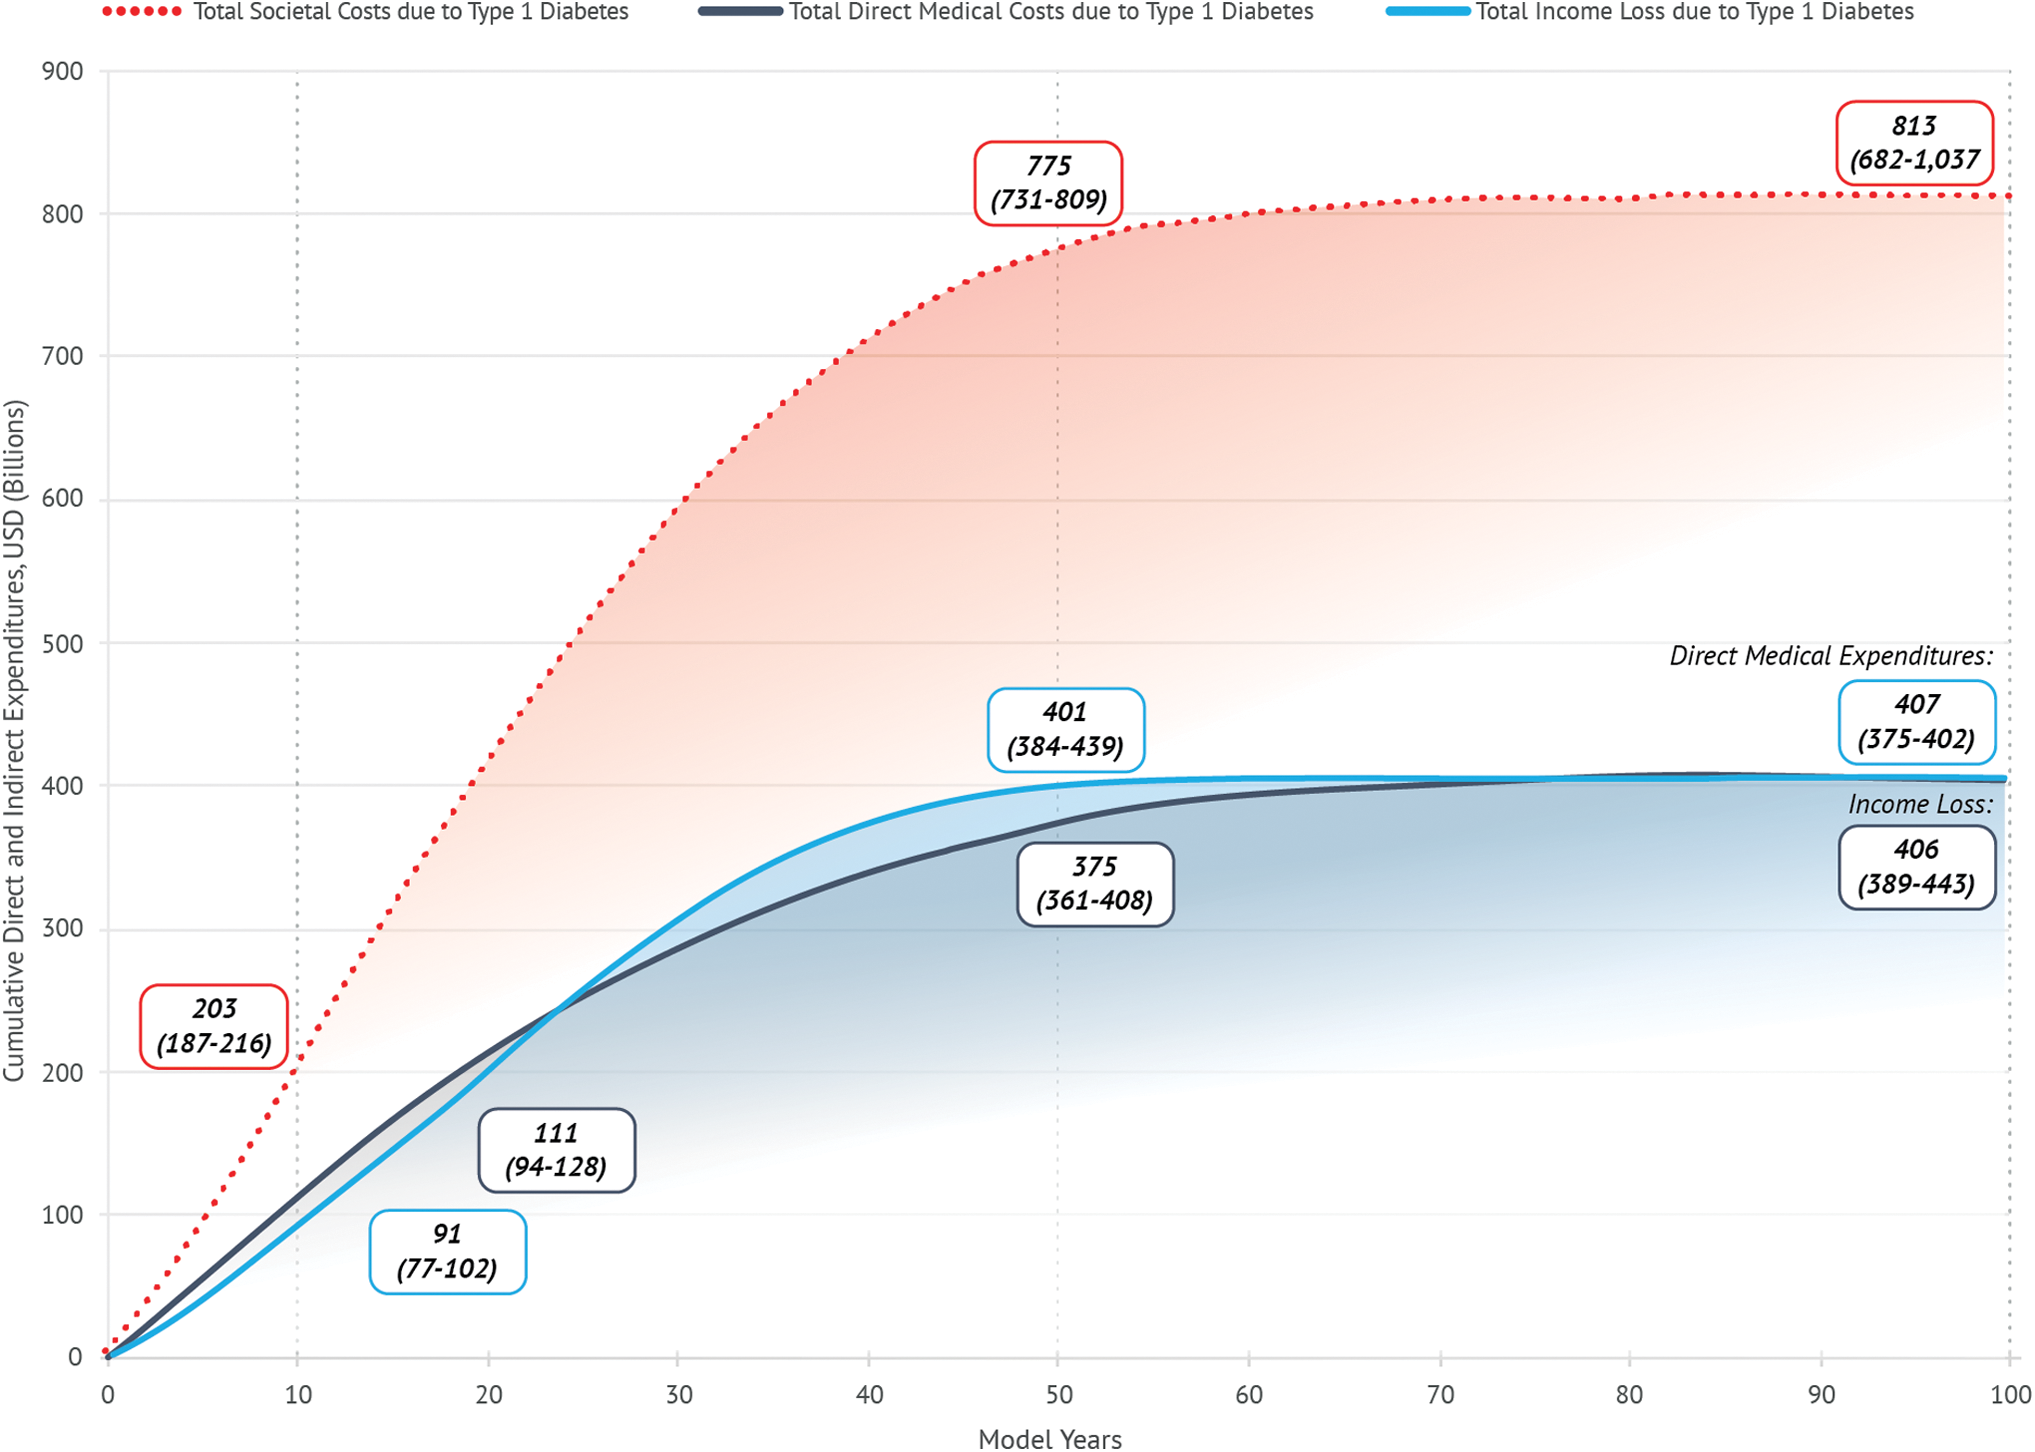
Total direct and indirect costs attributable to type 1 diabetes for 10 incident cohorts plus a prevalent cohort. Color images are available online.
In particular, the projected difference in cumulative cost between patients with type 1 diabetes and their controls was $203 billion after 10 years, at which time direct medical costs accounted for $111 billion (54.9%) of the total difference and lost productivity accounted for $92 billion (45.1%).
After 50 years, that difference had increased to $775 billion, with direct medical costs accounting for $375 billion (48.3%) and lost productivity accounting for $400 billion (51.7%). By the end of the simulation (100 years), the projected difference in cumulative costs was $813 billion (95% confidence interval: $682–$1037 billion), of which direct medical expenditures and lost productivity each accounted for 50%.
Across all model time horizons, payer costs represented 69% of direct medical expenditures, while patient OOP costs represented the remaining 31%, which over the course of a lifetime would yield more than $75,000 in excess OOP direct medical expenditures per patient with types 1 diabetes. On a per-patient level, the cumulative societal burden attributable to type 1 diabetes was $498,418 over the course of a patient's lifetime.
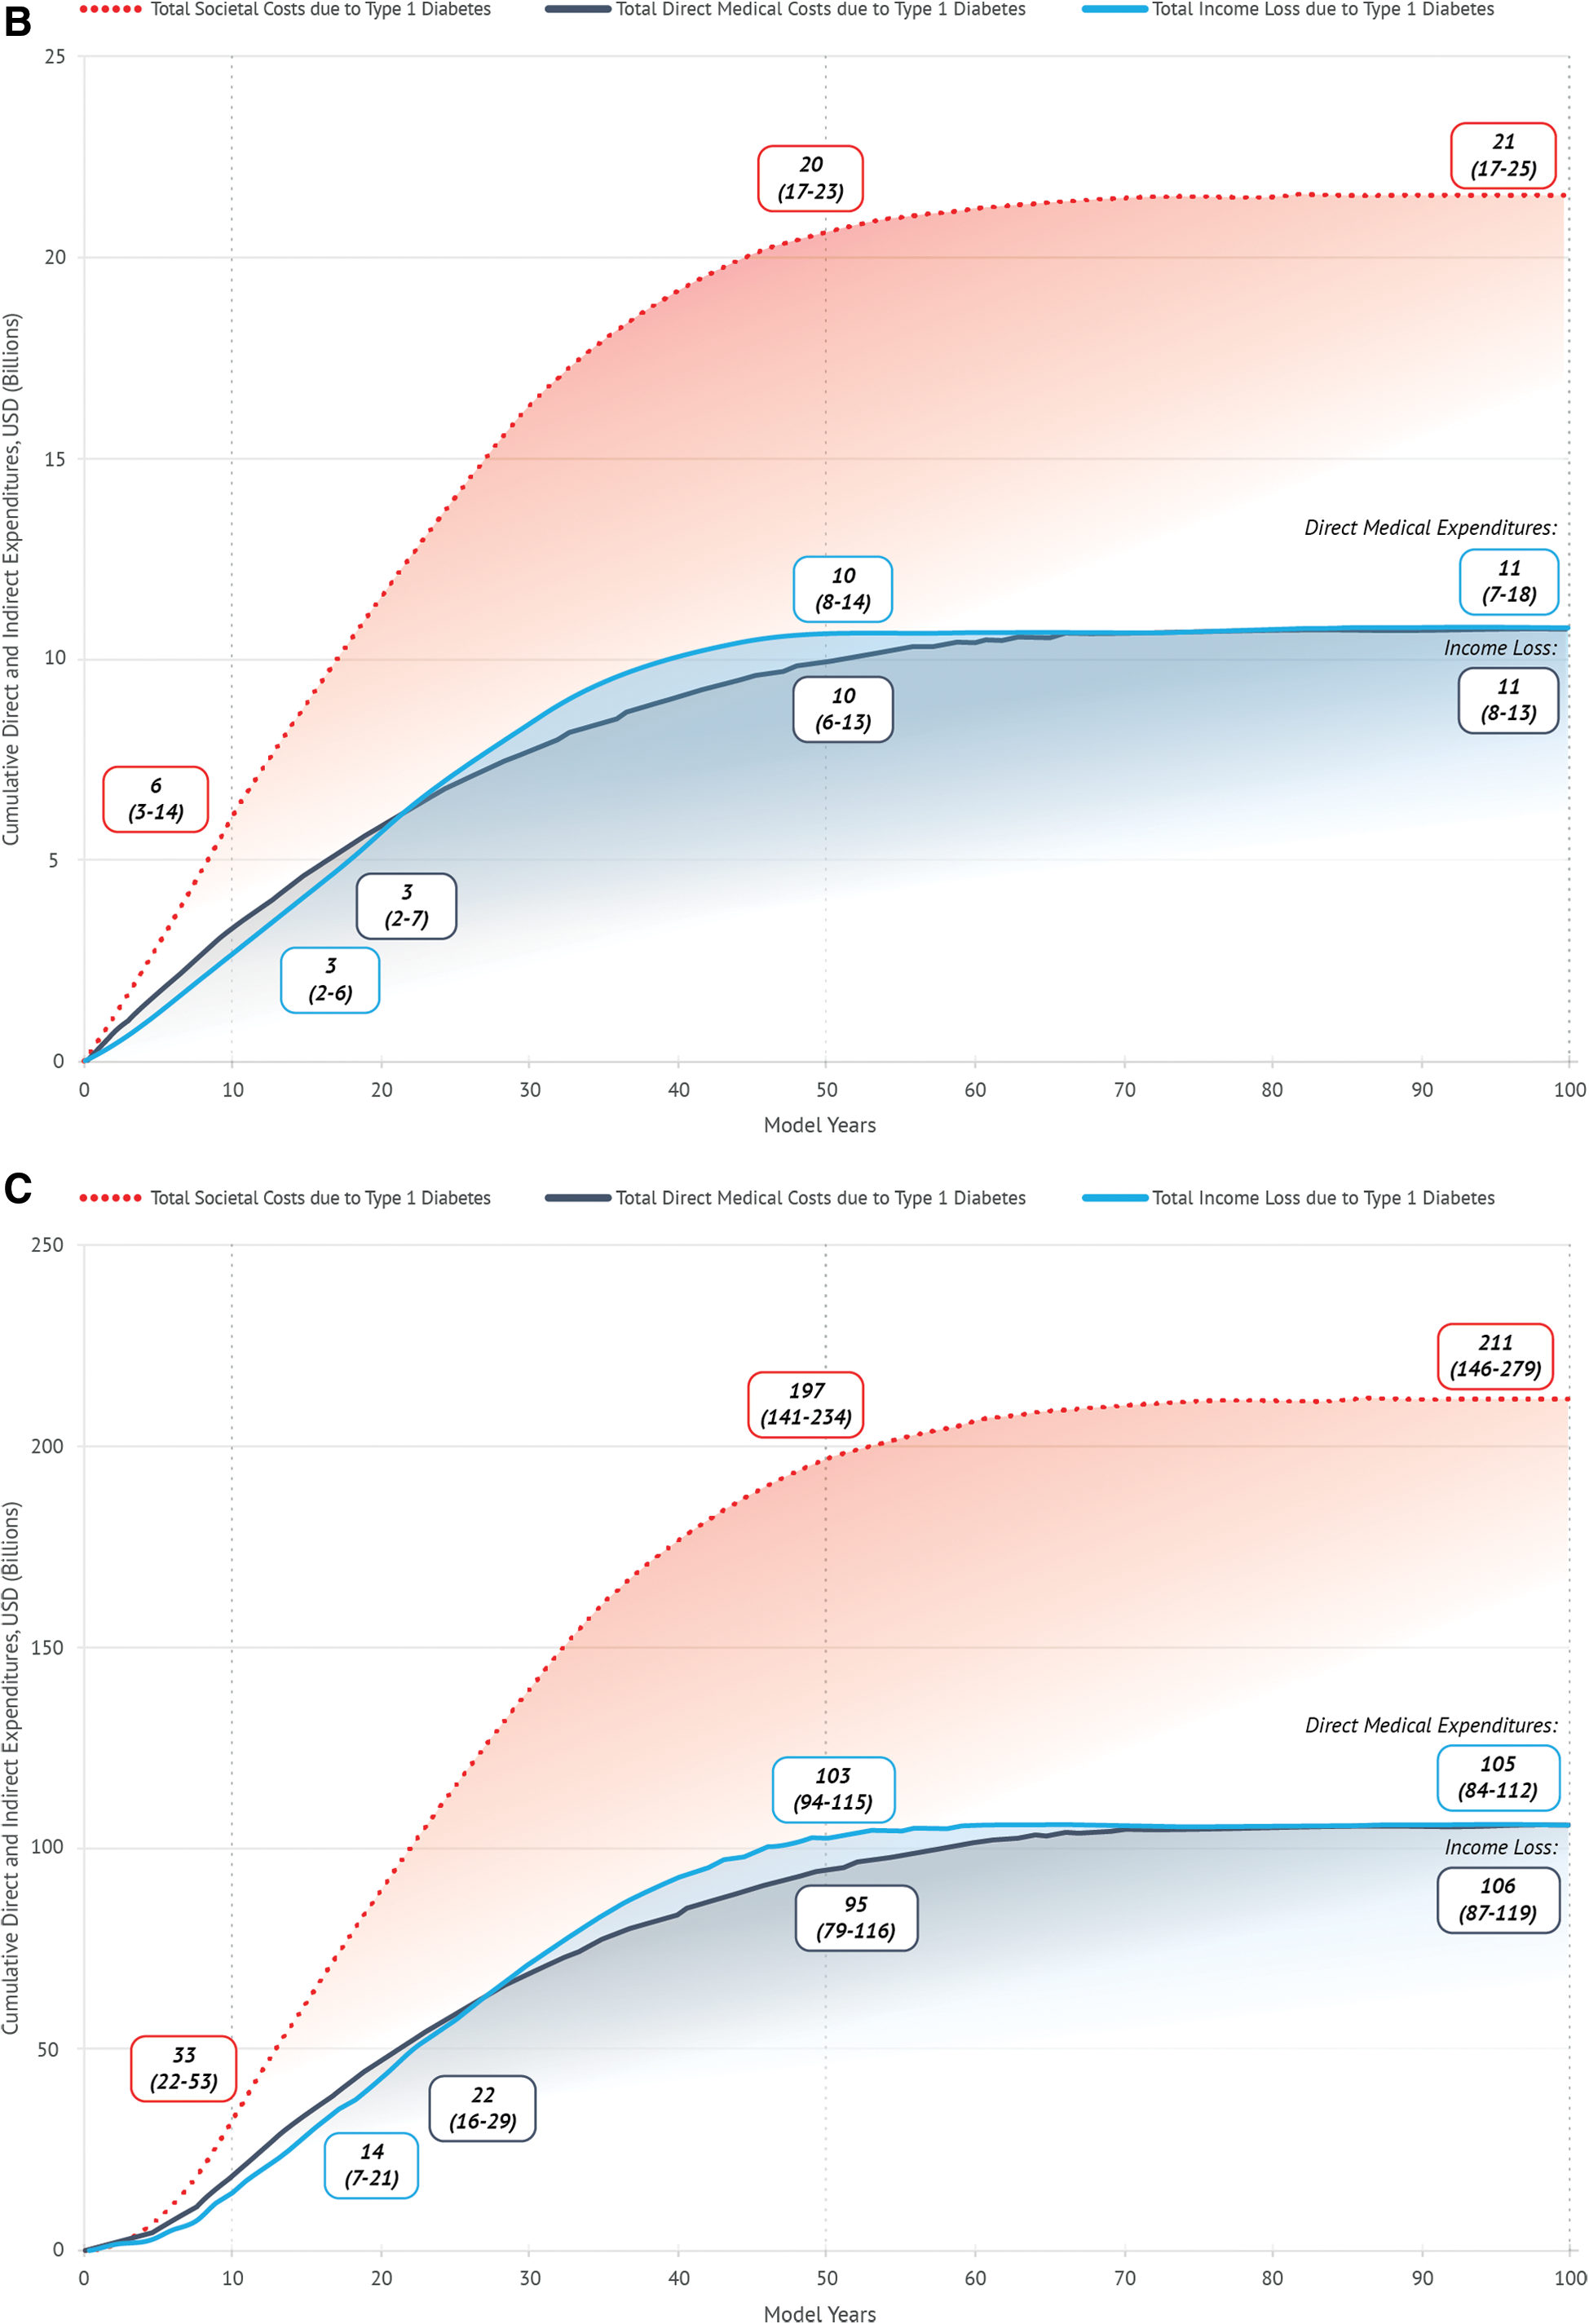
In secondary analyses of a single incident cohort, the projected lifetime difference in cumulative cost between patients with type 1 diabetes and their controls was $21 billion (95% confidence interval: $17–$25 billion), of which direct medical expenditures and lost productivity, each accounted for 50%. In analyses of 10 incident cohorts, the projected lifetime difference in cumulative cost between patients with type 1 diabetes and their controls was $211 billion (95% confidence interval: $146–$279 billion). These secondary analyses illustrate the high economic burden associated with newly diagnosed patients with type 1 diabetes, exposing a high unmet need for cost-saving preventive treatments.
In addition to the economic burden attributable to type 1 diabetes, differences in life expectancy between patients with and without type 1 diabetes in the primary analysis were observed. By the end of the model simulation (100 years), the mean (standard deviation [SD]) age for simulated patients with type 1 diabetes was 70.9 [18.5] compared with 79.9 [14.1] for simulated patients without type 1 diabetes (Supplementary Table S1 as reported in Supplemental Appendix SB1 for survival statistics; Supplementary Fig. S10 for Kaplan–Meier survival curves), indicating a mean [SD] of 9.0 [4.4] life years gained had patients with type 1 diabetes lived without the disease.
Multiple OWSA were conducted to assess the variability of results in the primary analysis. Altering total annual direct medical expenditures and mortality rates in separate sensitivity analyses had a similar and moderate impact on model outputs; as a result, the OWSA demonstrated reasonable robustness when varying model inputs. Findings from the OWSA, along with their respective 95% confidence intervals, are presented in Table 2.
Sensitivity Analyses of Model Results for Lifetime Direct and Indirect Costs Attributable to Type 1 Diabetes for Primary and Secondary Analyses, in Billions
Lifetime represents a 100-year simulation time horizon.
CI, confidence interval.
Results from the secondary analyses trended similarly to that of the primary analysis, albeit at smaller magnitudes, and are summarized in Figure 2, and Supplemental Figures S2–S9.
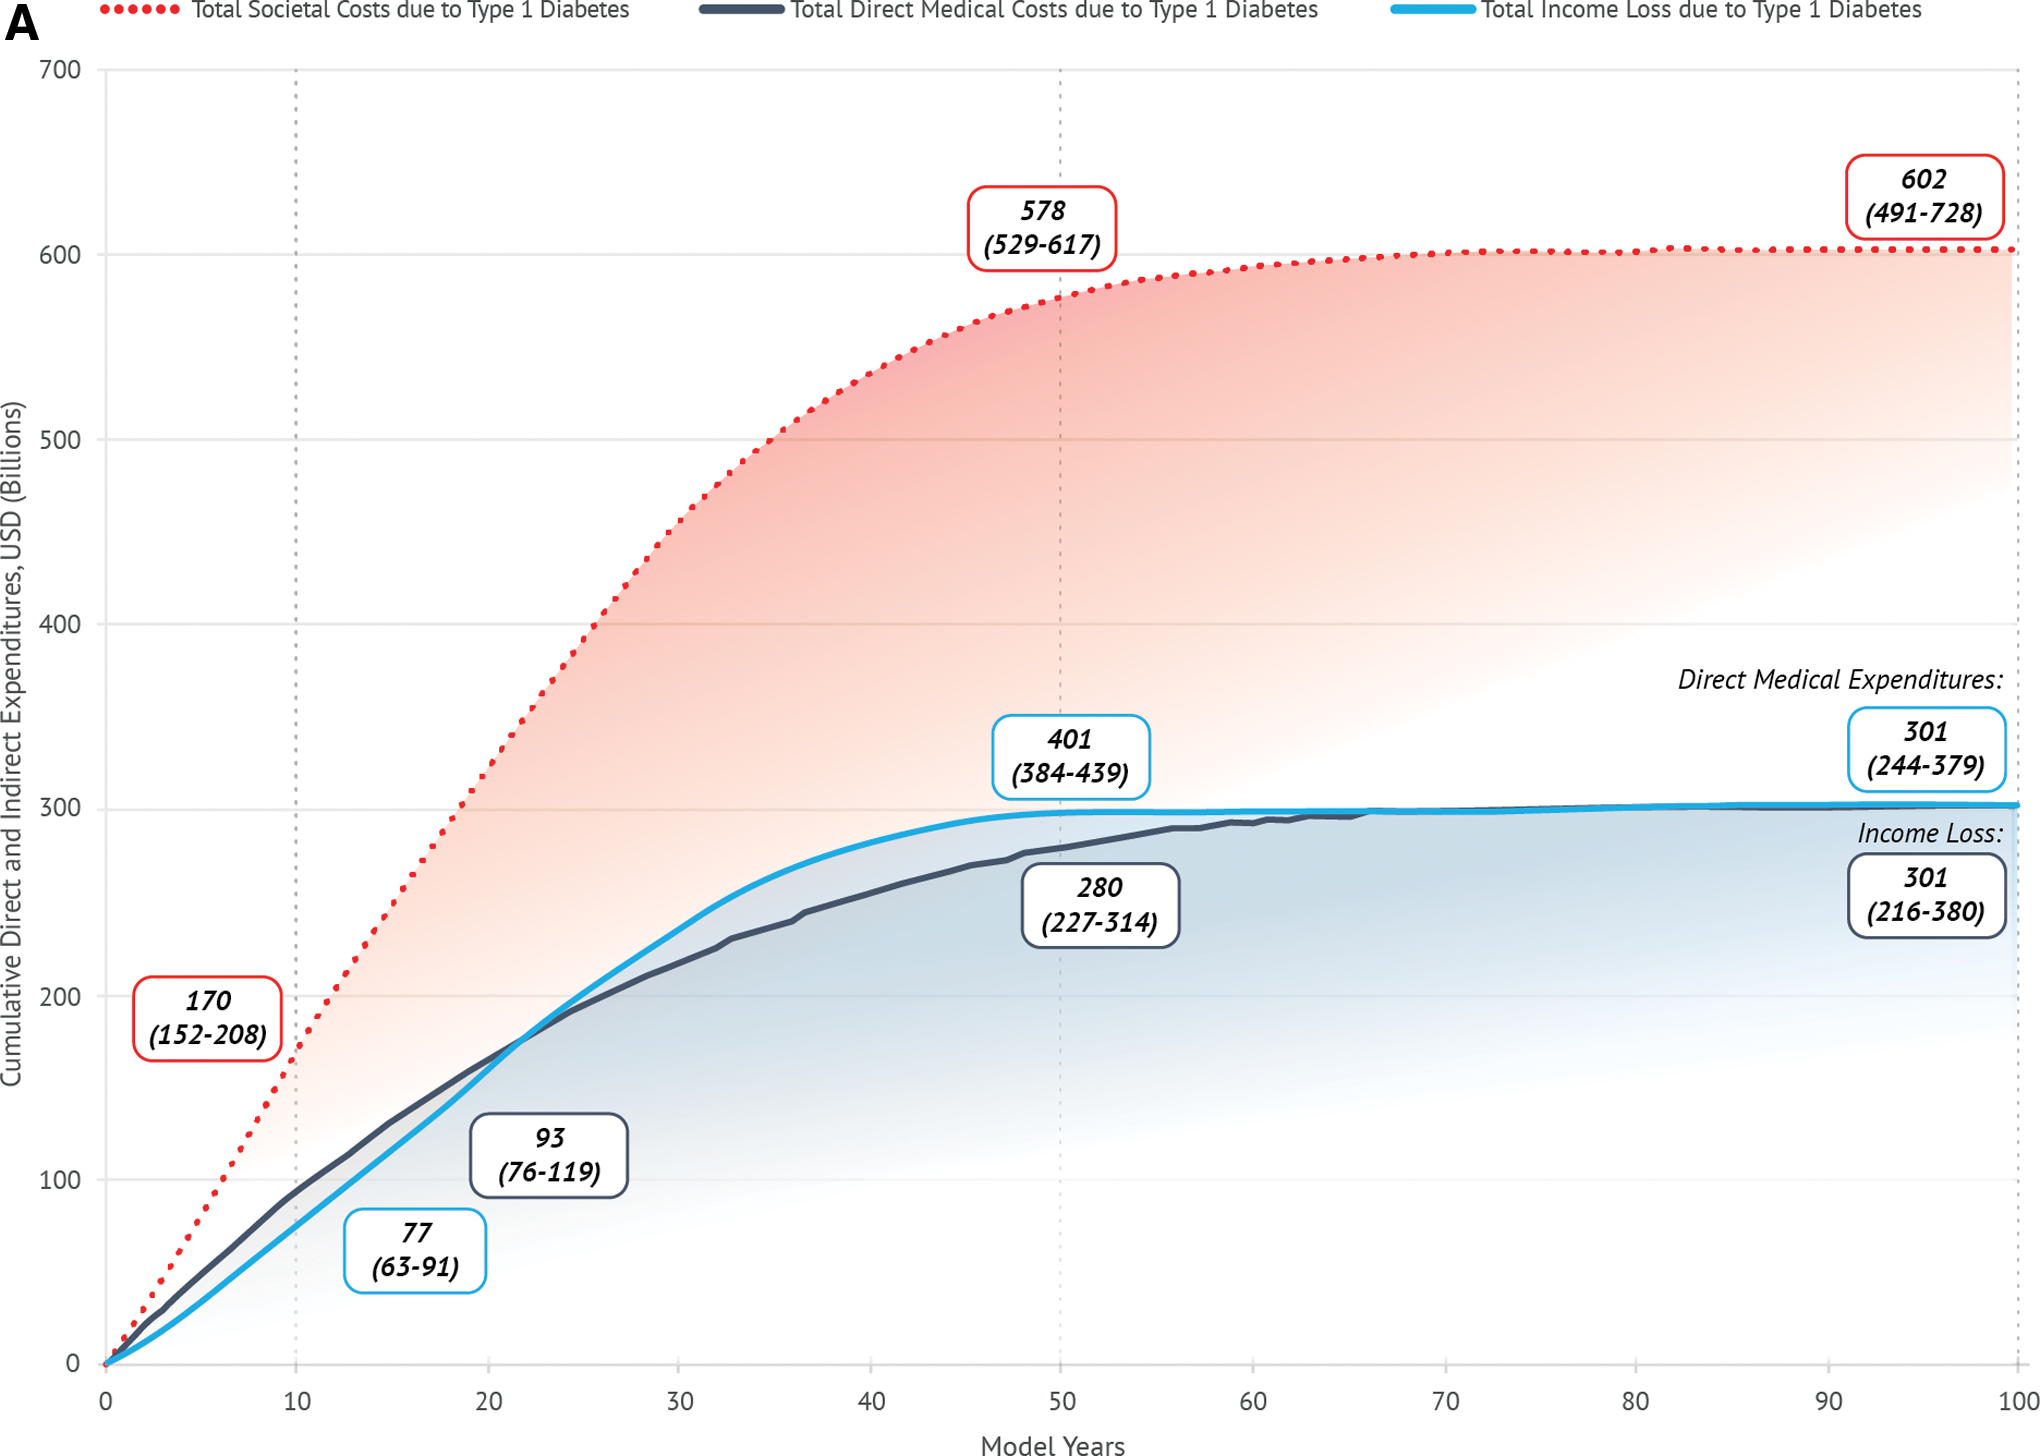
Total direct and indirect costs attributable to type 1 diabetes for all secondary analyses:
Discussion
The use of a patient-level economic model in this study enabled a comprehensive assessment of the lifetime direct and indirect costs attributable to type 1 diabetes. The primary analysis entailed projecting the cumulative attributable burden in a cohort of patients with existing disease (1 prevalent cohort) plus in successive cohorts of patients newly diagnosed with type 1 diabetes over the following 10 years (10 incident cohorts). Our findings suggest a rapidly accelerating cumulative societal burden attributable to type 1 diabetes in the first 50 years of the model time horizon and more than $800 billion in excess cumulative societal costs over a lifetime horizon.
The cumulative attributable burdens due to direct medical expenditures and due to indirect costs (i.e., income loss) were found to have an equal impact on the overall societal burden over the lifetime horizon, while the cumulative attributable burden due to direct medical expenditures was found to have a substantial impact on both payers and patients, suggesting the burden of type 1 diabetes is substantial not just to payers and the health care system but to patients, businesses, and the economy as a whole.
The societal economic burden of type 1 diabetes has not been well studied in the literature. An analysis by Tao et al. was the only publication identified to be relevant in this regard; however, the authors focused solely on a prevalent cohort and separately on one incident cohort of patients with type 1 diabetes. 22 In reality, the financial burden of type 1 diabetes spans not only the current cohort of prevalent patients, but also future cohorts of newly diagnosed patients, thereby limiting comparisons between our primary findings and Tao's results.
For validation purposes, however, the lifetime societal burden attributable to type 1 diabetes from our secondary analysis of one prevalent cohort was comparable to that of Tao's ($602 billion in our study vs. $642 billion in the Tao analysis inflated to 2016 USD); our results were further validated in our secondary analysis of one incident cohort ($21 billion in our study vs. $16 billion in the Tao analysis inflated to 2016 USD). Differences in our study results versus Tao's were likely due to variations in the MEPS patient selection process for identifying those with type 1 diabetes (see the Supplementary Appendix SA1 for a detailed description of our patient selection process).
Additionally, our cumulative lifetime per patient OOP costs (e.g., more than $75,000) equates to approximately $1050 per patient per year (PPPY). This estimate is within 5% of PPPY OOP estimates from both the Center for Medicare and Medicaid Services (CMS), as well as a study conducted by Paez et al., which assessed the rising OOP spending for chronic conditions ($1108 and $1063, respectively, when inflated to 2016 USD using the medical care component of the CPI). 34,35
The burden of type 1 diabetes extends beyond the direct and indirect cost implications. Based on our analysis, life expectancy for patients with type 1 diabetes is impacted compared with patients without type 1 diabetes by an average of nine life years gained per patient (e.g., patients without type 1 diabetes on average live 9 years longer than those with type 1 diabetes). These results compare favorably to the literature. For instance, in a population of patients with chronic hepatitis C ranging from mild to advanced fibrosis, the authors compared life expectancy between patients treated with a fixed-dose combination of sofosbuvir and ledipasvir and treatment-naive patients. 36 Depending on the age of the patient and the fibrosis level, treated patients gained up to 10 life years, with life expectancy gradually decreasing with advancing age.
Additionally, Schackman et al. estimated the lifetime medical cost savings by preventing one HIV infection; by comparing patients with and without HIV, the authors found not only substantial cost savings but also nearly nine life years gained based on averting one case of the disease. 37 Similarly, Romley et al. assessed the impact of earlier initiation of combination antiretroviral therapy in the course of HIV (compared to later initiation), and found those who initiated treatment early had life expectancy gains between 6 and 9 years, depending on the CD4 count upon treatment initiation. 38 These articles, along with our results, highlight the clinical value of novel interventions that have the potential to extend life for chronic disease.
There were certain limitations of our study. First, we likely underestimated total medical expenditures for patients with type 1 diabetes. While we included the cost of medical supplies (e.g., insulin, test strips, ambulance services, wheelchairs, prostheses, glasses, contact lenses) in our estimation of direct medical expenditures, MEPS does not collect data on the utilization or costs associated with insulin pumps, CGMs, or hybrid-artificial pancreas systems, which are associated with high payer and OOP costs.
Additionally, MEPS data are current through 2016, and therefore do not include the most recent insulin price increases in 2017 through partial year 2019. Second, we likely underestimated societal costs for patients with type 1 diabetes. For instance, we did not assign income to patients 65 years of age and older due to the complexity of estimating wealth, assets, investments, pensions, and Social Security. If income was assigned to individuals 65 years of age and older and if we assumed that income trends higher for individuals with nontype 1 diabetes as compared with individuals with type 1 diabetes, our estimates of lost productivity attributable to type 1 diabetes, therefore, would have been even more pronounced. Additionally, the model only included lost annual wages among patients with type 1 diabetes and did not include other societal costs such as lost annual wages among caregivers, which may be an important consideration given the younger age of diagnosis of type 1 diabetes. More broadly, our model focused on the financial burden of type 1 diabetes and did not include estimations of the quality of life burden of the disease. Given that type 1 diabetes can have a substantial impact on patients' lives, we likely underestimated the overall economic burden of type 1 diabetes from a quality-of-life perspective.
Third, in the absence of more recent mortality data, our estimates of death rates for those individuals 45 years of age and older are from Gu et al. 28 Additionally, while these death rates are diabetes-specific, they are based on a population of patients with both type 1 and type 2 diabetes. Given the decreasing trends in the death rates of individuals with type 1 diabetes 0–29 years of age, we would caution that our estimates of mortality are higher than the observed rates in the real world; therefore, our model may transition patients in the type 1 diabetes cohort to death at a faster rate than is experienced in the real world. For this reason, we would also caution that our estimated lifetime costs attributable to type 1 diabetes may represent an underestimation of the true costs borne by society.
Finally, our analysis does not quantify the lifetime financial burden of disease progression deriving from the development and exacerbation of microvascular (e.g., nephropathy, neuropathy, retinopathy) and macrovascular complications (e.g., cardiovascular disease), despite prior research indicating their substantial contribution to the overall cost of disease. In an attempt to quantify the total lifetime financial burden of microvascular and macrovascular complications, we applied proportions of lifetime direct medical expenditures that are borne by macrovascular complications, nephropathy, neuopathy, and retinopathy to the lifetime direct medical expenditures in our study. 39
It is worthwhile noting that estimates of the proportions of complication-related costs were obtained from an analysis of patients with type 2 diabetes; we were unable to identify these proportions among patients with type 1 diabetes in the current literature. Using this back-of-the-envelope analysis, macrovascular complications in type 1 diabetes would account for $211 billion in lifetime direct medical expenditures in a cohort of patients with existing disease (1 prevalent cohort) plus in successive cohorts of patients newly diagnosed with type 1 diabetes over the following 10 years (10 incident cohorts).
Additionally, nephropathy, neuropathy, and retinopathy would account for $85 billion, $69 billion, and $41 billion, respectively. While these estimates are not entirely robust given the differences in populations (i.e., type 2 diabetes from which the proportions are derived vs. type 1 diabetes in our study), the findings highlight the large financial burden of individual complications of diabetes over a patient's lifetime and may underscore the importance of developing novel targeted treatments for diabetes-related complications, in addition to novel treatments aimed at delaying or preventing underlying disease progression.
Conclusions
The future cost implications of type 1 diabetes and its related emergency and long-term complications may lead to a profound and unsustainable financial impact on patients and the health care system, underscoring the importance of developing novel treatments for the disease that delay disease progression, prevent disease progression, or eliminate the disease altogether. Based on our findings, significant investment in research and development of novel treatments that reduce the attributable burden of type 1 diabetes, as well as its associated microvascular and macrovascular complications, is justified, given their projected value to society in alleviating short- and long-term societal costs as well as increasing life expectancy.
This study estimated the economic burden of type 1 diabetes from a U.S. only perspective. The return on investment of a novel treatment could be far greater given worldwide projections for the prevalence and incidence of the disease.
Author Contributions
M.S., J.B., and R.G. conceived the idea, designed the data analysis and simulation model, and wrote and edited the article. M.H. and M.R. also contributed to the design of the data analysis and reviewed and edited the article. J.B. conducted the data analysis and constructed the simulation model. M.S., M.H., M.R., and R.G. reviewed results from the data analysis and simulation model. M.S., J.B., and R.G., are the guarantors of this work and, as such, had full access to all the data in the study and take full responsibility for the integrity of the data and the accuracy of the data analysis and simulation model.
Footnotes
Author Disclosure Statement
The authors disclosed receipt below of the following financial support for the research, authorship, and/or publication of this article.
Funding Information
This study was funded by JDRF and The Leona M. and Harry B. Helmsley Charitable Trust. Matthew Sussman and Jennifer Benner are employees of Boston Health Economics, LLC, Robert Griffiths was an employee of Boston Health Economics, LLC when the article was developed, and Michael J. Haller and Marian Rewers were paid consultants to JDRF and The Leona M. and Harry B. Helmsley Charitable Trust in connection with the study and development of this research article.
Supplementary Material
Supplementary Appendix SA1
Supplementary Appendix SB1
Supplementary Table S1
Supplementary Figure S1
Supplementary Figure S2
Supplementary Figure S3
Supplementary Figure S4
Supplementary Figure S5
Supplementary Figure S6
Supplementary Figure S7
Supplementary Figure S8
Supplementary Figure S9
Supplementary Figure S10
References
Supplementary Material
Please find the following supplemental material available below.
For Open Access articles published under a Creative Commons License, all supplemental material carries the same license as the article it is associated with.
For non-Open Access articles published, all supplemental material carries a non-exclusive license, and permission requests for re-use of supplemental material or any part of supplemental material shall be sent directly to the copyright owner as specified in the copyright notice associated with the article.