
Abstract
Background and Aims:
Accurate prediction of glucose levels in patients with type 1 diabetes mellitus (T1DM) is critical both for their glycemic control and for the development of closed-loop systems.
Methods:
In this study, we utilized real-life, retrospective, continuous glucose monitoring data from 141 T1DM patients (9,083 connection days, 1,592,506 glucose measurements) and in silico data generated by the UVA/Padova T1DM simulator to evaluate different computational methods for glucose prediction. We evaluated the performance of the models using both measures of numerical accuracy, measured by the root mean square error, and clinical accuracy, measured by the percentage of time in each of the Clarke error grid (CEG) zones, and compared the predictions done by autoregressive (AR) models, tree-based methods, artificial neural networks, and a novel model that we devised and optimized for this task.
Results:
Our novel model, constructed on real-life data, achieved clinical accuracy of 99.3% and 95.8% in predicting the glucose level 30 and 60 min ahead, respectively, and reduced the percentage of glucose predictions in zones C–E of the CEG by 60.6% and 38.4% in these prediction horizons, compared with a standard AR model. The model was superior to all other models across all age groups and achieved higher clinical accuracy in subgroups of patients with high glucose variability and greater time spent in hypoglycemia. Compared with real-life data, when evaluated on in silico data, the model had a higher clinical and numerical accuracy.
Conclusions:
A model that optimizes for CEG zones may significantly improve clinical accuracy and clinical outcomes of treatment decisions in T1DM patients. Results obtained from simulated data may overestimate the performance of models on real-life data.
Introduction
Type 1
Despite substantial progress in diabetes technologies over the past decades, recent studies demonstrate that effective clinical management of T1DM is still lacking, particularly in children and adolescents, with many patients not meeting their glycemic goals. 5 –7 The development of continuous glucose monitoring (CGM) devices, which measure glucose in the interstitial fluid continuously, 8 was an important milestone in diabetes monitoring technology and enabled development of new treatment strategies such as closed-loop systems, also termed artificial pancreas (AP). Despite rapid development in this field, only the hybrid closed-loop system, which relies on manual administration of prandial boluses, has been approved for clinical use to date. 9 AP systems consist of three components: a CGM device, an infusion pump, and a dosing algorithm. 10 Personalized predictions of glucose levels are an essential part of AP technologies as they are crucial for dosing algorithms. Prediction of glucose levels is a challenging task due to high intra- and interpatient variability and the influence of many factors such as food consumption, insulin dosage, physical activity, and emotional status. 11
Control algorithms for AP systems published to date can be divided into physiology-based models, data-based models, and hybridization of the two. The data-driven approach uses the individual's retrospective data and does not take into consideration the underlying physiological mechanism or prior medical knowledge. While many models published to date mostly use linear predictors of glucose levels, 12 including model predictive control, proportional–integral–derivative control, and fuzzy logic control, which rely mostly on medical logic, 13 in recent years, an increasing number of data-driven models have been published. Some of the models were constructed and evaluated using in silico data, defined as data generated by a computer simulation, 14,15 and were not evaluated using real-life data.
Motivated by recent developments in the ability of machine learning algorithms to use massive amounts of data in different medical prediction tasks, we evaluated the ability of different data-driven computational models to accurately predict glucose levels using both numerical and clinical performance measures. We compared linear, nonlinear tree-based, and artificial neural network (ANN) models as such nonlinear models have become state-of-the-art models in many fields of machine learning. 16,17 In this study, we devised a novel ANN model optimized for clinical accuracy, aiming at improving the clinical outcomes of treatment decisions based on the results of the model. 18
Methods
Data acquisition
The database used for training and evaluation of computational models included retrospective CGM and insulin pump data of patients with T1DM who visited the National Center for Childhood Diabetes at the Schneider Children's Medical Center of Israel (SCMCI) between December 2015 and December 2018. The inclusion criteria were a diagnosis of T1DM and using a CGM device and an insulin pump simultaneously. Patients with insufficient data were excluded from the analysis. Table 1 depicts the clinical characteristics of the 141 patients included in the study. The average of CGM connection days was 64.4 ± 46.6 per patient, summing up to a total of 9083 CGM connection days and 1,592,506 glucose measurements that were included in the analysis.
Baseline Characteristics of the Study Population
BMI, body–mass index; F, female; M, male.
The study protocol was approved by the SCMCI institutional review board. Informed consent was waived by the institutional review board as all identifying details of the patients were removed before the computational analysis.
Data preparation
As input for the computational models, we used 4 h of historical CGM and insulin dosage data. Since some of the CGM devices report a glucose value every 15 min, we used linear interpolation to fill the missing glucose values. Of note, the output metrics did not include interpolated data. Insulin dosage included both the bolus rate (which was considered as 0 if none) and the basal rate from the insulin pump records. We did not predict the time window of 1-h post insulin bolus administration since a bolus administration by the patient is unpredictable and is a very influential hidden feature that will greatly affect our ability to predict correctly. In addition, to model how much insulin is needed per meal, a future prediction of the expected glucose level without such a bolus is required.
In silico data
In addition to the real-life data acquired, we also trained and tested the computational models on data generated by the distributed version of the UVA/Padova T1DM simulator, which include in silico data of 30 simulated T1DM patients (10 adults, 10 adolescents, and 10 children). 15 This simulator was accepted in 2008 by the U.S. Food and Drug Administration (FDA) as a substitute for preclinical trials for insulin treatments, including closed-loop algorithms for AP systems. Each virtual subject in the simulator is represented with subject-specific model parameters. For each virtual subject, we generated 30 days of data for training, 7 days for validation, and 7 days for testing. For children, three meals and two snacks were included for each day, while adults had three meals and a single snack. Total carbohydrate consumption per day was calculated according to dietary reference intake recommendations. 19 The input for the models was 4 h of historical CGM data and insulin dosing, comparable with real-life data.
Machine learning models
We evaluated the following machine learning models: Autoregressive (AR) model.
20
We used the Tree ensemble using the random forest regressor (RF) implementation of Scikit-Learn
21
Gradient boosting decision tree using LightGBM
22
Fully connected neural networks using Keras
23
A novel neural network architecture that we constructed, which we term the gradually connected neural network (GCN)
For each model, we tried multiple hyperparameters. All the models were tested using 10-fold cross-validation, holding out 10% of the patients each time as a validation set.
Gradually connected network
GCN is a novel neural network architecture that we developed, comprising gradually connected layers (GCLs) with fully connected layers on top rather than using only fully connected layers as commonly used in ANNs (Fig. 1 and Supplementary Fig. S1). The GCL is similar to a fully connected layer, but with the number of connections to output neurons gradually increasing in relation to the input order. The number of nodes and parameters in the GCL is dependent on the previous layer size and two additional parameters: step size and output rows, the values of which were chosen using trial and error (Gradually Connected Layer section in Supplementary Data). GCN proved to be very useful for sequential data such as CGM data since it gives more expressive power to more recent data (e.g., the last 30 min), which are more informative and more relevant for the prediction task. The GCN models we used had four GCLs with one to two fully connected layers on top, summing up to a total of four to five hidden layers.

Illustration of a gradually connected neural network optimized by the Clarke error grid analysis, taking as input CGM data of one patient from the cohort and predicting his/her future glucose levels.
Model optimization and evaluation
We optimized and evaluated the performance of the methods using two performance measures: numerical accuracy, measured using the root mean square error (RMSE), and clinical accuracy, measured by the percentage of prediction in zones C–E on the Clarke error grid (CEG). 18,24 The CEG is a method that quantifies the clinical accuracy of the predicted glucose level compared with the reference glucose level by classifying each pair of predicted and reference glucose levels into five zones (Fig. 1B). Predictions that fall in the diagonal of the graph correspond to perfect agreement between the predicted glucose and reference glucose values, whereas points below and above the line indicate overestimation or underestimation of the actual glucose values. While zones A and B indicate sufficiently accurate or acceptable errors in glucose values, zones C–E indicate unacceptable or potentially risky errors that may result in inappropriate treatment and undesired hypo- or hyperglycemia. We therefore defined predictions in zones C–E as clinically hazard zones (CHZs).
When training a neural network model, the use of different loss functions can greatly affect the results of the model. The standard loss functions we used were the mean square error (MSE) and mean absolute percentage error (MAPE). In addition, we designed new loss functions with the goal of minimizing the number of predictions in the CHZ of the CEG and optimizing our model to gain maximal clinical accuracy (defined as predictions in zones A–B). For each prediction, we calculated a standard loss (MSE or MAPE) and multiplied it by a weight according to the CEG zone it corresponded to before running the optimization algorithm. The weight for each zone was deterministically chosen and we examined multiple options of different weights. To assess statistical significance, we performed a t-test for comparisons between the models and ANOVA between the performance measures of the same model on different subgroups.
Results
Comparing different computational models
For each computational method, we trained multiple models using different hyperparameters for both the 30- and 60-min prediction horizons (PHs) and tested our results using 10-fold cross-validation. We calculated the RMSE and percentage of time in the CHZ of the CEG for each method and every patient. Table 2 presents the mean and standard deviation of each of these measurements using the best model of each method. We compared the percentage of glucose predictions in CHZs using each of the models compared with the baseline model (expanded results are presented in Supplementary Table S1).
Performance of Computational Models for 30- and 60-Min Glucose Prediction Horizons
Highlighted in bold are the lowest RMSE and C–E (%) results and the highest Relative change % results achieved by the different computational methods in both glucose PH.
Relative change was calculated by dividing the percentage of prediction in zones C–E on the CEG [C–E (%)] of the model with the percentage of prediction in these zones when using a baseline AR model.
AR, autoregression; CEG, Clarke error grid; FC, fully connected neural network model; GCN, gradually connected network; GCN1–3 are ensembles of several GCN models that were trained using different zone weights and standard loss functions; LightGBM, gradient boosting decision tree; PH, prediction horizon; RF, random forest regressor; RMSE, root mean square error.
Of note, tree-based methods, the RF model and a gradient boosting decision tree model, had better numerical accuracy than AR models. However, both models had lower clinical accuracy than the AR model, motivating us to try additional computational methods that might be better suited for optimization of clinical accuracy.
We next investigated the fully connected neural network model (FC) with 2 hidden layers and width 50, which did not improve the numerical accuracy, compared with RF and LightGBM, but did improve clinical accuracy, leading us to devise the gradually connected neural network architecture.
The GCN1–3 models are ensembles of several GCN models that were trained using different zone weights and standard loss functions. The first model (GCN1) is an ensemble of two GCN models, both using only MSE as the loss function (all zone weights are 1). This model significantly improved the RMSE result compared with FC and achieved the lowest RMSE for the 30-min PH and a very similar RMSE result to the LightGBM for the 60-min PH. The second model (GCN2) is aimed at optimizing both numerical and clinical accuracy and is an ensemble of 24 models with 6 unique zone weights, some of which focus on zones C–E of the CEG, while others are more balanced and also give a higher weight to zones A–B. This model resulted in an improvement of both clinical and numerical accuracy compared with the AR model.
The third model (GCN3) is optimized mostly for decreasing the prediction in the CHZ of the CEG; is an ensemble of six models, which had weights for the different zones of the CEG; and uses both MSE and MAPE for standard loss. This model resulted in a relatively large improvement in clinical accuracy compared with the AR model, reducing the average percentage of predictions in zones C–E of the CEG relative to the AR model by 60% for the 30-min PH and by 38% for the 60-min PH. Of note, while GCN3 managed to significantly increase the clinical accuracy, it had the lowest numerical accuracy compared with all the other computational methods in both PHs.
Comparison of our model, GCN3, and the AR model
To further investigate the performance of our model, GCN3, we analyzed several performance measures for the 60-min glucose PH on different subgroups of patients. These analyses are presented in Figure 2 (expanded results are presented in Supplementary Tables S2 and S3). An overall analysis showed that our model significantly decreased the percentage of predictions in CHZs of the CEG (P < 10−11). Examining the individual level, the decrease was apparent in majority of the cohort (123 of 141, 87%; [Fig. 2A]). Notably, the percentage of predictions in these zones was not significantly different between different age groups (P = 0.45 in GCN3 and P = 0.58 for the AR model) (Fig. 2B).
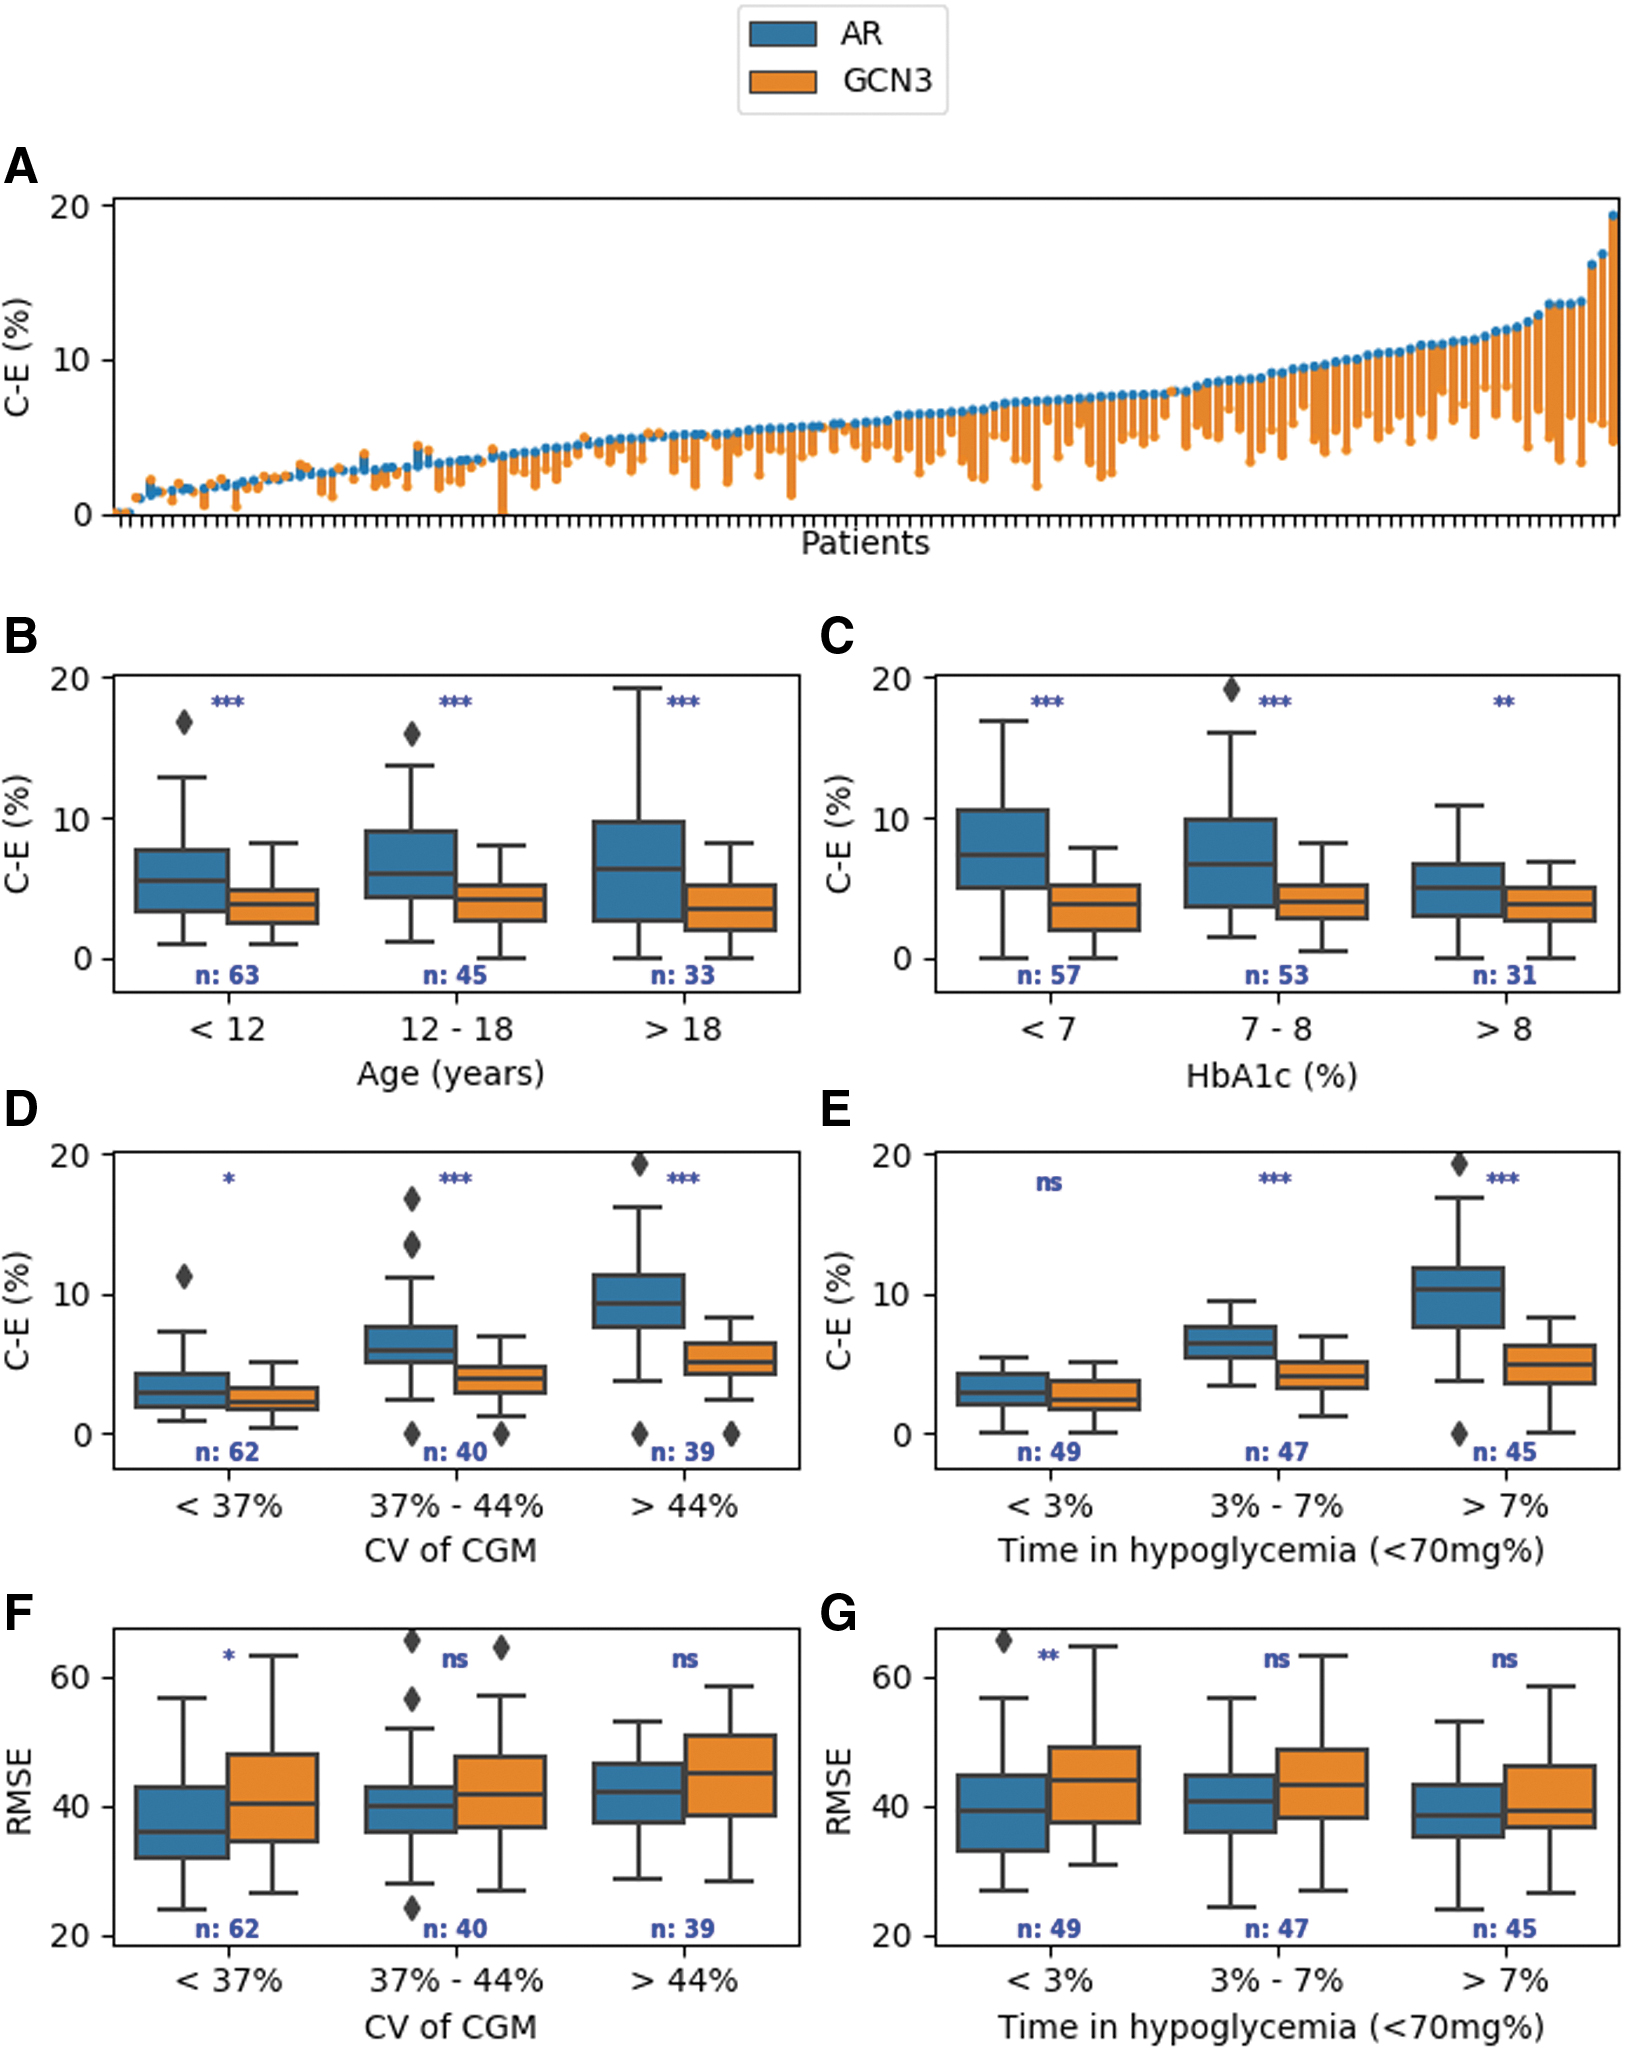
Analysis of the performance measures of our model (GCN3) compared with a baseline model (AR) on different groups of T1DM patients.
To examine if our model performs differently on patients with a different degree of glycemic control, we used data on HbA1c and created three subgroups consisting of patients with good glycemic control (defined by HbA1C< 7%), moderate glycemic control (7% < HbA1C < 8%), and poor glycemic control (HbA1C >8%) 25 (Fig. 2C). The clinical accuracy of our novel model, GCN3, was not affected by the HbA1C level (P = 0.69), while the clinical accuracy of the AR model significantly decreased for patients with a lower HbA1C level, reflected by an increase in percentage of predictions in the CHZs of the CEG (P = 0.006) (Fig. 2C).
Next, we investigated subgroups of patients with different percentages of time spent in hypoglycemia, defined as a glucose level less than 70 mg/dL. We divided our cohort into three groups, in which the percentage of time spent in hypoglycemia is <3%, between 3% and 7%, and above 7%. In both models, there was a higher average percentage of predictions in the CHZ of the CEG when the percentage of time spent in hypoglycemia increased. However, in the high hypoglycemic risk group of patients, our model significantly decreased the average percentage of predictions in the CHZ of the CEG compared with the AR model, by 66.4% for the 30-min PH (2.91% using AR vs. 0.98% using GCN3) and by 46% for the 60-min PH (10.95% using AR vs. 5.91% using GCN3) (P < 10−12), thus demonstrating higher clinical accuracy for our method in this high-risk population. Of note, both models had a small decrease (0.7) in the average RMSE in patients who spent a large percentage of time in hypoglycemia (above 7%) (Fig. 2E, G, and Supplementary Table S2).
To study the effect of glucose variability on the performance of our model, we calculated the coefficient of variation (CV) 26,27 from the CGM measurements of each patient. This value measures glucose variability corrected for the mean glucose value per patient. Next, we divided our cohort into three subgroups according to their CV: below 37%, 37%–45%, and above 45%. As expected, the average percentage of predictions in the CHZ of the CEG and average RMSE monotonically increased with an increase in the CV using both models, reflecting the challenge of glucose prediction in patients with high glucose variability. Of note, even in the group of patients with the highest CV (larger than 45%), our method decreased the average percentage of predictions in the CHZ of the CEG by 66.6% for the 30-min PH (2.82% using AR vs. 0.94% using GCN3) and by 40.9% for the 60-min PH (11.63% using AR vs. 6.87% using GCN3) (P < 10−8), reinforcing the significantly better clinical accuracy of our method in patients with high glucose variability (Fig. 2D, F).
Analysis of models using the type 1 diabetes simulator
Similar to the analysis done on real-life data, we next trained the computational models for two glucose PHs, 30 and 60 min, using different hyperparameters, on data generated by the UVA/Padova type 1 diabetes simulator (see the Methods section). We tested our results on 7 generated days for each patient and calculated the RMSE and percentage of time in the CHZ of the CEG for each method per patient. To compare results on simulated data versus real-life data, we trained all the computational models on our real-life dataset of 141 T1DM patients, reserving the last 4 days of each patient for testing (Gradually Connected Layer section in Supplementary Data).
For both PHs, all computational models had a much better performance of clinical and numerical accuracy, as reflected by both a lower RMSE and percentage of time in CHZ of the CEG when trained and tested on simulated data. For example, when trained and tested on real-life data, the highest percentage of prediction in zone A of the CEG for PH 60 was 66.8% for real-life data and 82.3% for the simulated data (Supplementary Tables S1, S4 and S5).
Discussion
In this study, we developed a novel computational model using only real-time glucose measurements and insulin dosage, which significantly improves glucose predictions at 30 and 60 min ahead compared with the commonly used AR model. Our model, optimized for clinical accuracy, reduces prediction errors that are considered hazardous and may lead to inappropriate clinical decisions. We trained and tested the models using a real-life dataset of 141 heterogeneous T1DM patients with over 1,592,506 glucose measurements, making it the largest dataset studied to date for this task. Our model is based on glucose measurements and insulin dosage, which are available for many T1DM patients and can therefore run on devices such as smartphones for everyday use and be easily and efficiently implemented in clinical practice. Most importantly, since the ability to accurately predict the glucose level along a given PH is an important feature of any AP system, implementation of our method can replace existing glucose prediction algorithms to maximize clinical accuracy.
The computational methods that we analyzed included AR models, tree-based methods, and ANNs. ANNs have certain properties that are ideal for approximating glucose levels, including an unknown nonlinear function with multidimensional inputs that vary over time and contain a certain amount of noise. In the last decade, several other studies have tried to harness the power of ANNs for predicting glucose levels in T1DM subjects. 28 –32 These studies used relatively small datasets. In addition, while several performance metrics exist, the most frequently used metric for glucose prediction models in T1DM patients is RMSE, and most models to date were not optimized or evaluated by measures of clinical utility. 12
In this study, we employed a large dataset of T1DM patients with variable clinical characteristics, enabling us to construct robust neural networks that generalize well to unseen data. Our novel model, GCN, has several advantages over existing methods: it can be optimized by different measures of clinical and numerical accuracy; it is fast and simple to deploy, converging faster, and less prone to overfitting compared with other networks with the same size and number of parameters that we tested it gives more expressive power to recent data, which is more relevant to the predictive task; and it can be extended to use both time-related and static features. Our model optimized for clinical accuracy, GCN3, was superior to the more conventional computational models, as reflected by a decrease in the percentage of predictions in the CHZ of the CEG.
While one concern in using our approach is that putting the emphasis on clinical accuracy will potentially lead to a lower numerical accuracy, our analysis of the performance measures of different computational methods demonstrated that there is no clear trade-off between achieving a higher percentage of predictions in the CHZ of the CEG and maximizing the RMSE, leading us to use an ensemble of methods with different optimization for both measures (Table 2). We therefore created three GCN models, with different optimization algorithms for clinical and numerical accuracy. Our GCN3 model, optimized for maximal clinical accuracy using zones of the CEG in the loss function, achieved clinical accuracy of 99.3% and 95.8% in predicting the glucose level 30 and 60 min ahead, respectively, and reduced the percentage of glucose predictions in CHZs of the CEG by 60.6% and 38.4% in these PHs compared with the commonly used AR model. Importantly, the clinical accuracy of our models was pronounced in specific clinical settings, in which the current models perform poorly, such as patients at high risk for hypoglycemia or those with increased glucose variability.
Our analysis also demonstrated the necessity of using real-life data for construction and evaluation of computational models for glucose prediction. By comparing the performance of our model on real-life data with in silico data, we revealed that achieving high clinical and numerical accuracy is much more challenging when real-life data are used. It is plausible that the simulators are limited in their ability to capture the complexity of glucose fluctuation in T1DM and that their database does not contain unexpected events that typically appear in real-life data. However, as on real-life data, our prediction model on in silico data performed better than all other methods.
The strengths of our study are the large dataset, which allowed us to use advanced neural networks that cannot be constructed using small datasets; the clinical heterogeneity of our cohort; and the use of real-world data. However, our model has several limitations. It is plausible that incorporation of more clinical inputs affecting glucose homeostasis, such as meal content and physical activity, would have resulted in enhanced predictive abilities. Our model is based on retrospective CGM and insulin pump data. As such, we lack information that may add to the accuracy of the model. Using data from CGM devices for prediction models is challenging as they suffer from the existence of a time lag between changes in blood glucose and interstitial fluid. 33,34 We believe that measuring blood glucose directly, whether invasive or not, will improve the prediction of the model. Finally, our model was validated using 10-fold cross-validation and was not validated on an additional external database. Further prospective studies are needed to evaluate the clinical utility of the model.
In conclusion, we present a novel ANN model for prediction of glucose levels in T1DM patients. Our model, optimized for clinical accuracy, was able to predict glucose levels better than the currently used algorithms. Accurate prediction of glucose levels is likely to improve treatment decisions and pave the way for improved outcomes in T1DM patients.
Footnotes
Acknowledgments
The authors thank other members of the Department of Computer Science and Applied Mathematics, Weizmann Institute of Science, Rehovot, Israel, for useful discussions.
Authors' Contributions
Y.A., S.S., and T.O. conceived the project, designed and conducted the analyses, interpreted the results, wrote the manuscript, and are listed in random order. E.A. contributed to the analysis. M.P. and. E.S. conceived and directed the project and analyses, designed the analyses, interpreted the results, and wrote the manuscript. E.S. is the guarantor of this work and, as such, had full access to all the data in the study and takes responsibility for the integrity of data and accuracy of the data analysis.
Author Disclosure Statement
No competing financial interests exist.
Funding Information
The study was funded through a European Foundation for the Study of Diabetes (EFSD) award supported by EFSD/Novo Nordisk (94837). The funder had no influence on the results of the study. E.S. is supported by the Crown Human Genome Center; D.L. Schwarz; J.N. Halpern; L. Steinberg; and grants funded by the European Research Council and the Israel Science Foundation.
Supplementary Material
Supplementary Data
References
Supplementary Material
Please find the following supplemental material available below.
For Open Access articles published under a Creative Commons License, all supplemental material carries the same license as the article it is associated with.
For non-Open Access articles published, all supplemental material carries a non-exclusive license, and permission requests for re-use of supplemental material or any part of supplemental material shall be sent directly to the copyright owner as specified in the copyright notice associated with the article.