
Abstract
Background:
Examine the expected relationships between time in range (%TIR), time above range (%TAR), and time below range (%TBR) with median glucose (or %HbA1c) and %coefficient of variation (%CV) of glucose for various shapes of the glucose distribution.
Methods:
We considered several thresholds defining hypoglycemia and hyperglycemia and examined wide ranges of median glucose and %CV using three models for the glucose distribution: gaussian, log-gaussian, and a modified log-gaussian distribution.
Results:
There is a linear relationship between %TIR and median glucose for any specified %CV when median glucose is well removed from the threshold for hypoglycemia. %TIR reaches a peak when median glucose is close to 120 mg/dL and declines both at higher and lower median glucose values. There is a nearly linear relationship for %TAR and median glucose for a wider range of glucose (80–220 mg/dL). Risk of hypoglycemia is minimal when %CV is below 20%, but rises exponentially as %CV increases or as median glucose decreases. Similar results were obtained for a wide range of possible shapes of glucose distribution. These simulations are consistent with results from clinical studies.
Conclusion:
Both %TIR and %TAR are approximately linearly related to mean and median glucose (or %HbA1c). %TAR provides linearity over a wider range than %TIR. Risk of hypoglycemia (%TBR) is critically dependent on both glycemic variability (%CV) and mean or median glucose. These relationships support the use of %TIR, %TAR, and %TBR as metrics of quality of glycemic control for clinical, research, and regulatory purposes.
Introduction
Background
Clinical studies have demonstrated a linear relationship between %time in range (%TIR) and %time above range (%TAR) and mean glucose or HbA1c. 1,2 The %time below range (%TBR) has previously been shown to be strongly dependent on the coefficient of variation (%CV) for glucose with minimal risk of hypoglycemia when %CV is less than 20%. 3 The author has previously proposed use of three models of glucose distribution (gaussian, log-gaussian, and a modified log-gaussian) to predict %TIR, %TAR, and %TBR on the basis of mean glucose and %CV. 3 This study was undertaken to evaluate these relationships in more detail, to improve our understanding of their validity and justifiability in view of a progressive groundswell of opinion that %TIR, %TAR, and %TBR should be used as three of the most important indices of quality of glycemic control for clinical, research, and regulatory purposes. 4 –6
In this study, we have sought to address the following questions: Is there a theoretical basis for the empirically observed linear relationship between %TIR and mean or median glucose for the empirically observed specified levels of glycemic variability (standard deviation [SD] or %CV)? Is there a theoretical basis for a linear relationship between %TAR and mean or median glucose level for specified levels of glycemic variability (SD or %CV)? Is there a theoretical basis for the empirical relationships between %TBR and mean or median glucose and with glycemic variability (SD or %CV of glucose)? Can one evaluate the relative importance of mean glucose and glycemic variability as risk factors for hypoglycemia below any specified threshold? How do the answers to questions 1–3 above depend on the nature of the glucose distribution for a specified individual (symmetrical, e.g., gaussian; asymmetrical, e.g., log-gaussian) and on the parameters (thresholds for hypoglycemia and hyperglycemia, mean and median glucose, SD, or %CV for glucose). When seeking a single metric for quality of glycemic control, would it be preferable to use %TIR or %TAR? Is it desirable or necessary to combine two metrics (%TIR or %TAR together with %TBR) to construct a clinically meaningful metric of quality of glycemic control? Is it desirable or necessary to combine the information from all three times in ranges, %TIR, %TBR, and %TAR? Are the properties of the theoretically predicted relationships (e.g., slopes of %TIR or %TAR vs. median glucose) consistent with empirical findings? Is it preferable to express glycemic variability in terms of SD or %CV? What is the effect of increasing glycemic variability [%CV for glucose or SD for log(Glucose)] on the asymmetry of the glucose distribution, if one assumes glucose follows a log-gaussian distribution and log(Glucose) follows a gaussian distribution? Why is there often a large degree of uncertainty in the estimates of the slopes for %TIR or %TAR versus median glucose even when using large datasets?
1,2
Summary of findings
To assist the reader, we provide here a concise overview of the principal findings: (1) the relationships between %TIR, %TAR, and %TBR with mean or median glucose, or HbA1c can be predicted mathematically, based on an assumption regarding the shape of the glucose distribution for each subject, the mean or median glucose, and glycemic variability expressed either in terms of SD or %CV for glucose. (2) The relationship between %TIR and median glucose is predicted to be approximately linear for median glucose levels above 120 mg/dL. However, there is a distinct peak for %TIR when median glucose is ∼120 mg/dL; %TIR then decreases for median glucose values below 120 mg/dL, creating marked nonlinearity. (3) In contrast, the relationship of %TAR and median glucose can be approximated by a linear relationship over a much wider range (80–250 mg/dL) and does not show a peak. Thus, %TAR may be superior to %TIR as a measure of overall glycemic control if forced to use a single metric based on time within one range. (4) %TBR also depends both on median glucose and %CV, rapidly increasing with increasing %CV or as median glucose approaches the lower limit of the target range. One can calculate multiple combinations of median glucose and %CV that result in any specified risk of %TBR. (5) Similar results were obtained based on assumptions of a gaussian, log-gaussian, or modified log gaussian distribution. (6) The slopes of %TIR and %TAR versus mean glucose observed in clinical studies 1,2 are consistent with the mathematically predicted properties obtained in these studies. The empirically derived slopes are subject to large errors related to the statistical methods used to estimate the least-squares linear regression due to the presence of significant variability and random errors in %TIR (or %TAR) and mean glucose, especially when combining data from multiple subjects. (7) An asymmetrical log-gaussian description for glucose is usually superior to a perfectly symmetrical gaussian distribution. A modified log-gaussian distribution can provide good approximations as the distribution morphs from log-gaussian to gaussian. The %CV of glucose corresponds closely to the SD of log(Glucose) and may be a more appropriate measure of glycemic variability than SD of glucose. (8) A composite index of parameters, including both %TIR (or mean glucose, or HbA1c) and %TBR, is superior to use of %TIR alone as an index of quality of glycemic control so that one can assign a greater influence to hypoglycemia than to hyperglycemia.
Methods
Models of the glucose distribution
We examined three cases of special interest in detail: (1) gaussian, (2) log-gaussian, and (3) a modified log-gaussian distribution.
In the gaussian model, glucose values follow a smooth symmetrical bell-shaped gaussian distribution, a so-called “normal distribution” (Fig. 1A, B). The SD of the distribution can be regarded as constant (Fig. 1A) or as dependent on the mean glucose, for example, a constant %CV such that SD is proportional to mean glucose (Fig. 1B). Schematic representation of glucose distributions with a systematically changing median glucose. The percentage of glucose values within a specified range (below, within, or above a specified target range) changes systematically as median glucose changes for given shape or model of the glucose distributions. Glucose is shown on the horizontal axis on a linear scale. 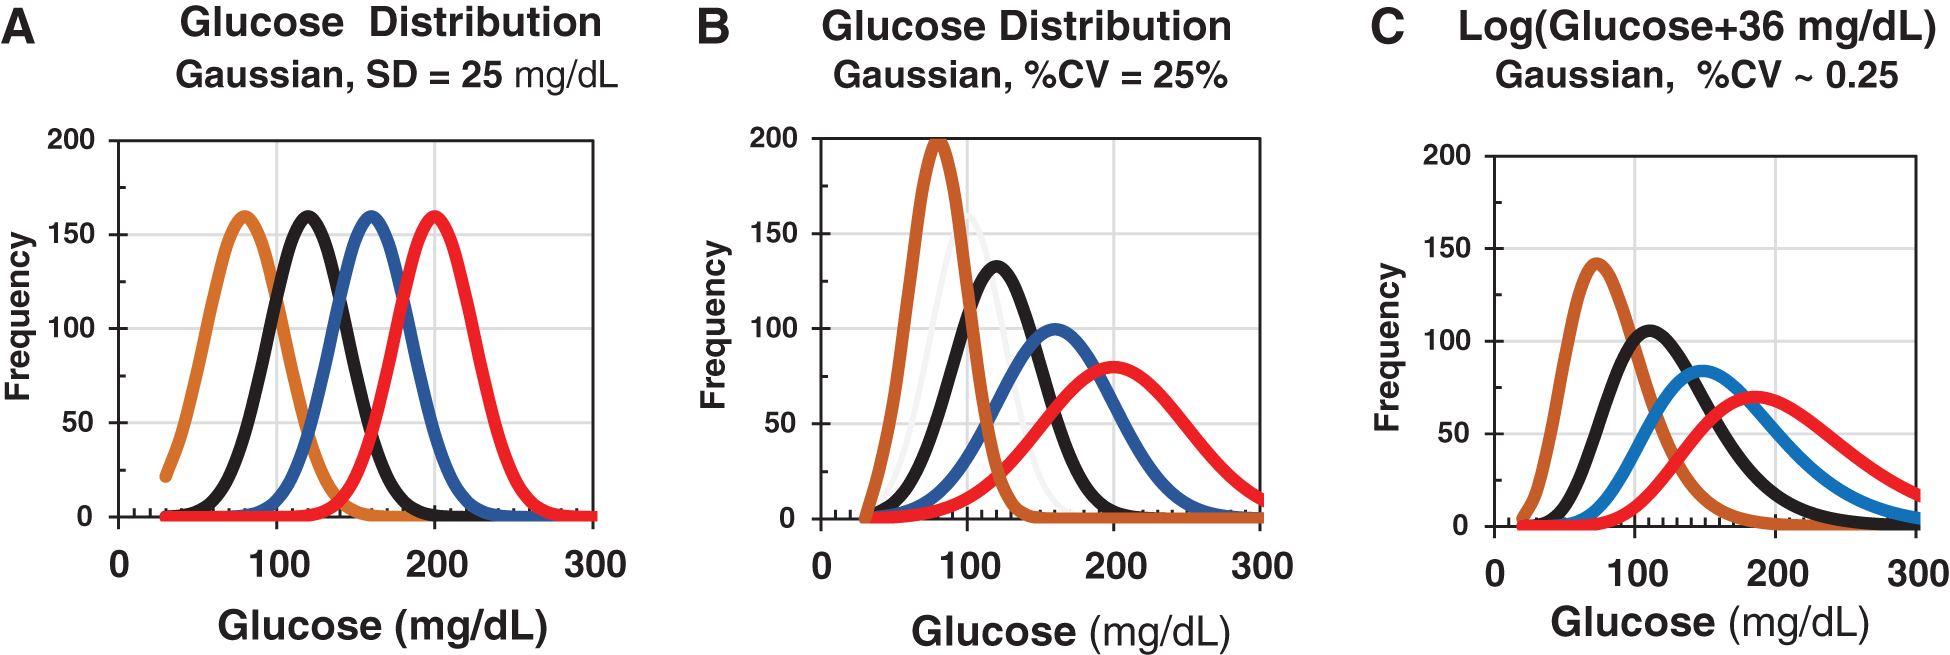
When glucose follows a log-gaussian distribution, the logarithm of glucose follows a gaussian distribution (Fig. 1C). A constant SD for log(Glucose) (Fig. 1C) corresponds very closely to the case when %CV for glucose is constant (Fig. 1B).
The modified log-gaussian model assumes that log(Glucose + c) will obey a nearly symmetrical gaussian distribution for some optimal value of a constant, c. 3
The glucose distribution is usually intermediate in shape between the gaussian distribution (Figs. 1A, B) and a log-gaussian distribution (Fig. 1C) (refs. 3,7 and Rodbard, unpublished data). The distribution of glucose is almost always markedly asymmetrical and skewed to the right (positive skew). 8 In contrast, the distribution of log(Glucose) is usually slightly asymmetrical and moderately skewed to the left (negative skew) (refs. 3,7 and Rodbard, unpublished observations), indicating that the application of a logarithmic transformation to glucose values results in an overcorrection for the positive skew. Accordingly, we have also examined a “modified log-gaussian transformation” obtained by applying the log transformation after having added a constant value, c, to each glucose value. One can explore a wide range of values for c to identify the value that results in the most nearly symmetrical distribution with skew ∼0.0. 3,8 Ideally, another measure of the shape of the distribution, kurtosis, would also be consistent with a gaussian distribution. 9 For a gaussian distribution, kurtosis has an expected value of 3.0, and excess kurtosis = (kurtosis – 3) (designated as kurt in Excel) is expected to be 0.0. One can apply a variety of tests to evaluate whether “gaussianness” has been achieved, enabling us to optimize the value for the constant c. These include t-tests for skew and for kurtosis, an F test for skew and kurtosis considered simultaneously, and the Wilk-Shapiro test, among many others.
Calculations
We utilized Microsoft Excel to calculate the expected or predicted %TIR, %TAR, and %TBR for any specified threshold for glucose defining the percentages of time spent in ten ranges 4 : the target range (63–140 mg/dL [for pregnancy] or 70–180 mg/dL [nonpregnant]), hyperglycemia (>140 mg/dL [for pregnancy], >180 mg/dL [for hyperglycemia levels 1 and 2 combined], >180–250 mg/dL [level 1], and >250 mg/dL [level 2]), and hypoglycemia (<54 mg/dL [level 2], <63 mg/dL [for pregnancy], 54-< 70 mg/dL [level 1 hypoglycemia], and <70 mg/dL [hypoglycemia levels 1 and 2 combined]). We examined glucose distributions using 18 values for median glucose ranging from 70 to 250 mg/dL in increments of 10 mg/dL combined with seven values for glycemic variability with %CV ranging from 20% to 50% in increments of 5%, using statistical functions available in Microsoft EXCEL (NORMDIST, NORMDIST.INV, LOGNORM, and LOGNORM.INV).
Selection of parameters
For most people with diabetes utilizing insulin therapy, the %CV for glucose usually ranges between 20% and 50%. 10 –16 We specified various combinations of median glucose and SD, SD{log e (Glucose)}, and %CV. We then examined relationships of %TIR and %TAR versus median glucose and versus %HbA1c for specified values of SD or %CV of glucose and for the several options for limits of target, hypoglycemia and hyperglycemia ranges. 4 We calculated the average slope of the curves when median glucose is in the range between 120 and 160 mg/dL for the curves corresponding to %CV ranging from 25% to 40% to permit comparison with values reported from clinical studies using continuous glucose monitoring (CGM). 1,2 We also examined the relationships of %TBR versus %CV and versus median glucose for the three types of glucose distributions.
Asymmetry of the glucose distribution
We examined the extent to which increasing glycemic variability (%CV) affects the symmetry of a log-gaussian glucose distribution using criteria for asymmetry such as skew 8 and estimates of the apparent SD at multiple glucose levels. 17 (cf. Supplementary Table S2).
Results
Graphical display of effects of mean or median glucose on time in ranges
Figure 1 shows a series of distributions for glucose with systematically changing mean and median glucose. As the distributions move from left to right, the mean and median glucose increase, and the percentage of observations in the target range (between the thresholds for hypoglycemia and hyperglycemia) is continuously changing. Figure 1A shows gaussian distributions with a fixed SD of 25 mg/dL. Figure 1B shows a gaussian distribution with a constant %CV of 25% so that SD is proportional to the mean. Figure 1C shows distributions that are log-gaussian 17 with a constant SD for log e (Glucose), which corresponds very closely to a gaussian distribution with a constant %CV of 25% for glucose (Fig. 1B).
Time in range versus median glucose or versus %HbA1c
We examined the predicted relationships for three types of the glucose distribution: gaussian (Fig. 2A), log-gaussian (Fig. 2B), and a modified log-gaussian distribution (Fig. 2C).

Relationship between %TIR (vertical axis) and median glucose (horizontal axis) as median glucose ranges from 70 to 250 mg/dL and %CV for glucose ranges from 20% to 50% (from above downward when median glucose is less than 180 mg/dL). There is a nearly linear relationship between %TIR and median glucose for glucose values ranging between 120 and 200 mg/dL. The presence of a peak or maximum for %TIR and the marked curvature in the relationship is due to a progressive reduction in %TIR as median glucose approaches the limit defining hypoglycemia (70 mg/dL in this example), such that an increasing percentage of glucose values will fall in the hypoglycemic range. %TIR reaches a maximum when median glucose is between 110 and 120 mg/dL; the exact location of the maximum is only minimally affected by %CV. The expected %HbA1c corresponding to any specified median glucose is shown on a parallel horizontal axis, below.
Gaussian distribution for glucose
If glucose follows a symmetrical bell-shaped gaussian distribution with a fixed %CV (Fig. 1B), then the mathematical relationships between %TIR (vertical axis) and mean or median glucose is shown in Figure 2A. When a curve for any specified %CV is viewed over the range 70 to 250 mg/dL, there is not a linear relationship. Instead, there is a peak—a maximum for %TIR when median glucose levels will fall progressively below 110 mg/dL such that a growing percentage of glucose values fall below the threshold defining hypoglycemia (70 mg/dL). However, when median glucose is in the range 120 to 200 mg/dL, the relationships show only slight curvilinearity. We calculated the average of the slopes for curves in this region for %CV ranging from 25% to 40% since most people with diabetes typically have a %CV in this range. 10 –16
In view of the well-documented relationships between mean or median glucose and %HbA1c, 18,19 the relationship between %TIR and mean or median glucose can also be viewed in terms of the corresponding relationship between %TIR and %HbA1c. The estimated %HbA1c, calculated using a popular equation relating %HbA1c to mean glucose, 18 is shown on a separate parallel horizontal axis in Figure 2A–C. The slope of glucose versus %HbA1c, (ΔGlucose/Δ%HbA1c), is usually taken as 28.7 mg/dL/(%HbA1c), 18 although another study reported the slope to be 24.4 mg/dL/%HbA1c. 19 Other studies have observed a slope of (23 mg/dL)/(%HbA1c) for a direct proportionality for a line forced through the origin with an intercept of zero (Rodbard, unpublished studies).
Log-gaussian distribution for glucose [Gaussian distribution for log(Glucose)]
If glucose follows a log-gaussian distribution such that the logarithm of glucose, log(Glucose), obeys a gaussian distribution, one obtains the relationship between %TIR and median glucose (or between %TIR and %HbA1c) shown in Figure 2B. The results resemble those observed for a symmetrical gaussian distribution (Fig. 2A): there is marked curvilinearity and a maximum or peak value for %TIR when mean or median glucose is ∼110 mg/dL and begins to approach the threshold defining hypoglycemia. However, there are fairly linear relationships when median glucose levels are in the range 120 to 200 mg/dL. A linear relationship of %TIR with median glucose implies a linear relationship of %TIR with %HbA1c. 18,19 The corresponding scale for %HbA1c is also shown.
Modified log-gaussian distribution corresponding to a gaussian distribution for log(Glucose + c)
Using a “modified log-gaussian distribution” where the logarithm of (Glucose + c) obeys a gaussian distribution, one obtains the results for %TIR versus median glucose and %TIR versus %HbA1c shown in Figure 2C. There is a distinct curvilinear relationship with a peak in %TIR when median glucose is in the range 110–120 mg/dL, but nearly linear relationships for %TIR versus median glucose and likewise for %TIR versus %HbA1c when median glucose is in the range 120–200 mg/dL. Thus, the biphasic relationship with a peak in predicted %TIR is rather insensitive to the shape of the underlying glucose distribution, but very sensitive to the magnitude of the %CV of glucose (Fig. 2A–C). We observed similar relationships for several other types of glucose distributions with very disparate shapes.
Time above range
%TAR versus median glucose
We next examined the relationships between %TAR versus median glucose and %TAR versus %HbA1c for the three types of glucose distribution considered in this study. %TAR is nearly linearly related to median glucose and %HbA1c (Fig. 3A–C) for all three types of glucose distributions—gaussian, log-gaussian, and modified log-gaussian. In contrast to %TIR versus median glucose (Fig. 2A–C), there is only a small degree of curvilinearity as median glucose begins to approach the threshold defining hypoglycemia (70 mg/dL). There is no peak in %TAR. The nearly linear relationships between %TAR versus median glucose (and vs. %HbA1c) (Fig. 3A–C) extend over a considerably wider range than in the case of %TIR versus median glucose or versus %HbA1c (compare panels A–C in Fig. 3 with the corresponding panels in Fig. 2). Accordingly, %TAR might prove to be more reliable than %TIR as an alternative to median glucose and %HbA1c as a measure of quality of glycemic control.

Predicted relationships of %TAR (vertical axis) versus median glucose or HbA1c (horizontal axes) for three types of the glucose frequency distributions, with %CV ranging from 20% to 50% for the observed glucose values. These relationships are continuously increasing without the maximum (peak) and curvature observed for the relationship between %TIR and median glucose (Fig. 2). A horizontal axis showing the scale for the %HbA1c is also shown, below.
Time below range
We examined the predicted relationship between %TBR using a threshold of 70 mg/dL and glycemic variability expressed as %CV of glucose based on a log-gaussian distribution. Risk of hypoglycemia depends on median glucose (or HbA1c) and on the %CV for glucose (Fig. 4). Risk of hypoglycemia below 70 mg/dL would be very small if %CV is small, for example, 5% or 10% even if median glucose were below 110 mg/dL (Fig. 4A). As %CV reaches 20% and above, %TBR rises exponentially (Fig. 4A). Thus, we can speak of a threshold value of 20% %CV 3 to see significant hypoglycemia, except under unusual circumstances, for example, if median glucose were below 90 mg/dL. When median glucose is above 110 mg/dL, %CV would need to exceed 15% to 20% to see any significant increase in risk of hypoglycemia (%TBR) (Fig. 4A).
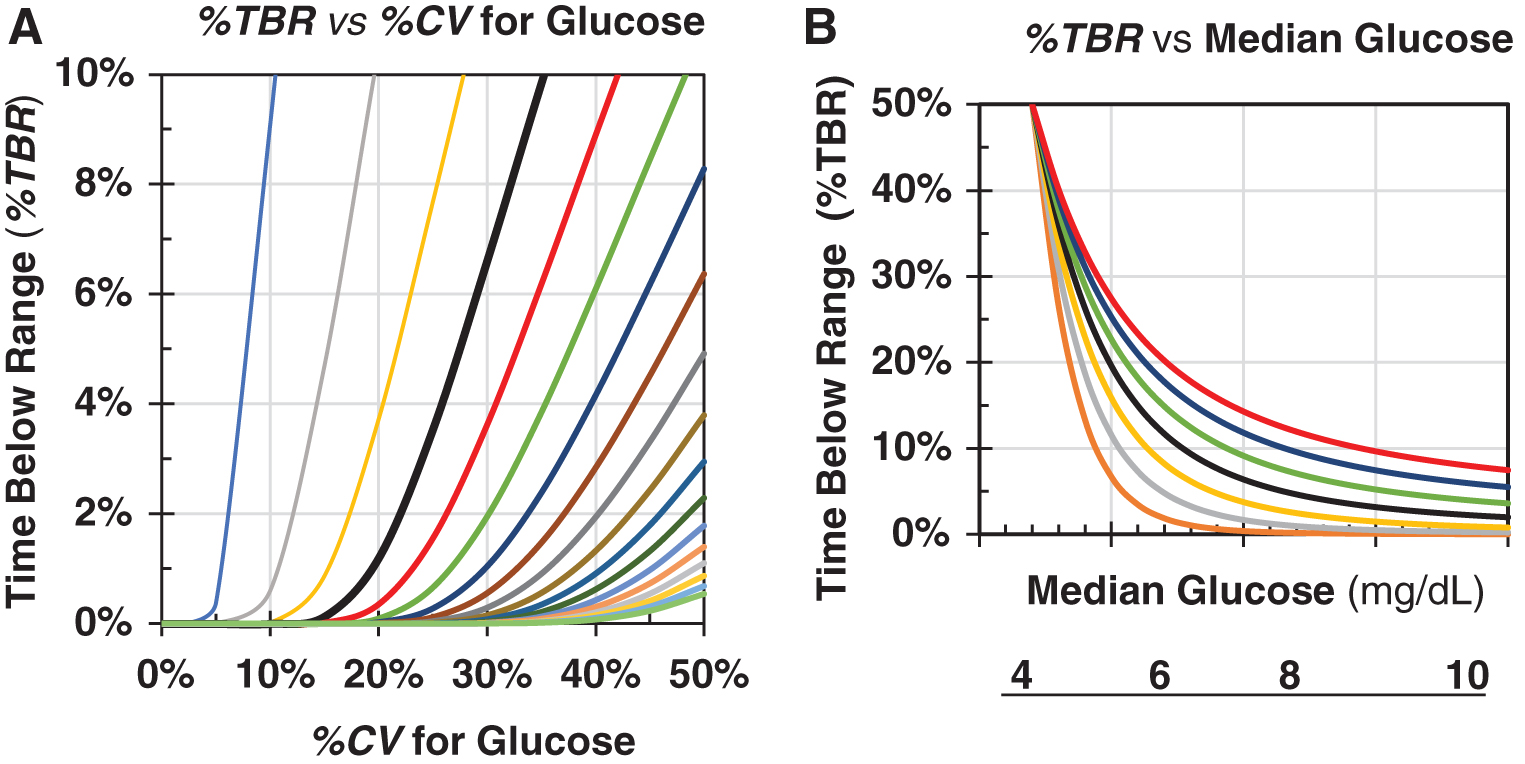
Relationship of %TBR using 70 mg/dL as the LLTR or threshold for hypoglycemia (vertical axis), and %CV (horizontal axis) for specified levels of median glucose
%TBR increases nearly exponentially when %CV increases or when median glucose decreases: A plot of %TBR on semilog paper, or equivalently, a plot of log(%TBR) initially increases nearly linearly with %CV and declines nearly linearly with median glucose (cf. Supplementary Fig. S1). One can calculate the combinations of %CV and median glucose that would be expected to result in any specified level of %TBR (cf. Supplementary Data). First, one specifies the nature of the glucose distribution (e.g., log-gaussian), the threshold for hypoglycemia (e.g., <54, <63, or <70 mg/dL), and the maximum clinically acceptable risk of hypoglycemia (e.g., 1%, 2%, and 4%). 3 One can then calculate the combinations of median glucose and %CV that would be expected to carry that risk of hypoglycemia (cf. Supplementary Data).
Slopes of the relationships between %TIR (or %TAR) and median glucose (or %HbA1c)
We next compared the slopes of %TIR and of %TAR versus median glucose for a log-gaussian distribution with results reported in clinical studies. 1,2 We calculated the average of the slopes of %TIR or %TAR versus median glucose or %HbA1c when median glucose is in the range between 120 and 200 mg/dL and as %CV ranges from 25% to 40% in steps of 5%. We then compared these slopes with results from previously reported clinical studies. 1,2 Results are shown in Supplementary Table S1. There was reasonable agreement between the simulations and the clinical studies considering the extent of experimental and analytical errors in the empirical data.
Discussion
Appropriate models for the glucose frequency distribution
The findings of this study apply directly to the three types of glucose distribution being considered here: all three models predict that (1) there would be a nearly linear relationship between %TIR versus median glucose (or vs. %HbA1c) as glucose ranges from 120 to 200 mg/dL (Fig. 2A–C); (2) a distinctly nonlinear biphasic relationship for %TIR versus median glucose when the latter falls below 120 mg/dL (Fig. 2A–C); and (3) a nearly linear relationship between %TAR versus median glucose over a much wider range, from 80 to 250 mg/dL (Fig. 3A–C); and (4) %TBR is strongly dependent on both median glucose and %CV: %TBR increases nearly exponentially with %CV for any specified level of mean or median glucose (Fig. 4A), and nearly exponentially as median glucose is reduced for any specified level of %CV (Fig. 4B).
The log-gaussian model and the related modified log-gaussian models appear to be more realistic than a simple gaussian model, especially in terms of understanding the relationships of %TBR versus %CV or versus median glucose because these models can provide an adjustable degree of asymmetry of the glucose distribution.
Choice of parameters for models
We have examined values for median glucose ranging from 80 to 250 mg/dL, and %CV ranging from 20% to 50%. These values appear to be appropriate for people with diabetes. 1,10 –16,18–20 If these parameters were far outside this range, for example, if SD of glucose were 10 mg/dL or if %CV were 5% or 10%, then the relationships shown in Figures 2–4 of this study would be dramatically different. For example, if %CV were 5%, then %TIR would be 100%, the highest possible value, when median glucose was between 90 and 160 mg/dL, while %TAR and %TBR would be negligible throughout that range of glucose. Thus, the %CV for glucose commonly observed for people with diabetes 10 –16 is one of the major factors controlling the shape and slopes of the relationships shown in Figures 1–4.
%TAR may be a better metric for “quality of glycemic control” than %TIR
No one has yet called attention to the fact that %TIR is expected to reach a maximum when median glucose falls below 120 mg/dL for all three models when using the multiple (126 = 7 × 18) combinations of %CV and median glucose examined in this study (Fig. 2). This is understandable since such a low median glucose is rarely observed in clinical practice and it would correspond to a calculated %HbA1c value less than 5%. The presence of marked curvature for %TIR versus median glucose (Fig. 2A–C) implies that %TAR (Fig. 3A–C) could be better suited as a measure of quality of glycemic control than %TIR. %TAR is very highly negatively correlated with %TIR: correlations are often −0.90 to −0.95, so that changes in %TIR and changes in %TAR are essentially interchangeable. 15,16,21 Although %TIR can reflect the effects of both hypoglycemia and hyperglycemia, the effects of hypoglycemia (typically less than 5%) are so overwhelmed by the much larger numerical value (typically 20%–50%), especially in view of large temporal fluctuations of %TAR, such that %TIR fails to provide useful information regarding %TBR. 21
All measures of quality of glycemic control proposed to date 21 –32 place considerably greater weight or influence on hypoglycemia than on hyperglycemia to obtain a balanced view of quality of glycemic control. 7,21,22 In contrast, use of %TIR implicitly assigns equal weight or influence to both hypoglycemia and hyperglycemia.
%CV: a major factor determining %TBR
This study provides an improved understanding of the relative importance of mean or median glucose and %CV as correlates or predictors of hypoglycemia—a topic that has remained controversial and confusing. 3,11 –16,21,22 As noted previously, if the nature of the glucose distribution is known or can be assumed, then one can calculate %TBR directly from mean or median glucose and the SD or %CV of glucose. 3 Likewise, one can examine the possible combinations of mean or median glucose and %CV of glucose that result in any specified %TBR for any specified threshold defining hypoglycemia (e.g., 54, 63, or 70 mg/dL). 3 Figure 4 shows that %TBR increases nearly exponentially as %CV increases (Fig. 4A) and as median glucose falls (Fig. 4B). If median glucose is greater than 120 mg/dL, as almost always the case clinically, then the predicted frequency of hypoglycemia remains negligible until %CV reaches or exceeds 20% (Fig. 4A) 3 (cf. Supplementary Fig. S1).
The present modeling approach enables one to predict all three “times in ranges” (%TIR, %TAR, and %TBR) from mean or median glucose and the %CV for glucose
This study utilizes median glucose. For a gaussian model (Figs. 1A, B, 2A, and 3A), the mean and median glucose should be identical aside from minor random sampling error. However, for the log-gaussian model, mean glucose will be significantly higher than the median glucose, and this discrepancy increases progressively as %CV and skew increase 17 (cf. Supplementary Table S2). The modified log-gaussian model is intermediate between the other two models in this respect.
Slope of %TIR and %TAR versus median glucose and HbA1c is consistent with reports based on clinical studies
The slopes of the relationships between %TIR or %TAR and median glucose or %HbA1c are consistent with the values reported in analyses of multiple clinical studies using CGM. 1,2 This lends additional credence to the applicability of the models used in this study. Unfortunately, there are large uncertainties in the empirically determined slopes 1,2,18,19 due to use of data from different patient populations, use of different study protocols and methodologies, and, finally, the arbitrary choice of dependent and independent variables in the presence of random and systematic errors in measurements of all four measurements (%TIR, %TAR, median glucose, and %HbA1c) (cf. Supplementary Data).
Asymmetry of the glucose distribution implies that the effective SD for glucose changes systematically with changes in glucose level
This asymmetry occurs when glucose follows a log-normal or modified log-normal distribution, which implies a positive skew for the distribution of glucose. The magnitude of the change in the effective local SD or dispersion is directly related to the %CV for glucose (Supplementary Table S2). 17 If the glucose distribution has a %CV of 30%, corresponding to skew of ∼+1.0, then the SD for glucose values below the median is about 1.2- to 1.5-fold smaller than the effective local SD at the corresponding glucose values at corresponding percentiles above the median (cf. Supplementary Table S2). This can be clinically important when evaluating the risks of hypoglycemia and hyperglycemia based on either blood or interstitial fluid glucose. This is one reason that the percentiles on the Ambulatory Glucose Profile displaying percentiles can be more informative and useful in clinical decision making than a display of the mean ± 1 SD or mean ± 2 SD. 33 –35
Need for additional studies to characterize the nature of the glucose distribution
The nature of the relationships shown in Figures 1–4 of this study depends on assumptions regarding the nature of the glucose distribution. Accordingly, it would be important to conduct additional studies to characterize the glucose distribution in more detail using data from multiple populations of subjects with a wide range of demographic characteristics, who are being treated with different forms of therapy and achieving different levels of quality of glycemic control. The log-gaussian and modified log-gaussian distribution appear to be suitable for the purposes of this study. There remains the possibility that different populations may have glucose distributions with clearly different shapes. It is currently unknown how the type and duration of diabetes, modalities of therapy, diet, physical activity, and exercise, other aspects of lifestyle, and quality of glycemic control achieved may affect the shapes of glucose distributions. If glucose distributions are found to be approximately log-gaussian or adequately described by a modified log-gaussian distribution, that would support the main conclusions of this study. If some subpopulations have distinctly different shapes for their glucose distributions, then additional models would need to be considered. However, it is likely that the key relationships observed in this study (Figs. 2–4) will be able to serve as useful approximations for a wide range of shapes and parameters for the underlying glucose distributions.
The simulation methods used in this study may also be used to address additional research questions
For example, what are the effects of random and systematic errors in the calibration of a CGM sensor, or of other errors in a CGM system, on the accuracy and precision of measurement of %TIR, %TAR, and %TBR, and of metrics of glycemic variability and quality of glycemic control? What are the relationships between times in ranges as studied here and the numerous metrics of quality of glycemic control that have been proposed and utilized previously? 21 –32
Conclusions
There is a predictable, nearly linear theoretical relationship between %TIR and median glucose, and between %TIR and %HbA1c when median glucose is in the limited range from 120 to 200 mg/dL (Fig. 2) with only modest effect of %CV. The predicted nearly linear relationship of %TAR and median glucose (and with %HbA1c) extends over a much wider range of median glucose and %HbA1c (Fig. 3) than the corresponding relationships for %TIR (Fig. 2). Accordingly, use of %TAR may be preferable to use of %TIR as an overall metric of quality of glycemic control, especially if median glucose were to fall below 120 mg/dL. %TBR is strongly dependent on both glycemic variability, usually measured in terms of %CV of glucose, and on median glucose. The slopes of the theoretically predicted relationships of %TIR or %TAR versus median glucose or %HbA1c are generally consistent with reports from multiple clinical studies. 1,2 In view of the consistently observed asymmetry and positive skew of the glucose distribution, the SD of glucose calculated for glucose values below the median is systematically smaller than the effective SD for higher glucose values, if the SDs are estimated using percentiles of the distribution while erroneously assuming a gaussian distribution. These theoretically predictable relationships among %TIR, %TAR, and %TBR, %HbA1c, mean glucose, median glucose, %CV, and SD strengthen the rationale for routine use of these “times in ranges” metrics for clinical, research, and regulatory purposes and enables us to identify caveats regarding their use.
Footnotes
Author Disclosure Statement
D.R. serves as a consultant to Eli Lilly & Co., and to Better Therapeutics.
Funding Information
This study was supported by the author and Biomedical Informatics Consultants LLC.
Supplementary Material
Supplementary Data
Supplementary Table S1
Supplementary Table S2
Supplementary Table S3
Supplementary Figure S1
References
Supplementary Material
Please find the following supplemental material available below.
For Open Access articles published under a Creative Commons License, all supplemental material carries the same license as the article it is associated with.
For non-Open Access articles published, all supplemental material carries a non-exclusive license, and permission requests for re-use of supplemental material or any part of supplemental material shall be sent directly to the copyright owner as specified in the copyright notice associated with the article.