




Abstract
Background:
Clinical remission of type 1 diabetes is not only associated with regeneration of beta cells and preserved insulin secretion but also with increased insulin sensitivity. The aim of the study was to determine the association between presence of remission in the first year of type 1 diabetes and insulin resistance at 7 years from diagnosis of the disease.
Material and Methods:
A total of 108 consecutive patients with newly diagnosed type 1 diabetes were followed prospectively. During the follow-up time, the onset and duration of clinical remission were registered. Seventy-four patients were included in the final analysis. Insulin sensitivity was assessed by the glucose disposal rate (GDR), determined using the hyperinsulinemic-euglycemic clamp, performed at 7 years from diagnosis of diabetes. Patients were divided into groups with GDR <4.5 mg/(kg·min) (G1-lower insulin sensitivity group) and GDR ≥4.5 mg/(kg·min) (G2-higher insulin sensitivity group).
Results:
Higher insulin sensitivity was observed in the remission group [GDR 6.2 interquartile range (IQR) 4.2–7.0 mg/(kg·min) vs. 3.8 (IQR 3.0–4.8) mg/(kg·min); P = 0.01]. Furthermore, in G2 group, the duration of remission was longer than in G1 group: (351 [IQR 206–561] days vs. 70 [IQR 0–289] days; P = 0.002). Also, the GDR value correlated positively with duration of remission (r = 0.42; P = 0.002). In the multivariate logistic regression model, including age, sex, body mass index at diagnosis, and presence of remission, the remission period was independently associated with a higher GDR value (odds ratio 10.88; 95% confidence interval: 1.70–69.50; P = 0.009].
Conclusions:
Patients with type 1 diabetes who entered remission at the beginning of the disease, despite its ending, have higher insulin sensitivity at 7 years after diagnosis of diabetes than nonremitters.
Highlights
Clinical remission of type 1 diabetes could influence on insulin sensitivity. Patients with type 1 diabetes who entered remission at the beginning of the disease, despite its ending, have higher insulin sensitivity at 7 years after diagnosis of diabetes than nonremitters.
Introduction
I
Improvement of residual insulin secretion shortly after exogenous insulin introduction is associated with the onset of remission of type 1 diabetes. Many publications have shown that patients who developed the remission period had higher insulin secretion. 2,9,10 The highest insulin secretion is observed in the third month of the disease, when the incidence of remission is also peaking. However, the increase in insulin secretion is not the only causative agent of diabetes remission. Improvement of insulin sensitivity could also play a role in this phenomenon.
The aim of the study was to determine the association between insulin sensitivity at 7 years from diagnosis of the disease and presence or absence of remission after the onset of type 1 diabetes.
Materials and Methods
We followed prospectively 108 consecutive patients (34 women and 76 men), hospitalized due to newly diagnosed type 1 diabetes in the Department of Internal Medicine and Diabetology in 2004–2007.
Inclusion criteria were as follows: (1) age of 18–35 years, (2) new diagnose of type 1 diabetes according to American Diabetes Association (ADA) 1997 criteria (3) patient education in intensive functional insulin therapy at the time of diagnosis, (4) patient consent to participate in the study, and (5) presence of antibodies against glutamic acid decarboxylase (anti-GAD65) or islet cell antibodies or tyrosine phosphatase (IA2) autoantibodies. 11
Exclusion criteria were as follows: (1) laboratory signs of liver damage: alanine and aspartate aminotransferase higher than double the upper limit of normal rates and (2) acute inflammation (white blood cell count >15 × 109/L, serum high-sensitivity C-reactive protein concentration (hsCRP) >10 mg/L, and erythrocyte sedimentation rate >30 mm/1 h). 11
The study was approved by the Bioethics Committee of the Poznan University of Medical Sciences. All patients participating in the study were informed of its aim and they gave their written consent.
Follow-up period and study group
In the follow-up, the time of onset and duration of diabetes remission was registered. Partial remission of type 1 diabetes was defined as simultaneous fulfillment of the following conditions: (1) daily dose of exogenous insulin less than or equal to 0.3 U/kg body weight, (2) a random serum C-peptide concentration above 0.5 ng/mL, and (3) HbA1c value below 6.5% (48 mmol/mol). Presence of remission was determined at 3 months following diagnosis and quarterly thereafter. According to presence of remission at 3 months, patients were divided into two groups with partial remission (remitters) and without remission (nonremitters). The time-point half-way between a visit, in which the patient met the criteria for remission and the next visit when a patient no longer met the criteria, was considered as the end of remission. Even if the patient did not meet the remission criteria during observation, he was followed up in regular 3-month visits. 11
Due to exclusion criteria, nine patients were excluded from the study (three patients due to high liver enzymes, six patients because of acute inflammation,). Ultimately, 99 patients were prospectively observed. From that group, 80 patients completed observation. Of these, six patients were still in remission at 7 years of follow-up and were excluded from the insulin sensitivity measurement. Finally, 74 patients underwent assessment of insulin sensitivity with the hyperinsulinemic-euglycemic clamp technique and were included in the analysis.
Laboratory testing
The same assays have been used for laboratory assessments throughout the study period. Venous plasma glucose was determined using amperometric enzymatic measurement (EBIO compact; Eppendorf). Stimulated C-peptide secretion was assessed in response to a standard mixed-meal tolerance test, and was determined using an autoimmunoenzymatic method (IMMULITE; DPC, Los Angeles, CA; normal range: 1.1–5.0 ng/mL). HbA1c was determined using high-performance liquid chromatography (normal reference range 4.1–6.4% [21–46 mmol/mL]).
The turbidimetric immunoassay method (Roche/Hitachi, Cobas, normal range below 5.0 mg/L) was used to measure high-sensitivity C-reactive protein (hs-CRP). After an overnight fast, serum cholesterol, low-density lipoprotein (LDL) cholesterol, high-density lipoprotein (HDL) cholesterol, and triglycerides were measured using the enzymatic method (BioMerieux, Lyon, France).
Indirect immunofluorescence tests on cryostat sections of human pancreas of the donor with blood group O was used to detect islet cell antibodies. Antibody titers were determined by sera dilution and expressed as Juvenile Diabetes Foundation (JDF) units based on a reference sample of 80 JDF. Positivity was defined as >5 JDF units. Antibodies to tyrosine phosphatase-like antigen (IA2-Ab), and the autoantibodies against glutamic acid decarboxylase (anti-GAD) were measured by commercial enzyme-linked immunosorbent assay kits, anti-IA2 assay (IgG) (positivity: >20 U/mL), and anti-GAD assay (IgG) (positivity: >10 U/mL), respectively (EUROIMMUN GmbH, Lubeck, Germany). Autoantibody analysis was performed at the Immunopathology Laboratory at the Department of Pediatrics, Medical University of Lodz, Poland, which is a reference laboratory for the measurement of islet antibodies. 11
Hyperinsulinemic-euglycemic clamp
Insulin sensitivity was assessed at 7 years from diagnosis of diabetes using the hyperinsulinemic-euglycemic clamp technique with measurement of the glucose disposal rate (GDR). The test was conducted in the morning, after a 12 h period without calorie intake. During the clamp procedure, to achieve hyperinsulinemia, insulin was administered in intravenous infusion, at a rate of 0.06 U/(kg body weight·h). Variable of 20% dextrose infusion [with an initial dose of 2 mg/(kg body weight·min)] was used. We adjusted infusion rate every 5 min according to the plasma glucose level to maintain target glucose level (90–99 mg/dL). The tissue sensitivity to insulin (GDR) was determined as the rate of glucose infusion during the last 30 min of the test, after obtaining stable glucose values. We excluded patients without documented hyperinsulinemia or with hypoglycemia during the procedure from the analysis. The duration of the procedure was 3–4 h.
The cutoff point of GDR used in the analysis was 4.5 mg/(kg·min), and it was calculated from the median GDR of the study group. We divided patients into groups with GDR <4.5 mg/(kg·min) (G1 group-lower insulin sensitivity) and GDR ≥4.5 mg/(kg·min) (G2 group-higher insulin sensitivity) and also groups with and without presence of remission.
Questionnaire
We used a self-report questionnaire considering physical activity and smoking status. We defined patients as physically active when they did a moderate-intensity aerobic physical activity for at least 150 min throughout the week or at least 75 min of vigorous-intensity aerobic physical activity throughout the week. 12
Statistical analysis
Statistical analysis of results was performed using Statistica PL v. 10.0 software (StatSoft, Tulsa, CA). We designed the study to have 80% power to protect a 120-day difference in remission duration between groups G1 and G2. Given 1:1 subgroup size ratio and alpha set at 0.05, the required sample size was 74. Allowing a drop-out rate of 20%, the required number of screened patients was 90.
Kolmogorov–Smirnov test with Lilliefors correction was used to analyze the normal distribution of data. Nonparametric tests were used for further analyses because analyzed parameters did not have a normal distribution. Results were presented, as numbers and percentages as well as medians and interquartile ranges (IQR). Mann–Whitney test was used to analyze differences between subgroups for numerical variables. χ 2 test and, for small sample size, Fisher's exact test were used for qualitative data. Spearman correlation was used to evaluate the association between the GDR value and selected parameters. Univariate logistic regression and the multivariate regression method were used to analyze the correlation between selected parameters and presence of remission with the GDR value (as a dependent variable). P < 0.05 was considered statistically significant. In logistic regression, we used Nagelkerke pseudo R 2 to describe the goodness-of-fit of the model.
Results
The group consisted of 74 patients, including 24 women and 50 men, with median age of 32 (IQR 29–38) years and median diabetes duration of 7.0 (IQR 6.7–8.0) years (which was equal to the observation time).
Remission occurred in 46 patients (62% of the study group). Clinical characteristics of the study group at the beginning of follow-up are shown in Tables 1 and 2.
Clinical Characteristics of the Study Group
Data at 7 years if not stated otherwise. Median (interquartile range), n (%).
BMI, body mass index; FPG, fasting glycemia; GDR, glucose disposal rate; GFR, glomerular filtration rate estimated using Modification of Diet in Renal Disease (MDRD) study equation; HbA1c, glycated hemoglobin; HDL, high-density lipoproteins; LDL, low-density lipoproteins; PPG, 2-h postprandial glycemia; TCH, total cholesterol; TG, triglycerides.
Comparison of Groups With and Without Remission (Mann–Whitney, χ 2 or Fisher's Exact Test): Data at Diagnosis of Diabetes
hsCRP, high-sensitivity C-reactive protein.
In the study group, the GDR value <4.5 mg/(kg·min), denoting low insulin sensitivity, was observed in 31% of patients. In 69% of patients higher insulin sensitivity was noticed.
Comparison of GDR between groups with and without remission showed higher insulin sensitivity in the remission group [GDR 6.2 (IQR 4.2–7.0) mg/(kg·min) vs. 3.8 (IQR 3.0–4.8) mg/(kg·min); P = 0.01] (Table 3). Furthermore, in the higher insulin sensitive group, the duration of remission was longer than in the lower insulin sensitivity group: [351 (IQR 206–561) days vs. 70 (IQR 0–289) days; P = 0.002] (Table 4).
Comparison of Groups With and Without Remission (Mann–Whitney, χ 2 or Fisher's Exact Test)
Comparison of Groups with Lower Insulin Sensitivity and Higher Insulin Sensitivity (Mann–Whitney, χ 2 or Fisher's Exact Test)
Correlation of duration of remission and C-peptide after mixed meal was observed (r = 0.29; P = 0.02; Fig. 1).
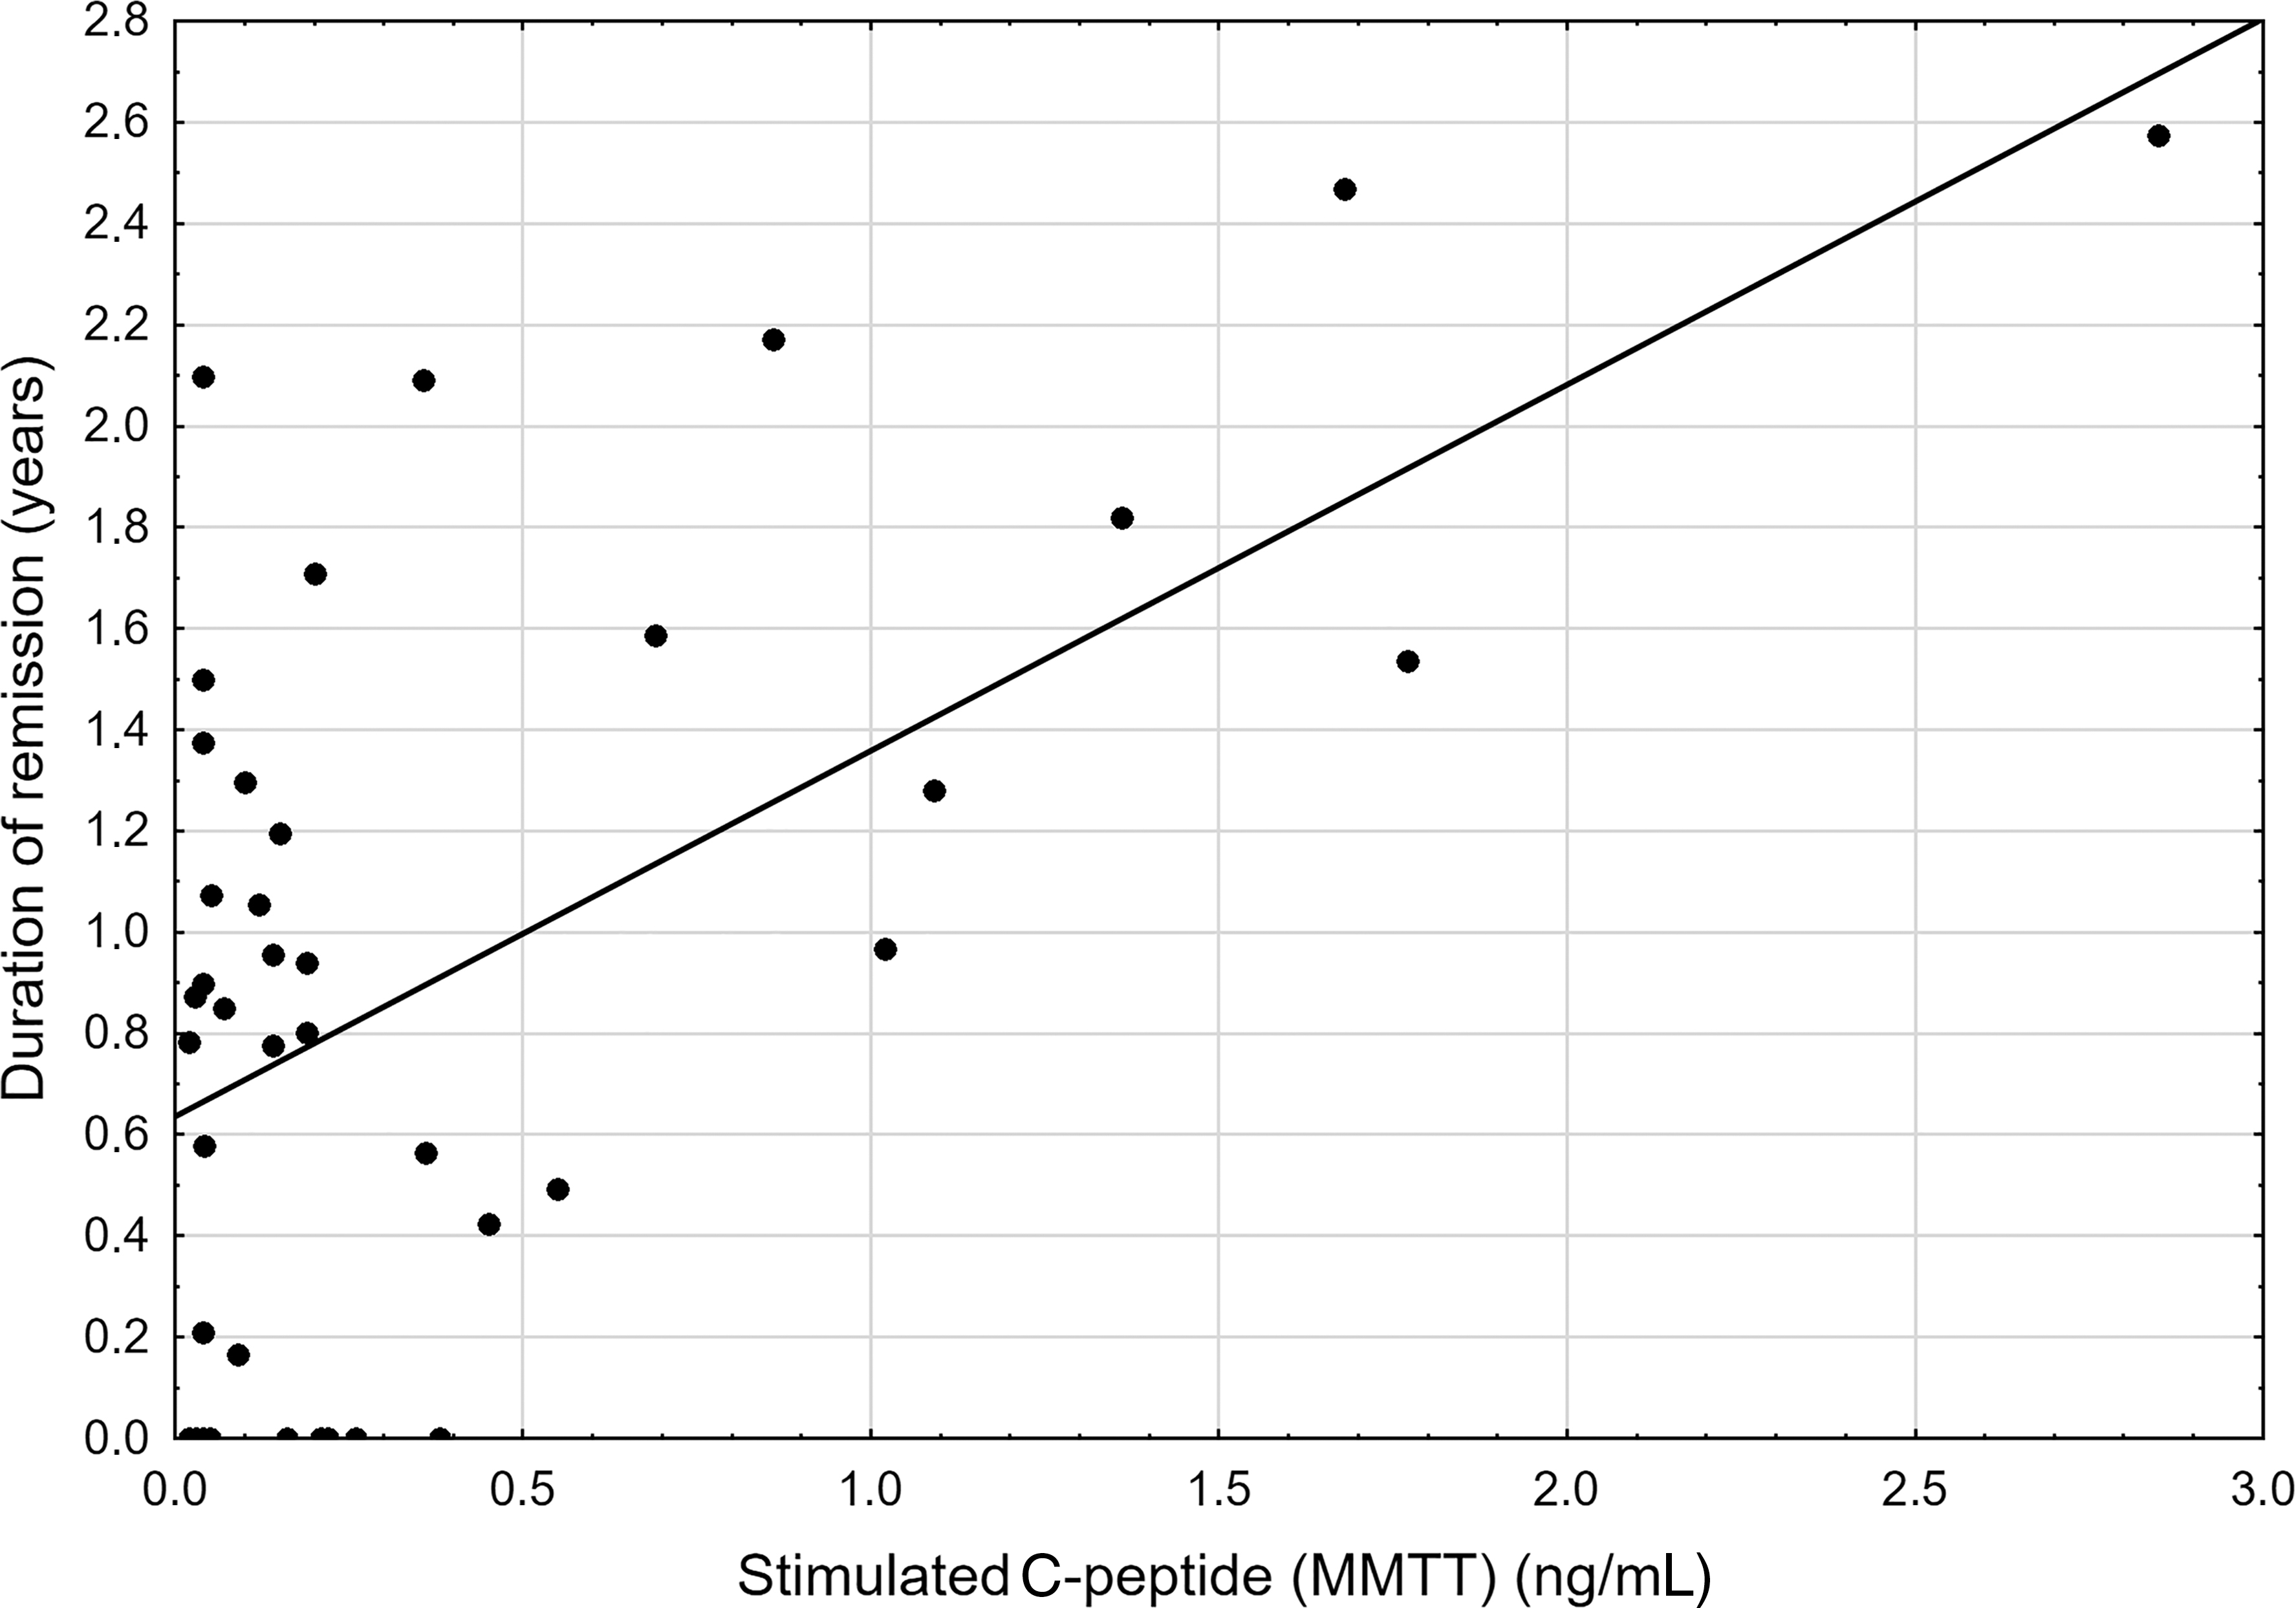
Correlation of the C-peptide level and duration of remission. MMTT, mixed-meal tolerance test.
In correlation analysis, the GDR value correlated positively with duration of remission (r = 0.42; P = 0.002) (Table 5 and Fig. 2). We also noted a significant correlation between GDR and body mass index (BMI) (r = −0.30; P = 0.03) and between GDR and smoking pack-years (r = −0.59; P = 0.01) (Table 5).

Correlation of the GDR value and duration of remission. GDR, glucose disposal rate.
Correlation Between the Glucose Disposal Rate Value and Selected Parameters (Spearman's Rank Order Correlation)
Correlation between the GDR value and other parameters such as age, duration of diabetes, daily insulin dose, HbA1c, total cholesterol, HDL cholesterol, LDL cholesterol, and triglycerides did not reveal any differences (Table 5).
We perform univariate logistic regression with selected parameters and GDR value as dependent variable [above or below <4.5 mg/(kg·min)]. Occurrence and duration of remission were associated with higher GDR value (Supplementary Table S1).
To analyze an association between the remission period and GDR, we used multivariate logistic regression. We checked the parameters analyzed at diagnosis of diabetes (age, sex, and BMI) and presence of remission, with GDR value as dependent variable [above or below <4.5 mg/(kg·min)]. We notice that occurrence of remission was independently associated with higher GDR value checked after 7 years after diagnosis (odds ratio 10.88; 95% confidence interval: 1.70–69.5; P = 0.009) (Table 6).
Influence of Selected Parameters from Diagnosis and Occurrence of Remission on High-Value Glucose Disposal Rate [Above 4.5 mg/(kg·min)] Checked After 7 Years from Diagnosis
Multivariate logistic regression model, P = 0.01; Nagelkerke pseudo-R 2 of model = 0.314.
Discussion
The loss of β-cells which is the net effects of destruction and regeneration characterizes type 1 diabetes. The onset of disease may involve a rapidly accelerating cycle, in which due to inflammatory mediators, loss of β-cell function is observed. Modest hyperglycemia is a result of reduced β-cell mass after autoimmune destruction, which could increase the demands of the residual β-cells to produce insulin. Several types of β-cells after developing diabetes could be observed: dead, proliferating, degranulated and recovered β-cells and the overall of its proportion, influence the progression of type 1 diabetes, and development of remission. 13
Not only the β-cell functions play a role in the progression of the disease but also in the insulin resistance, which is important. It should be emphasized that even in nonobese patients with type 1 diabetes, insulin resistance is noted. 14 In several studies, the conception of double-diabetes in type 1 diabetes was proven. 14 –16
Partial clinical remission of type 1 diabetes is connected with improved insulin secretion and insulin sensitivity. A significant effect of insulin resistance on the course of type 1 diabetes is well documented. 15,17,18 Pacud demonstrated that insulin resistance, measured by the euglycemic clamp technique, is present in newly diagnosed patients with type 1 diabetes and correlates with higher HbA1c at diagnosis. 19 Hramiak et al. revealed that after the remission period, insulin resistance was rising. 3 In a study by Szadkowska et al., children and adolescents with type 1 diabetes mellitus demonstrated various degrees of insulin sensitivity, which was associated with sex, age, amount of adipose tissue and glycemic control. 20 Higher insulin sensitivity was connected with the remission period. Not unexpectedly, the current presence of remission was connected with higher insulin sensitivity. 21 Therefore, in the present study, current remitters were not included in the analysis.
The above-mentioned data prove that the remission period is related to improved insulin sensitivity. However, it is unclear how the presence of remission influences a later course of the disease and why patients after remission still demonstrate good insulin sensitivity.
In previous studies, we demonstrated factors that could impact occurrence and duration of remission. Some of them, like cigarette smoking, not only decrease the odds of entering remission 22 but also increase insulin resistance. 23 Cigarette smoking, both at the diagnosis of the disease and in the long-term observation, decreases the chances of remission and shortens its duration. The longer the history of smoking the shorter the remission and higher the insulin resistance. The effect of physical activity seems to be opposite to the effect of smoking. Physical activity prolongs duration of the remission period and decreases insulin resistance. In our previous studies, patients with the longest remission periods were physically active. 24 Therefore, factors influencing occurrence of remission may also influence insulin sensitivity, probably also after the end of the remission period.
In the discussion on factors that could impact insulin resistance, we should also look at the period directly following the diagnosis of diabetes and the “metabolic memory” phenomenon. Production of reactive oxygen species, related to the presence of hyperglycemia, connected with overexpression of RAGE 25 and glycation of mitochondrial proteins may result in an altered gene expression, which may persist even after glycemia is normalized. We know that proper early treatment aiming to improve metabolic control could promote the remission period and probably its duration. This mechanism could also be connected with better insulin sensitivity.
Another concept is that insulin resistance in type 1 diabetes might be related to the route of insulin administration. Insulin absorption from subcutaneous depots results in relative peripheral hyperinsulinemia and hepatic hyperinsulinemia, compared with normal physiology. Chronic adaptation to this situation could reduce peripheral insulin-mediated glucose uptake and increase hepatic glucose production. It has been proposed that reduced hepatic insulin exposure results in a reduced level of circulating IGF-1, which may increase peripheral insulin resistance. 15,26,27 Patients who entered remission, especially those with long-lasting remission had a shorter time of exposure to high concentrations of exogenous insulin, compared to patients with no or short remission.
Limitation of the study
Insulin sensitivity at diagnosis of the disease was not measured. A daily insulin dose was determined by the patient self-report, which may generate a reporting bias.
The study analyzed the remission period in adults diagnosed with type 1 diabetes, not in children. Future work needs to be done to generalize these findings of higher insulin sensitivity in children with a remission period.
Summary
The remission period is a very desirable state in the course of diabetes. Previous studies showed that its development is correlated with improvement of insulin secretion and insulin sensitivity. Our study shows that patients with type 1 diabetes who entered remission, despite its ending, have higher insulin sensitivity at 7 years after diagnosis of diabetes than nonremitters. We also documented that duration of remission corresponds with higher insulin sensitivity at 7 years of follow-up.
Footnotes
Author Disclosure Statement
No competing financial interests exist.
Funding Information
No funding was received for this article.
Supplementary Material
Supplementary Table S1
References
Supplementary Material
Please find the following supplemental material available below.
For Open Access articles published under a Creative Commons License, all supplemental material carries the same license as the article it is associated with.
For non-Open Access articles published, all supplemental material carries a non-exclusive license, and permission requests for re-use of supplemental material or any part of supplemental material shall be sent directly to the copyright owner as specified in the copyright notice associated with the article.
