




Abstract
Background:
As the use of continuous glucose monitoring (CGM) has increased, time in range (TIR) and other core CGM metrics are now emerging as the core metrics for clinical targets and assessing diabetic complications, beyond HbA1c. This study investigated the association between the CGM-derived TIR, hyperglycemia, hypoglycemia metrics, and albuminuria.
Methods:
A total of 866 subjects with type 2 diabetes who underwent 3 or 6 days of CGM and had urinary albumin-to-creatinine ratio (ACR) measurements were retrospectively reviewed. CGM metrics were defined according to the most recent international consensus. Albuminuria was defined as one or more of the ACR measurements being >30 mg/g.
Results:
The overall prevalence of albuminuria was 36.6%. The prevalence of albuminuria was lower in subjects who achieved the target of TIR 70–180 mg/dL, time above range (TAR) >180 mg/dL, and TAR >250 mg/dL, as recommended by international consensus (P < 0.001). Multiple logistic regression analysis revealed that the odds ratio of having albuminuria was 0.94 (95% confidence interval: 0.88–0.99, P for trend = 0.04) per 10% increase in TIR of 70–180 mg/dL, after adjusting for multiple factors, including glycemic variability. The results were similar for hyperglycemia metrics (TAR >250 mg/dL and TAR >180 mg/dL).
Conclusions:
TIR 70–180 mg/dL and hyperglycemia metrics are strongly associated with albuminuria in type 2 diabetes.
Background
HbA1
Unlike HbA1c, core metrics from continuous glucose monitoring (CGM) inform not only the glycemic variability and mean glucose but also the time spent in hypoglycemia, hyperglycemia, and the target range by calculating the percentages of CGM readings per day. 9 –11 Moreover, since the accuracy of the sensor has improved, CGM parameters have nearly overcome the limitation of the measure of glucose concentration from interstitial fluid. 12 –14
Recently, the new recommendation for CGM-derived time in range (TIR) was presented and identified TIR as a metric of glycemic control that provides more representative of overall glycemic control than HbA1c alone. 15 As the use of CGM is rapidly growing as an essential part of diabetes management in clinical practice, the need to investigate whether TIR and other CGM parameters are related to diabetes complications as HbA1c is increasing. 16,17 Considering the potential importance of TIR as a predictive marker of diabetes complication, Lu et al. showed the strong relationship between TIR with retinopathy and carotid intima-media thickness. 18,19
A well-known fact, especially in diabetes, is that albuminuria is a predictive marker for cardiovascular and kidney disease and eventually increases mortality. 20 –22 Nonetheless, previous studies on associations between albuminuria and CGM metrics, including TIR, are lacking.
Therefore, this study aimed to determine the relationship between TIR, the emerging clinical target for glycemic control, and other CGM parameters and the risk of albuminuria in type 2 diabetes.
Methods
Study population
The study population consisted of type 2 diabetes patients who underwent CGM at the Division of Endocrinology and Metabolism of Samsung Medical Center (SMC, Seoul, Republic of Korea) from March 2009 to May 2019.
Initially, 1103 subjects were identified. Subjects with missing data for urine albumin-to-creatinine ratio (ACR) (n = 182), subjects with malignancy (n = 5), severe liver disease defined by a Child-Pugh score of >7 (n = 19), or subjects with an estimated glomerular filtration rate (eGFR) of <30 mL/min/1.73 m2 when calculated using the Chronic Kidney Disease Epidemiology Collaboration (CKD-EPI) formula (n = 26) were excluded. Subjects with other missing data or with a history of diabetic ketoacidosis or hyperosmolar hyperglycemic syndrome were also excluded. A total of 866 subjects were included in the final study.
The Institutional Review Board (IRB) of SMC approved this study protocol (No. 2019-10-103), and the informed consent requirement was waived by the IRB because the study information was de-identified.
CGM metrics
Each patient underwent CGM in a blinded manner, either using GOLD™ (Medtronic MiniMed, Northridge, CA) for three consecutive days (n = 813) or iPro™2 (Medtronic MiniMed) for six consecutive days (n = 53) manner, and the data were retrospectively reviewed. At least two capillary blood glucose readings were measured on each day of use from the first day of CGM as a calibration measurement. The primary CGM metric included in the analyses was percent TIR of 70–180 mg/dL, in line with international consensus recommendations for CGM metrics. The other metrics were hyperglycemia (time above range [TAR] >250, >180 mg/dL), hypoglycemia (time below range [TBR] <54, <70 mg/dL), and glycemic variability (coefficient of variation [CV]).
Clinical variables and biochemical measurements
Subjects underwent anthropometric evaluation, including weight and height, with light clothing. Body mass index (BMI, kg/m2) was calculated, and systolic blood pressure and diastolic blood pressure were expressed as the mean of two readings, each measured in a sitting position using a sphygmomanometer after a 5 min rest period. Blood samples were collected after a 12 h overnight fast. Data regarding medical history and concomitant medications such as angiotensin-converting enzyme inhibitors (ACEi), angiotensin receptor blockers (ARB), or other antihypertensive medication or lipid-lowering agents were collected. In addition, the use of antihyperglycemic medication during CGM was reviewed. The data above mentioned were retrieved on the first date of CGM wear, and CGM data were collected for three or six consecutive days.
In this study, hypertension was defined as having a blood pressure of at least 140/90 mmHg or taking antihypertensive medication. ACR was measured in a spot urine collection at least once within 6 months of the CGM date, and the ratio (mg/g) taken closest to the CGM date was used for the assessment of clinical stages of albuminuria: normoalbuminuria, ACR <30 or albuminuria, ACR ≥30. An additional albuminuria measure, defined as ACR ≥30 mg/g for two consecutive visits within 6 months of the CGM date, was also used (n = 526).
Statistical analysis
Data are expressed as the mean (standard deviation) for continuous variables and as a percentage for categorical variables. Continuous variables with a skewed distribution were expressed using the median and interquartile range. Comparisons between baseline characteristics according to presence of albuminuria were made using the Student's t-test for distributed continuous variables, the Mann–Whitney test for skewed distributed continuous variables, and chi-square tests with Fisher's exact test for categorical variables.
Linear regression analyses were performed to investigate the correlation of TIR of 70–180 mg/dL and TAR (>180, >250 mg/dL) with other factors reflecting mean glucose level such as HbA1c and the glucose management indicator (GMI).
Multiple logistic regression analyses were performed to evaluate the odds ratios (ORs) and 95% confidence intervals (CI) for the risk of albuminuria with a 10% increase in TIR of 70–180 mg/dL, TAR (>180, >250 mg/dL), and TBR (<54, <70 mg/dL), after adjusting for confounding variables affecting albuminuria. Moreover, the analyses were again performed in the subjects who had two or more of the ACR measurements (n = 526).
We also performed subgroup analyses to evaluate the interaction between subgroups regarding glucose status (HbA1c ≤7.5% vs. >7.5%), use of ARB or ACEi, duration of diabetes (≤10 years vs. >10 years), presence of hypertension, and presence of CKD, defined as an eGFR of <60 mL/min/1.73 m2.
Finally, multiple linear regression analyses were used to determine the association between CGM parameters and log-transformed ACR after adjusting for previously noted confounding factors.
Significance in the analyses was established on the basis of two-tailed 0.05 significance level. The statistics program used for analyses was SPSS (version 26.0; SPSS, Inc., Chicago, IL).
Results
Baseline characteristics
The baseline characteristics of the study subjects stratified by presence of albuminuria are shown in Table 1. Among the total study population, 60.5% were male and the mean age was 58.5 ± 10.3 years. Mean diabetes duration was 13.1 ± 8.6 years and mean HbA1c level was 8.2% ± 1.5%. Of the study subjects, 317 (36.6%) had albuminuria.
Baseline Characteristics According to the Presence of Albuminuria (n = 866)
Values are shown as mean (SD), median (IQR), or number of subjects (%) as appropriate for the distribution.
ACEi, angiotensin-converting enzyme inhibitors; ARB, angiotensin receptor blocker; BMI, body mass index; CGM, continuous glucose monitoring; CKD, chronic kidney disease; CRP, c-reactive protein; CV, coefficient of variation; DBP, diastolic blood pressure; DPP-4, dipeptidyl peptidase-4; eGFR, estimated glomerular filtration rate; GLP-1, glucagon like peptide-1; GMI, glucose management indicator; HDL-C, high-density lipoprotein cholesterol; IQR, interquartile range; LDL-C, low-density lipoprotein cholesterol; SBP, systolic blood pressure; SD, standard deviation; SGLT-2, sodium glucose cotransporter-2; TAR, time above range; TBR, time below range; TIR, time in range.
When compared to subjects without albuminuria, subjects with albuminuria were more likely to be older, use ACEi or ARB, have a longer duration of diabetes, and have higher prevalence rates of hypertension and CKD.
The mean amount of CGM data was 77.5 ± 21.7 h in subjects without albuminuria and 79.9 ± 22.3 h in subjects with albuminuria, which were comparable (P = 0.128). Subjects with albuminuria were observed to have significantly lower mean TIR of 70–180 mg/dL (55.6% ± 24.8% vs. 64.0% ± 26.1%, P < 0.001) and higher TAR >180 mg/dL (41.9% ± 25.5% vs. 33.5% ± 26.7%, P < 0.001), TAR >250 mg/dL (17.1% ± 19.7% vs. 11.7% ± 17.1%, P < 0.001), and CV (31.3% ± 9.7% vs. 29.0% ± 9.5%, P < 0.001) than those without albuminuria. Furthermore, subjects with albuminuria had 8.4% lower TIR of 70–180 mg/dL, represented by 2 h/day, had 8.4% (2 h/day) higher TAR >180 mg/dL, and had 5.4% (1.3 h/day) higher TAR >250 mg/dL. However, no significant differences were found in metrics for hypoglycemia (TBR <54 mg/dL and TBR <70 mg/dL).
Correlation of TIR (70–180 mg/dL) and TAR (>180, >250 mg/dL) with HbA1c and GMI
TIR of 70–180 mg/dL was strongly correlated with mean glucose (r = −0.901, P < 0.001) and GMI (r = −0.901, P < 0.001) (Supplementary Fig. S1). Moreover, hyperglycemia metrics were also highly correlated with mean glucose and GMI (P < 0.001). The correlations of TIR of 70–180 mg/dL and hyperglycemia metrics with HbA1c were moderate.
CGM-measured core metrics, including TIR of 70–180 mg/dL and the risk of albuminuria
The prevalence of albuminuria according to the groups divided according to the targets designated by the recent international consensus is shown in Figure 1. Subjects who achieved the target of TIR of 70–180 mg/dL ≥70%, TAR (>180 mg/dL) <25%, and TAR (>250 mg/dL) <5% had a lower prevalence of albuminuria than subjects who did not achieve those targets (all P < 0.001).
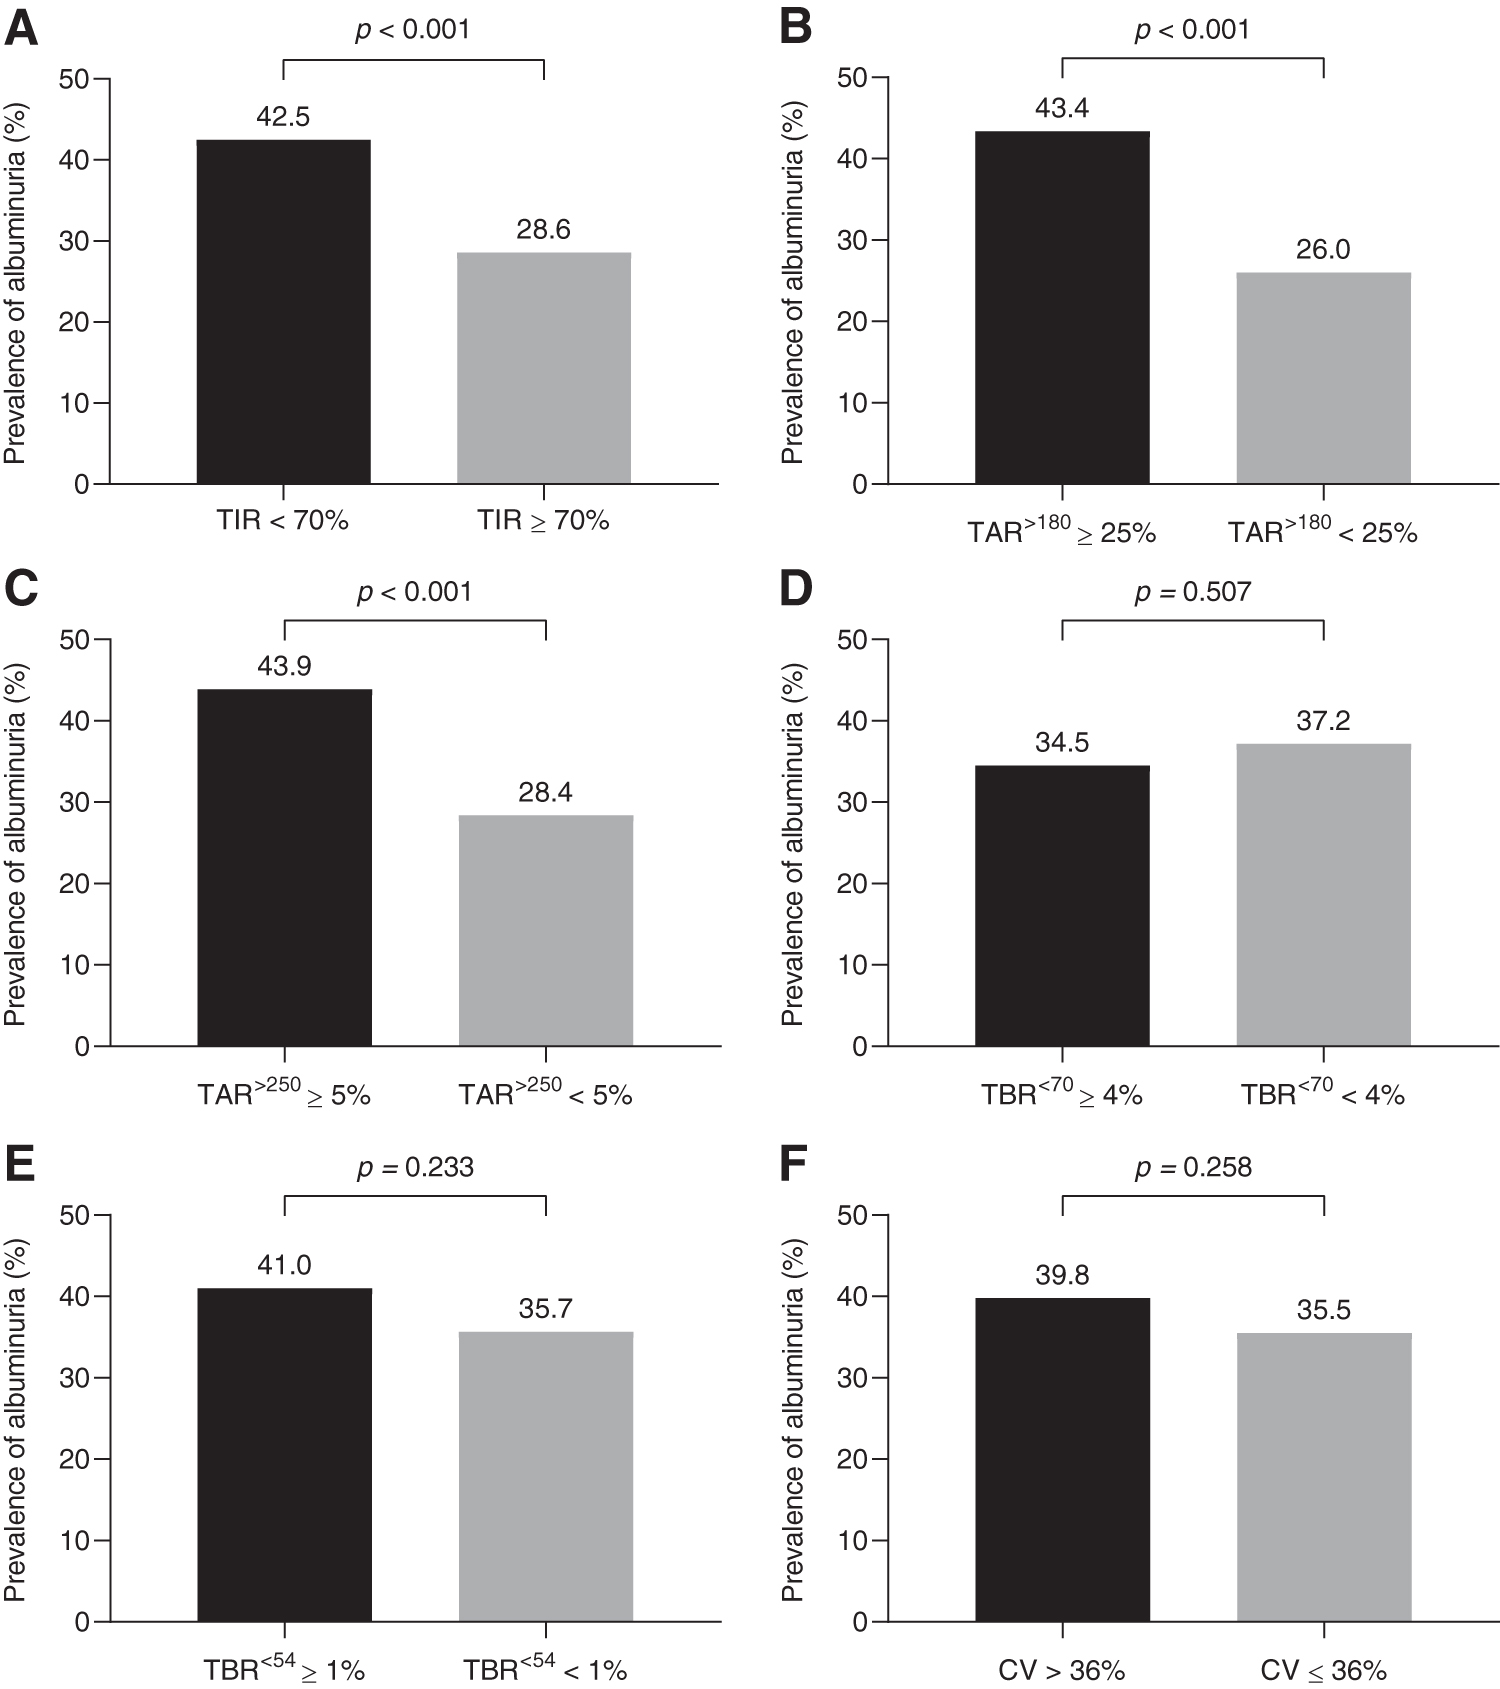
Prevalence of albuminuria according to subjects who achieved the
To investigate the relationship between core metrics, including TIR of 70–180 mg/dL and log-transformed ACR, linear regression analyses were performed (Fig. 2). The TIR of 70–180 mg/dL was negatively correlated with log-transformed ACR (standardized β = −0.01, P < 0.001). Similarly, the metrics for hyperglycemia, TAR (>180 mg/dL, standardized β = 0.01, P < 0.001) and TAR (>250 mg/dL, standardized β = 0.016, P < 0.001), were each positively associated with log-transformed ACR. However, the metrics for hypoglycemia were associated with neither the prevalence of albuminuria nor log-transformed ACR.

Multiple linear regression analysis of CGM metrics and log-transformed ACR. ACR, albumin-to urinary creatinine ratio; CGM, continuous glucose monitoring.
Next, we explored the association between TIR and albuminuria using multiple logistic regression analyses. The OR for risk of albuminuria was 0.88 (95% CI: 0.84 − 0.93) per 10% increase in TIR of 70–180 mg/dL (Table 2). The association remained significant after adjustment for age, sex, BMI, triglyceride, low-density lipoprotein cholesterol, use of ACEi or ARB, use of sodium glucose cotrasporter-2 inhibitors, CKD, and diabetes duration (Model 4, OR: 0.93 [95% CI: 0.87–0.99]). Further adjustment of CV as the glycemic variability metric also showed a significant negative association between TIR of 70–180 mg/dL and albuminuria (Model 5, OR: 0.94 [95% CI: 0.88 − 0.99]). However, the results showed no significant association between TIR and albuminuria (Model 6, OR: 0.97 [95% CI: 0.95–1.04]) after further adjustment for HbA1c. The results were similar in analyses conducted separately on subjects who had two or more ACR measurements (Supplementary Table S1).
Association Between Time in Range (70–180 mg/dL) and the Risk of Albuminuria
Model 1: crude.
Model 2: adjusted for age, sex, BMI, SBP, triglyceride, and LDL-C.
Model 3: adjusted for model 2 plus use of ACEi or ARB.
Model 4: adjusted for model 3 plus use of SGLT-2i, CKD, and diabetes duration.
Model 5: adjusted for model 4+CV.
Model 6: adjusted for model 4+HbA1c.
Odds ratios represent per 10% increase in TIR.
Subgroups were analyzed for model 3.
CI, confidence interval; SGLT-2i, sodium glucose cotransporter-2 inhibitors.
Subgroup analyses are also shown in Table 2. Interaction was observed for an HbA1c of 7.5% or less versus an HbA1c of more than 7.5%, with a benefit favoring the lower HbA1c (P for interaction = 0.076). However, the strong inverse association between TIR of 70–180 mg/dL and albuminuria remained regardless of diabetes duration, the presence of hypertension, and CKD (for Model 3, P for interaction >0.10).
We also investigated the risk of albuminuria with other core metrics, TAR and TBR (Table 3). The prevalence of albuminuria increased only with metrics for hyperglycemia. The ORs for a 10% increase in TAR (>180 mg/dL) and TAR (>250 mg/dL) were 1.07 (95% CI: 1.01 − 1.19) and 1.10 (95% CI: 1.01–1.20), respectively, after adjustment for confounding factors, including CV.
Association Between Other Core Continuous Glucose Monitoring Metrics and the Risk of albuminuria
Model 1: crude.
Model 2: adjusted for age, sex, BMI, SBP, triglyceride, LDL-C, use of ACEi or ARB, use of SGLT-2i, CKD, diabetes duration, and CV.
Odds ratios represent per 10% increase in TAR.
Discussion
In this study, we have demonstrated that among subjects with type 2 diabetes, TIR of 70–180 mg/dL derived from CGM significantly increased the risk of albuminuria, even after adjusting for various confounding factors, including CV, which contribute to albuminuria. This association persisted regardless of diabetes duration, hypertension, and CKD. Moreover, hyperglycemia metrics such as TAR >180 mg/dL and TAR >250 mg/dL were also independent risk factors for albuminuria. However, hypoglycemia metrics were unrelated to albuminuria.
Until now, HbA1c has been the only prospectively evaluated tool for assessing the risk for diabetes complications. However, several studies have reported to show a relationship between TIR of 70–180 mg/dL and laboratory HbA1c. Vigersky and McMahon analyzed 1137 patients with type 1 and 2 diabetes from 18 articles and reported a high correlation (r = −0.84, R 2 = 0.71) of TIR of 70–180 mg/dL with HbA1c. 23 Beck et al. showed that an increase in TIR of 70–180 mg/dL of 10% corresponds to a decrease in HbA1c of 0.6% on average in patients with type 1 diabetes. 24 They even further reported the similar correlations of TIR of 70–180 mg/dL and TAR >180 mg/dL with HbA1c.
We showed that GMI, which has been coined to describe HbA1c estimated from average glucose values derived from CGM, was highly correlated with hyperglycemic CGM measures, but the correlation of CGM metrics with HbA1c is moderate in patients with type 2 diabetes, similar to the previous study of patients with type 1 diabetes. There is a slight difference in the relationship between TIR and HbA1c versus TIR and GMI, as HbA1c value reflects glycemic status of previous 3 months at baseline, but GMI provides an overall current glycemic trend in a shorter time window, showing lower GMI values compared to HbA1c values at baseline in our study.
In addition, our study showed a wide range of interindividual variability of HbA1c in subjects with similar TIR as the previous study. 24 They suggested that the different HbA1c changes correspond to TIR according to the baseline glucose status. They showed even more HbA1c changes correspond to TIR when the baseline HbA1c is higher than 8.0% and lower HbA1c changes correspond to TIR when the baseline HbA1c is lower than that. These results indicate that the two metrics assessing glucose status may be similar but not the same and have different meanings, respectively. Taken together, these metrics could be the potential utility of glycemic data measured by CGM when used as a complement to HbA1c for assessing the risk for diabetes complications.
Therefore, recently, a cross-sectional study correlating 3-day TIR of target glucose with diabetic retinopathy and intima-media thickness was reported. 18,19 Furthermore, a TIR of target glucose and TAR computed from seven-point self-monitored blood glucose (SMBG) but not CGM were retrospectively investigated for retinopathy and microalbuminuria outcomes using Diabetes Control and Complications Trial data and the associations have been reported. 25
In agreement with these data, our study showed a 6% decrease in albuminuria risk with a 10% increase in TIR of 70–180 mg/dL after adjustment for various confounding factors. Moreover, our study reported 10% and 7% increases in risk for albuminuria with a 10% increase in TAR >250 mg/dL and TAR >180 mg/dL, respectively. However, in the previous study that also investigated albuminuria, they conducted the study with TIR of target glucose derived from SMBG. 25 In addition, while we determined the relationship between CGM parameters and albuminuria, we further adjusted for use of ACEi or ARB, duration of diabetes, and CV, which could affect albuminuria, but the previous study did not adjust for the various confounding factors.
Nevertheless, our study did not show a significant association between TIR and albuminuria after further adjustment for HbA1c showing that TIR is not an independent risk factor for albuminuria beyond HbA1c. However, the relationship between TIR and albuminuria still remains as TIR and HbA1c have a close relationship but different meanings for assessing glucose status. Thus, although TIR may not be an independent metric for assessing the risk of albuminuria as a diabetic complication, it could still be the potential utility when used as a complement to HbA1c.
It is important to note that the association between TIR of target glucose and albuminuria was strong in subjects with an HbA1c of 7.5% or lower. As we have shown in Supplementary Figure S1, TIR and HbA1c are well correlated but not the same, and the range of HbA1c is wide in a given TIR of target glucose area, which means even subjects with similar HbA1c could have different TIR of target glucose. Particularly in subjects who were reported to be well controlled according to HbA1c, the TIR of target glucose could be a valuable and appropriate tool for clinical targets for albuminuria outcome measurements.
Some studies have shown a close relationship with glycemic variability and albuminuria in diabetes. 26,27 In contrast to the studies, our results showed no difference in the prevalence of albuminuria, depending on whether the CV was higher or lower than 36. Both CV levels were low regardless of the presence of albuminuria, although there was a significant difference. These results may be because when the CV is high, the CV also reflects not only hyperglycemia but also hypoglycemia, which does not correlate with albuminuria in the present study. Thus, taken together, TIR is more suitable in establishing the risk of albuminuria than CV.
High glucose levels are well known to increase the risk for albuminuria in type 2 diabetes by increasing reactive oxygen species, inflammatory cytokines, and growth factors, and these in turn eventually lead to endothelial dysfunction. 28 –31 Thus, evidence remains supportive of the close relationship of albuminuria with TIR and TAR but not TBR.
The notable strength of the current study is that we evaluated not only TIR of target glucose but also hyperglycemia and hypoglycemia metrics in line with the most recently updated international consensus reports emphasizing the importance of achieving the target of TIR and TAR to reduce the risk for albuminuria. 15 Thus, to the best of our knowledge, this is the first report to investigate the TIR of target glucose and hyperglycemia and hypoglycemia metrics derived from CGM with albuminuria.
However, the study also has several limitations that should be mentioned. The subjects underwent CGM for 3–6 days and, therefore, may not represent overall glucose status, as previous studies have noted that at least 14 days were needed to accurately interpret CGM data. 32 Despite the short duration of CGM, this study used the longest CGM wear among studies showing correlation of TIR of target glucose and diabetes complications; previous studies used a 3-day TIR of target glucose and a seven-point SMBG. Second, the study was cross sectionally designed; when exposure and outcome are simultaneously assessed, there is generally imprecise evidence of a temporal relationship between exposure and outcome. More investigations involving longitudinal study approaches are needed.
Conclusions
Our study supports that TIR of target glucose and TAR (>180 and >250 mg/dL) are valuable metrics for determining the risk for albuminuria, a predictor of cardiovascular and kidney disease, in subjects with type 2 diabetes and suggests the possibility of reducing the risk for albuminuria by increasing TIR of target glucose and reducing hyperglycemia metrics.
Footnotes
Authors' Contributions
G.K. and J.H.K. conceived this study. J.H.Y., G.K., and J.H.K. contributed to the design of the study. J.H.Y., M.S.C., J.A., S.W.P., Y.K., S.-M.J., and K.Y.H. conducted data collection. J.H.Y. conducted the analysis. S.-M.J., J.H.Y., J.H.K., and G.K. interpreted the results. J.H.Y. wrote the initial draft of the article, with revisions by all authors. The final article was approved by all authors. J.H.Y., J.H.K., and G.K. are the guarantors of this work.
Author Disclosure Statement
No competing financial interests exist.
Funding Information
No funding was received for this article.
Supplementary Material
Supplementary Figure S1
Supplementary Table S1
References
Supplementary Material
Please find the following supplemental material available below.
For Open Access articles published under a Creative Commons License, all supplemental material carries the same license as the article it is associated with.
For non-Open Access articles published, all supplemental material carries a non-exclusive license, and permission requests for re-use of supplemental material or any part of supplemental material shall be sent directly to the copyright owner as specified in the copyright notice associated with the article.
