
Abstract
Background:
The prevalence of diabetes in youth is increasing worldwide in parallel with the obesity epidemic. This study aimed to determine the incidence rates of dysglycemia (diabetes or prediabetes) and evaluate the predictors of its progression or regression to normal glucose tolerance (NGT) in a cohort of children and adolescents studied in Chennai, South India.
Methods:
A longitudinal follow-up of the Obesity Reduction and Awareness of Noncommunicable Diseases through Group Education (ORANGE) cohort was performed after a median of 7.1 years (n = 845; 5928 person-years of follow-up). To determine their diabetes status at follow-up, participants underwent an oral glucose tolerance test (n = 811 with NGT and 34 with prediabetes at baseline), excluding those with diabetes at baseline. Incidence rates for dysglycemia were reported per 1000 person-years of follow-up. Cox proportional hazards model was used to estimate the predictors of progression and regression.
Results:
Out of 811 individuals with NGT at baseline, 115 developed dysglycemia giving an incidence rate of 20.2 per 1000 person-years (95% confidence interval: 16.8–24.2). Among those with prediabetes at baseline, 70.6% of the individuals converted to NGT and the remaining 29.4% either got converted to diabetes or remained as prediabetes. Higher age, body mass index, fasting plasma glucose, 2-hour plasma glucose (2-h PG), positive family history of diabetes, and systolic blood pressure (BP) were independent predictors of incident dysglycemia, whereas lower age, waist circumference, 2-h PG, systolic BP, and triglycerides predicted regression to normoglycemia.
Conclusions:
This study highlights the growing burden of dysglycemia in Asian Indian youth and emphasizes the need for targeted preventive actions.
Introduction
With the rapidly growing population and rising prevalence of type 2 diabetes in the country, the disease burden is estimated to be huge in the coming years. 1 The Indian Council of Medical Research-INdiaDIABetes (ICMR-INDIAB) study, which is the largest study on diabetes prevalence in the country, has found that the takeoff age for diabetes occurs earlier among Indians (25–40 years). 2 There is also a rapid conversion noted from normal glucose tolerance (NGT) to dysglycemia contributing to high rates of diabetes incidence in Asian Indians when compared with the Western populations. 3,4
The prevalence of diabetes in children, adolescents, and youth is increasing worldwide in parallel with the obesity epidemic. 5 The onset of diabetes in youth increases the risk of morbidity and mortality during the most productive years of their life. 6 It is estimated that adolescents diagnosed with diabetes lose an average of 15 years of life. 7 Already diabetes is the third leading chronic disease in children and adolescents. 8 Youth with diabetes have a high risk of developing premature microvascular (neuropathy, nephropathy, and retinopathy) and macrovascular complications due to poor diabetes control. 9 In addition to the increased genetic susceptibility in South Asians to develop diabetes, the massive change in lifestyle elevates the risk of developing type 2 diabetes and its associated complications at an early age. 10 Routine screening for dysglycemia is usually not done in children and adolescents. Even though it is recommended in the high-risk groups, 11 childhood and adolescent obesity is not taken up very seriously in South Asian countries, due to which there is a steady rise in type 2 diabetes in these age groups. 12
There is paucity of data on the prevalence and incidence of diabetes in Indian children, adolescents, and young adults. Such data can provide valid estimates of the diabetes trends in the country and help formulate policy on screening and prevention of diabetes in these younger age groups. We present a longitudinal follow-up report from a population-based epidemiological study on glucose intolerance in Indian children and adolescents called ORANGE (Obesity Reduction and Awareness of Noncommunicable Diseases through Group Education). 13 This article aimed to determine (1) the incidence rates of dysglycemia (diabetes and prediabetes), (2) the conversion rates from NGT to prediabetes and diabetes, and (3) evaluate the predictors of progression to dysglycemia and regression to NGT in 845 children and adolescents followed up for a median of 7.1 years (interquartile range [IQR] 1.4) (5928 person-years of follow-up) in Chennai, South India.
Methods
This study is a follow-up of the ORANGE cohort—community component. The details of the ORANGE study methodology are published elsewhere. 14 In brief, the community component aimed at studying the prevalence of obesity, glucose intolerance, and metabolic syndrome in children and adolescents aged between 6 and 19 years in Chennai, South India. The baseline testing was done on 1519 study participants between 2008 and 2011. In the baseline survey, the prevalence of glucose intolerance was found to be 3.7% which included 4 (0.3%) children with diabetes and 52 (3.4%) with prediabetes. 13
At baseline, there were 1463 individuals with NGT and 52 with prediabetes. Of these, those individuals whose glycemic status was unknown at follow-up were excluded and only those individuals whose glucose tolerance status at follow-up was known (n = 811 with NGT and 34 with prediabetes at baseline) were included in the analysis. The 4 individuals with diabetes at baseline were excluded for analysis. Six hundred sixty-nine (44%) individuals were lost to follow-up, of whom 289 (19.1%) migrated to a different state or country for higher studies and family commitments, 224 (14.7%) were not traceable due to demolitions of the original building, wrong phone numbers, and missing contact details, and 156 (10.2%) refused to participate in the study even after repeated attempts. At follow-up, death was reported in 5 (0.3%) individuals. Information on death was collected by a verbal autopsy from family members of the study participant. The cause of death was confirmed using medical records, death certificates, or discharge summary from hospitals. The follow-up was therefore completed in 845 individuals, resulting in a completion rate of 55.6% (845 out of 1519) (Fig. 1). A detailed explanation on the response rate has been included in the discussions.
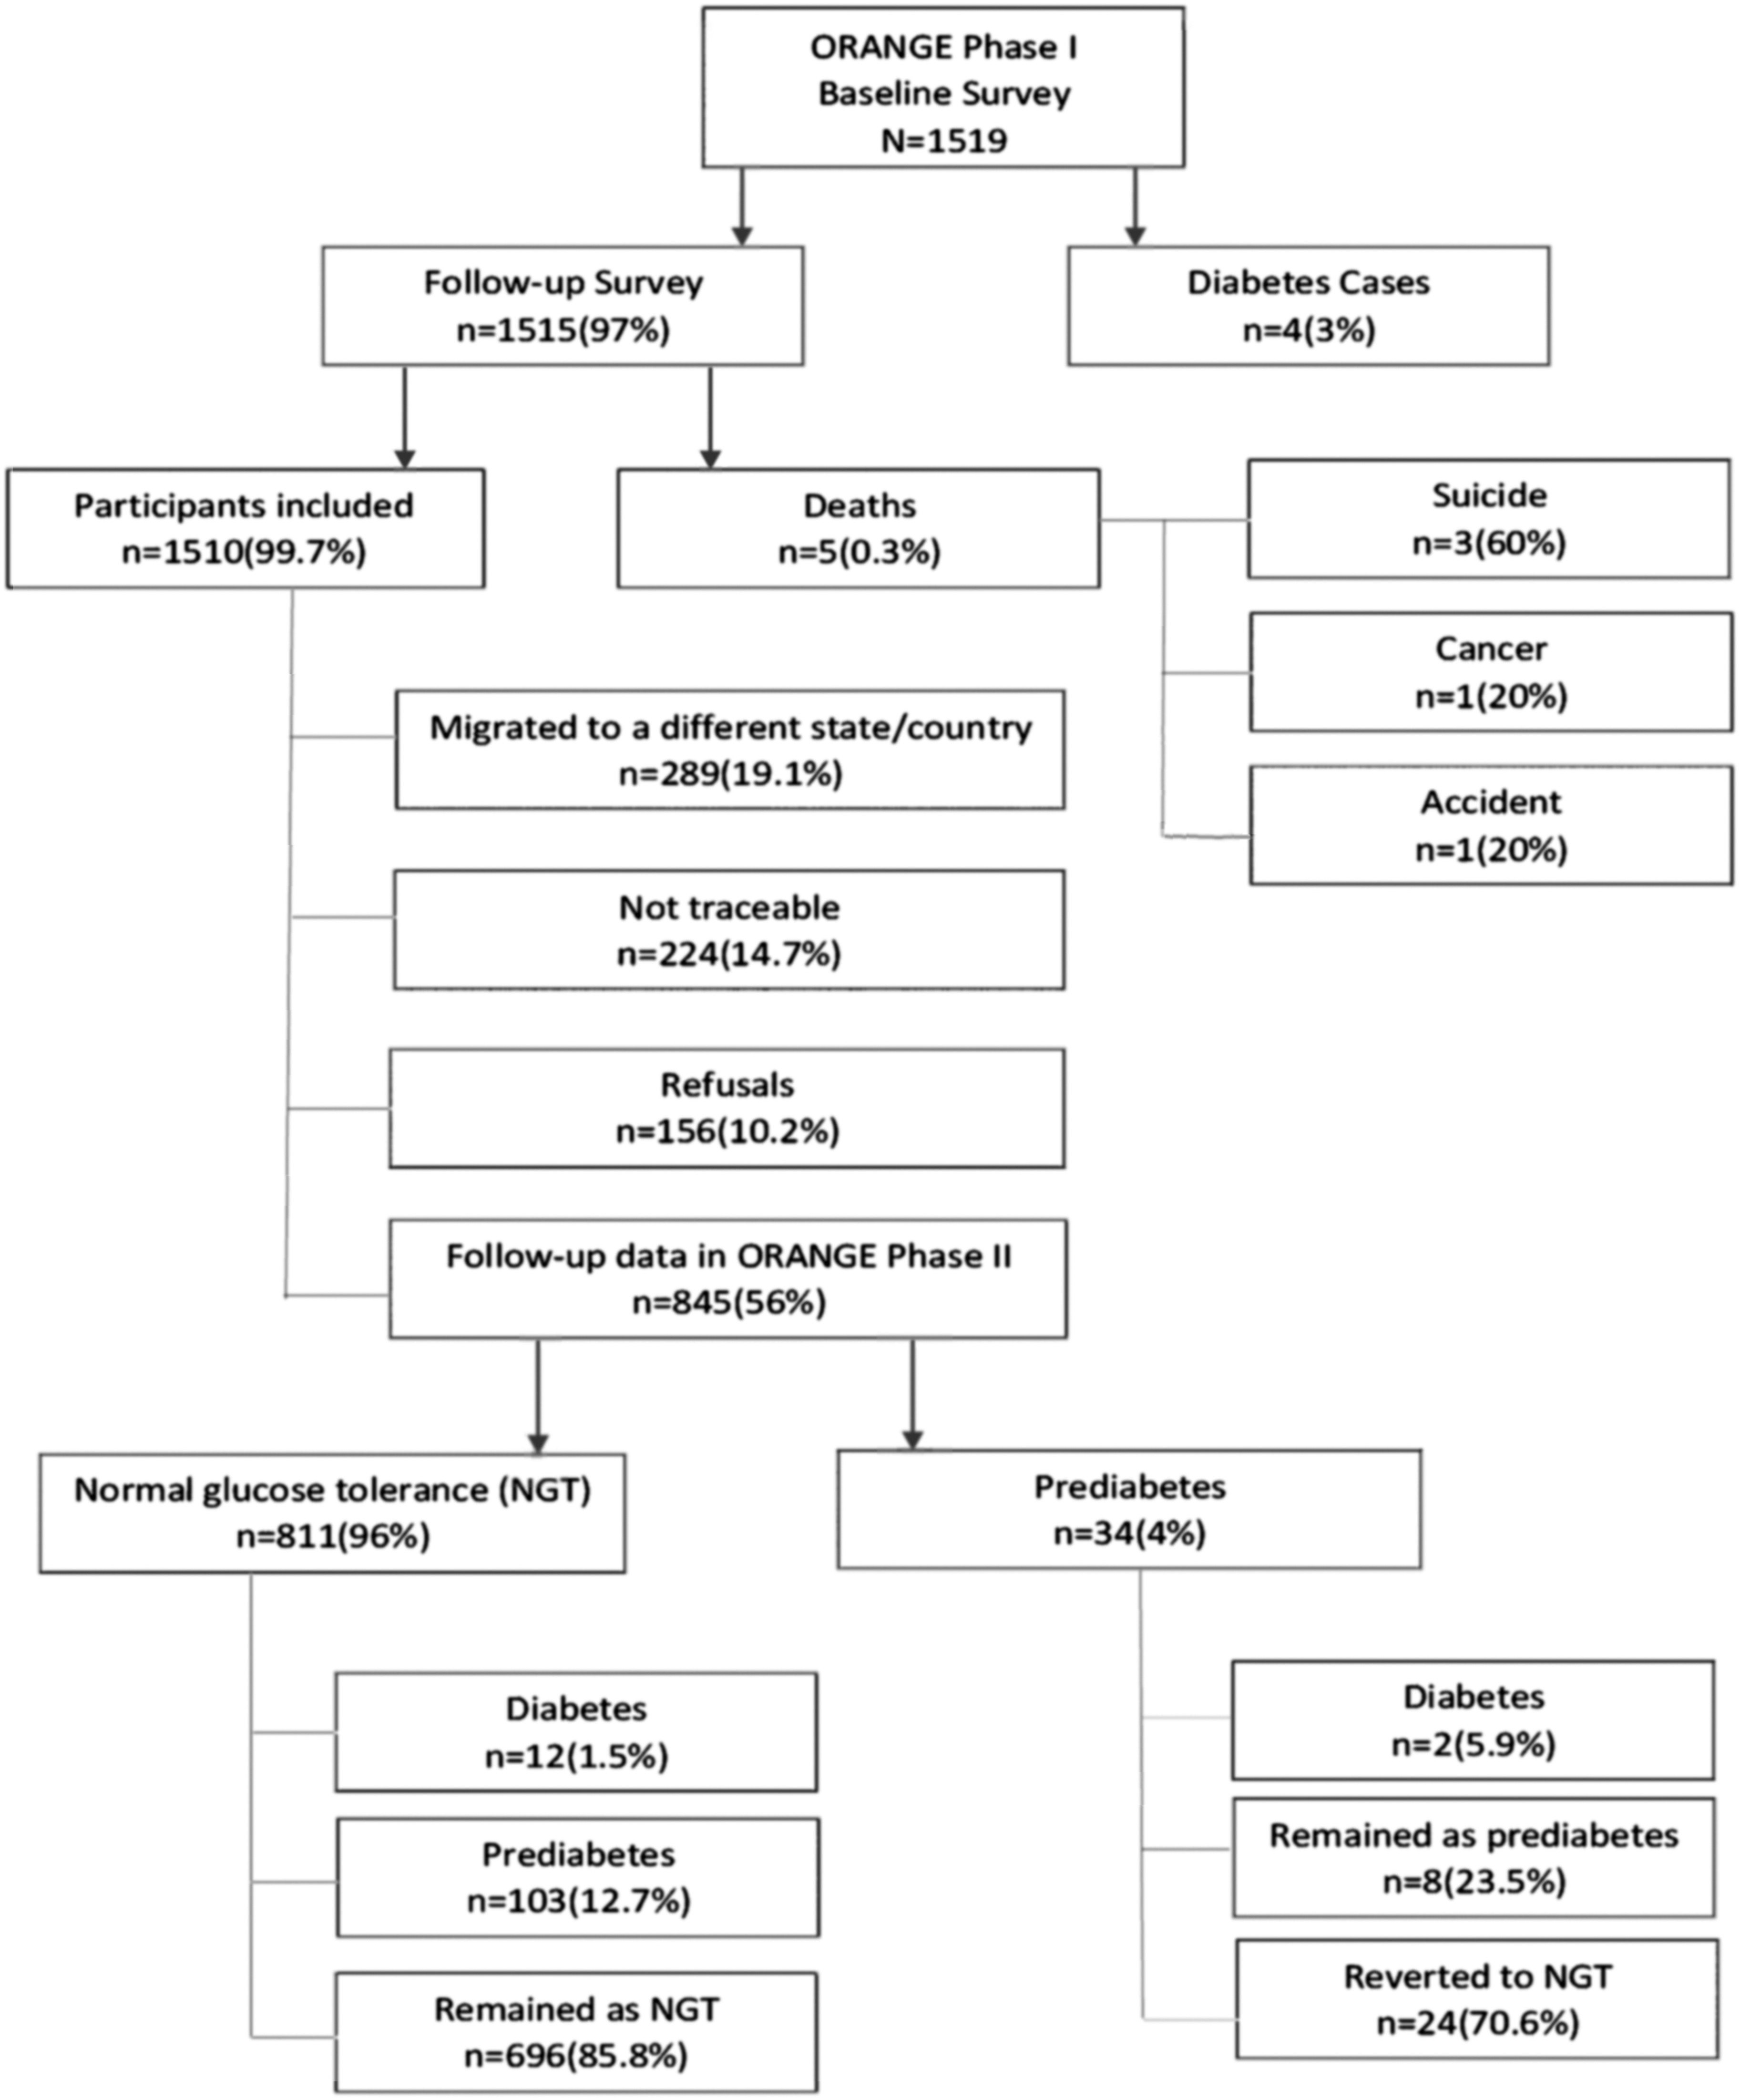
Flowchart depicting the details of study participants.
Assessment of anthropometric assessments, such as height, weight, waist, and blood pressure (BP), and biochemical parameters, including fasting and postprandial plasma glucose, lipid profile, and assessment for diabetes complications, was done as per standard protocol. Height was measured in centimeters using a stadiometer, and weight was recorded to the nearest 0.5 kg. Body mass index (BMI) was calculated using the following formula: weight (kg)/height squared (in m2). Waist circumference was measured in centimeters using a nonstretchable fiber measuring tape. BP was recorded in a rested sitting position in the right arm with a mercury sphygmomanometer and rounded off to the nearest 2 mmHg.
Participants underwent an oral glucose tolerance test (OGTT) after an overnight fast of 8 to 10 h. Fasting and 2-hour plasma glucose (2-h PG) (hexokinase method) was measured on a Hitachi 912 Autoanalyzer (Hitachi, Mannheim, Germany) using kits supplied by Roche Diagnostics (Mannheim, Germany); and serum total cholesterol (cholesterol oxidase/peroxidase/amidopyrine method), serum triglycerides (glycerol phosphate oxidase/peroxidase/amidopyrine method), and high-density lipoprotein (HDL) cholesterol (direct method-polyethylene glycol-pretreated enzymes) using the Hitachi-912 Autoanalyzer (Hitachi). Low-density lipoprotein (LDL) cholesterol was calculated using the Friedewald formula. 15 The criteria for defining dysglycemia, 4 diabetes, 16 prediabetes, 17 isolated impaired glucose tolerance, 18 isolated impaired fasting glucose, 18 and insulin resistance (IR) 13,19 were based on well-established literature.
The Institutional Ethics Committee (IEC) of the Madras Diabetes Research Foundation reviewed and approved the study (CTRI/2016/09/007323). Written informed consent was obtained from the participants who were older than 18 years. In case of participants younger than 18 years, according to the ICMR guidelines, written consent was obtained from their parents or guardians, and in addition, assent was obtained from all study participants.
Statistical analysis
IBM Statistical Package for Social Sciences, version 23, was used to perform statistical analysis. The follow-up data collected from participants were compared to analyze the differences from baseline examination. Data were cleaned by replacing missing values and outliers with central tendency measures Descriptive statistics were used for calculating incidence through person-years (1000) for diabetes, prediabetes, or dysglycemia among baseline examination participants. Analysis of variance was performed to compare demographic, anthropometric, and biochemical variables (continuous) between the three progression groups. Chi-squared test was used for categorical variables. Censored data due to varying follow-up duration were handled using Cox regression analysis. Cox regression analysis identifies the association of independent characteristics of the population with incidence of diabetes, prediabetes, and dysglycemia. The hazard ratio was used to estimate the association of independent variables with the progression of diabetes, prediabetes, and dysglycemia. P < 0.05 was considered statistically significant. A sensitivity analysis was conducted to compare responders versus nonresponders for sociodemographic, anthropometry, and biochemical data.
Results
The follow-up survey was performed between 2015 and 2018 after a median of 7.1 years (IQR 1.4) (5928 person-years of follow-up). Descriptive characteristics of the 845 participants are presented in Table 1, which included 432 boys and 413 girls. The mean age of the study population was 20 ± 4 years. Boys had significantly higher waist circumference (81.8 vs. 73.4 cm, P < 0.001), systolic BP (117.4 vs. 105.5 mmHg, P < 0.001), diastolic BP (71.6 vs. 69.1 mmHg, P < 0.001), fasting plasma glucose (FPG) (89 vs. 85 mg/dL, P = 0.021), and serum triglycerides (99 vs. 79 mg/dL, P < 0.001) compared with girls. However, girls had a higher HDL cholesterol (42 vs. 37 mg/dL, P < 0.001) compared with boys.
Descriptive Characteristics of Individuals Based on Gender (n = 845)
Data are represented as mean ± standard deviation.
2-h PG, 2-hour plasma glucose; BMI, body mass index; BP, blood pressure; FPG, fasting plasma glucose; HDL, high-density lipoprotein; LDL, low-density lipoprotein.
Table 2 describes the incidence rates of different categories of dysglycemia in the ORANGE study cohort. Out of 811 individuals with NGT at baseline, 115 developed dysglycemia giving an incidence rate of 20.2 per 1000 person-years (95% confidence interval [CI]: 16.8–24.2). The incidence rate of prediabetes and diabetes was 18.1 (95% CI: 14.8–21.9) and 2.1 (95% CI: 1.1–3.6) per 1000 person-years, respectively. Overall, 14.2% of NGT at baseline converted to dysglycemia during the follow-up period. Among those with prediabetes at baseline, 70.6% of the individuals converted to NGT and the remaining 29.4% either got converted to diabetes or remained as prediabetes.
Incidence Rates of Diabetes and Various Categories of Dysglycemia in the Study Cohort
CI, confidence interval; IFG, impaired fasting glucose; IGT, impaired glucose tolerance; iIFG, isolated impaired fasting glucose; iIGT, isolated impaired glucose tolerance; NGT, normal glucose tolerance.
Clinical and biochemical characteristics of individuals with NGT at baseline based on their glycemic status at follow-up are shown in Table 3. Individuals who progressed to prediabetes and diabetes were significantly older, had a higher BMI, and waist circumference in males was higher (P < 0.05). Positive family history of diabetes was present in 64.1% of those converted to prediabetes and in 91.7% of those converted to diabetes. Also, the mean FPG and 2-h PG were higher in the prediabetes group (88.1 and 99.3 mg/dL) when compared with the diabetes group (87.3 and 97.1 mg/dL). Out of the 34 prediabetes individuals at baseline, 24 (70.6%) regressed to NGT, 8 (23.5%) remained as prediabetes, and 2 (5.9%) progressed to diabetes at follow-up. Since there were only two who developed diabetes in the follow-up, P-value could not be calculated, and hence, the values could not be depicted in the table.
Baseline Characteristics of Individuals with Normal Glucose Tolerance Based on Their Glycemic Status at Follow-Up
Data are represented as mean ± standard deviation or as number (percentage) unless otherwise indicated.
Cox proportional hazards model predicting the incidence of dysglycemia is depicted in Table 4. Older age, BMI, FPG, 2-h PG, positive family history of diabetes, and systolic BP were independent predictors of incident dysglycemia, while lower age, waist circumference, 2-h PG, systolic BP, and triglycerides predicted regression to normoglycemia.
Predictors of Incident Dysglycemia and Regression to Normal Glucose Tolerance in the Study Cohort
DM, diabetes mellitus; HR, hazard ratio; IR, insulin resistance.
Discussion
This is the first community-based incidence data from India on childhood, adolescent, and youth diabetes. After a median of 7.1 (IQR 1.4) years, salient findings of our longitudinal follow-up study are as follows: (1) the overall crude incidence of glucose intolerance increased from 3.7% in 200813 to 13.6% in 2018; (2) at follow-up, 720 individuals had NGT, 111 prediabetes, and 14 converted to diabetes; (3) every unit increase in BMI, fasting blood glucose, and 2-h glucose increased the risk of dysglycemia by 2%, 6%, and 4%, respectively, with family history of diabetes contributing to the maximum risk (60%).
The SEARCH for Diabetes in youth, a multicentric study carried out among 11,244 individuals aged 0 to 19 years, found that the incidence of diabetes increased by 2.2% in males every year than in females (1.4%). 20 Our findings also suggest that males (7.3%) had a higher incidence of dysglycemia when compared with the females (6.3%). The incidence rate of dysglycemia in Iranian adolescents after a mean follow-up of 9.2 years was 9.61 per 1000 person years, 21 which is half compared with the incidence rate derived from our study. The prevalence of diabetes increased by 10-fold from 1982 to 1994 at Cincinnati, Ohio. 22 The highest incidence of diabetes in children less than 15 years was 64.9 (95% CI: 59.7–70.3) per 100,000 person-years in 2006 at Finland. 23 The world's highest recorded prevalence and incidence of diabetes mellitus have been seen in Pima Indians, with the youth having an annual increase in prevalence ranging from 1.9% to 10%. 24 While in our study, the rise in incidence of dysglycemia was by 1% every year in adolescents and young adults. Hence, an increasing trend in diabetes progression among the youth population is alarming, worldwide.
In our study, several variables in the Cox regression analysis significantly contributed to dysglycemia. However, their impact levels varied among different factors. Systolic BP and age were also significant contributors but showed minimal impact on the outcome variable (dysglycemia). Research has revealed that among Asian adults, an impairment in insulin secretion is the issue, not IR, when compared with the younger population. 25 Also, the individuals diagnosed at a younger age have a more severe form of diabetes and poor glycemic control when compared with those with late-onset diabetes. 6 Preventive measures should therefore be taken by encouraging physical activity and healthy eating behaviors to avert the onset of a lifestyle disorder such as diabetes in the younger age group.
The increasing prevalence of overweight and obesity in our study is a definite marker for increased incidence of diabetes. Many studies report the prevalence and incidence of type 2 diabetes and prediabetes to be associated with increasing BMI. 26,27 In a study carried out in Germany, among 520 children and adolescents with BMI >97th percentile in the age group of 8.9 to 20.4 years, the prevalence of diabetes and prediabetes was 1.5% and 6.7%, respectively. 27 Asian Indians have a strong association between BMI and glucose intolerance, which has been confirmed by studies from India, 2 migrant Indians, and Asian populations. 28 Although Indians have a lower BMI when compared with the European population, the risk of diabetes was, however, much higher at low levels of BMI in Indians. 28 In Tokyo, there was 1.5-fold increase in prevalence of diabetes with a relative increase in obesity among school children during the study period from 1975 to 1990. 29 The highest prevalence of diabetes in Pima Indians is primarily contributed by the significant increase in body weight over 30 years of follow-up period. 24 Efforts must be undertaken to promote healthy eating and improve physical activity, which can thereby reduce the risk of obesity in the Indian population. 30 As a result of these widespread studies and also BMI being a modifiable risk factor, we believe that reduction in BMI could therefore lessen the growing burden of diabetes in the society.
In our study, systolic hypertension was common among dysglycemic individuals. In a multiethnic study conducted at Singapore, it was found that Indians were at highest risk of diabetes and these individuals were more prone to develop heart disease. 31 The Systolic Blood Pressure Intervention Trial (SPRINT) has shown reduced morbidity with reduction of elevated BP. 32 There are IR, endothelial dysfunction, autonomic nervous system dysfunction, and increased tissue renin/angiotensin/aldosterone system in the pathophysiology of hypertension and diabetes. 33 Our data also showed that there was increased triglyceride and decreased HDL concentration in boys when compared with girls. These lipid parameters are the strongest predictors of nonalcoholic fatty liver disease, type 2 diabetes, and cardiovascular disease in children and adolescents. 34
There are many studies that have assessed the predictive role of fasting and 2-h PG values in causing diabetes; however, only few studies have assessed both together. 35,36 In Mexico city population, where OGTT was performed at baseline and 7 years later, there was 45% increased risk of developing diabetes with FPG values and 87% risk with 2-h PG values. 36
Parental history of diabetes was an independent risk factor and predictor of prediabetes in a study done among Qatari adolescents with an odds ratio of 1.9 (CI: 1.1–3.2). 37 In another study by Mirbolouk et al., parental history of diabetes increased the risk of dysglycemia in adolescents by 1.63 times (95% CI: 1.02–2.60). 21 About 90% of children and adolescents affected with diabetes had either first- or second-degree relatives with diabetes, making it a highly heritable condition. 38 It is also known from another study that there were 65% of diabetes youth with first-degree relatives having diabetes. 23 Results from our study revealed that those belonging to an older age group, having increased body weight, hypertension, or a family history of diabetes, are at higher risk for dysglycemia.
The strengths of this study are the depiction of a wider age group of samples in adolescents and young adults. Study results are highly reliable as they are exclusively based on anthropometric, biochemical, and clinical parameters and not confined to reporting bias from individuals. The OGTT is a gold standard test for measuring glucose intolerance; this was used in our study to determine glucose status. Effective methods of calculating incidence were used as the individuals were diagnosed at various time intervals in the follow-up period. The main limitation includes lack of follow-up data for every year. The response rate was relatively less, which in turn could have made the diagnosis of glucose intolerance much lower in the population.
We understand that the response rate makes it difficult to generalize these results. However, we would like to lay out a few technical and practical issues we faced as lessons for researchers undertaking similar longitudinal follow-up studies among children and adolescents. As this was not a birth cohort study, we did not plan (nor had the funds) for annual visits. Nevertheless, a future follow-up study on any cohort may be possible, and it is important to at least call and update contact and basic health details annually. The field team tried their best to improve the response rate, but as the majority were in that vulnerable age group with either pressure of higher studies or had already moved to other locations for the same, it was very difficult to catch with them. The other major issue was change of contact numbers as many children and adolescents at baseline had given their parent's number, and, after close to 10 years, these numbers had changed, and, in instances where they had not, the now young adult had a different number that was not shared. Lack of participant contact details made it very difficult to connect and to explain to them the importance of this follow-up study, even though we had their parent's buy-in. We lost close to 19% of participants due to these issues. With changing times, the city landscape also changed such that many residential apartments that were part of our baseline survey were demolished for larger complexes. This was unexpected and contributed to a loss of 15% participants. Finally, we found that although the percentage of reversion to NGT was high, this occurred only in a total of 24 cases. Some of them could have had mild dysglycemia at baseline, but possibly have reverted to normal. It is also known that the OGTT has a limitation in that minor degrees of glucose intolerance may become normal when retested. Hence, repeating a GTT could be ideal in such cases, but is very difficult in an epidemiological setting.
To conclude, our study has emphasized the growing burden of diabetes and prediabetes in Asian Indian adolescents and young adults in the community. The follow-up data from the study cohort have therefore established a framework in characterizing the comorbidities of adolescents and young adults from South India. The rise in incidence trend needs to be urgently stalled by focusing on effective prevention and management strategies.
Footnotes
Acknowledgments
The authors thank the phlebotomists of the Translational Research Department at MDRF, Ms. Eswari, Mr. Deva, Ms. Kavitha, Ms. Prabavathi, Mr. Selva, and Mr. Vinoth, for their rigorous efforts in follow-up and sample collection. They thank Mr. Ganesh for data entry support. They also thank senior scientists at MDRF, Drs. Deepa and Shanthirani, for their kind expertise in pushing the follow-up numbers.
Author Disclosure Statement
No competing financial interests exist.
Funding Information
This research was supported by intramural funds from the Madras Diabetes Research Foundation.