
Abstract
Background:
There can be marked discordance between laboratory and estimated (using the glucose management indicator [GMI]) glycated hemoglobin (HbA1c) from continuous glucose monitoring (CGM). This may cause errors in diabetes management. This study evaluates discordance between laboratory and CGM-estimated HbA1c (eA1C).
Methods:
We performed a retrospective review of patients with diabetes who use CGM. The patients were seen at the University of Washington (UW) Diabetes Care Center from 2012 to 2019. We used UW's Institute of Translational Health Sciences to extract eligible encounters from the electronic medical record. We required that patients use CGM and that HbA1c and sensor data be obtained fewer than 4 weeks apart. There were no exclusion criteria. We calculated HbA1c-GMI discordance for each subject and assessed for any impact of comorbidities. We defined HbA1c-GMI discordance as absolute difference between laboratory and eA1C.
Results:
This study included 641 separate office encounters. Ninety-one percent of patients had type 1 diabetes. Most patients had diabetes for greater than 20 years. The mean duration of CGM wear was 24.5 ± 8 days. Only 11% of patients had HbA1c-GMI discordance <0.1%, but 50% and 22% had differences ≥0.5% and ≥1%. There was increased discordance with advanced chronic kidney disease (estimated glomerular filtration rate <60).
Discussion:
We found substantial discordance between laboratory and eA1C in a real-world setting. Clinicians need be aware that HbA1c may not as accurately reflect mean glucose as previously appreciated.
Introduction
The glucose management indicator (GMI), previously termed “estimated HbA1c” (eA1C), is a metric derived from converting mean glucose (from continuous glucose monitoring [CGM]) into an estimate of concurrent (laboratory) glycated hemoglobin (HbA1c) using a population-based formula. The GMI equation was created by pooling data from several smaller studies that together produced a regression equation to approximate HbA1c from CGM mean glucose. 1 These trials included those with both type 1 and type 2 diabetes and excluded comorbidities known to affect HbA1c. 2 –4 The use of CGM ranged from 13 to 89 days (mean = 48 days) but it appears that 14 days provide sufficient CGM data to generate a representative mean glucose. 5 The creators of the GMI equation also calculated discordance for each of their test subjects and showed difference between estimated and measured HbA1c levels. 1
Many find the eA1C useful in clinical management of diabetes. Before development of GMI, an international consensus group concluded that eA1C should be a core measurement recommended for inclusion on standard CGM reports. 6 These experts felt eA1C was most useful when it showed discrepancies between estimated and measured HbA1c. This pattern could alert clinicians to possible need for an alternative biomarker of glycemic control such as fructosamine or glycated albumin. 7 They did not, however, specify when a clinician should consider using these tests. The eA1C should also be useful for those individuals using CGM with comorbidities known to impact A1C such as hemoglobinopathies or anemia.
The original description of GMI from Bergenstal et al. reported differences in calculated GMI with measured HbA1c. 1 This was a population of 528 individuals from four clinical trials (three with type 1 diabetes) without other comorbidities. To date, we are not aware of any large “real-world” studies looking at GMI and laboratory HbA1c discordance outside of a clinical trial or organized database. The purpose of this study is to compare these two metrics in an academic diabetes clinic.
Methods
This study was approved by the University of Washington Institutional Review Board. We performed a sequential review of patients prescribed insulin (injections or pump) and CGM seen at the University of Washington (UW) Diabetes Care Center from 2012 to 2019. These patients had all been prescribed insulin for at least 3 months. We required that patients have a documented HbA1c value (by high-performance liquid chromatography) no more than 30 days before or after the associated office visit and CGM upload. The uploaded data contained a minimum of 14 full-day equivalents of (at least) 95% “data sufficiency” (percentage of blood glucose data available for duration of sensor wear). The most recent encounter was selected if there were multiple appointments listed. There were no duplicate encounters. Laboratory tests used to identify anemia and chronic kidney disease (CKD) were drawn less than 12 months from the incident HbA1C. We based diagnoses of microvascular disease on previous documentation by a medical provider. These were then confirmed using ICD-9 and ICD-10 billing codes. Nonalcoholic fatty liver disease (NAFLD) required imaging and FibroSure testing to demonstrate fibrosis. There were no specific exclusion criteria. We extrapolated eA1C for comparison by applying the GMI equation to the provided CGM average [GMI (%) = 3.31 + 0.02392 × CGM mean glucose (mg/dL)]. 1
Statistical methods
The absolute difference between GMI and HbA1c was calculated for each patient. This absolute difference was defined as “HbA1c discordance.” Linear regression was used to assess the correlation between HbA1c and average CGM value. The difference between GMI and HbA1c was displayed graphically with a Bland-Altman plot, where the difference between these parameters was plotted on the y-axis and the average of these two parameters on the x-axis. Proportion of patients who were “discordant” was estimated as a simple ratio, where discordance was defined as an absolute difference between GMI and HbA1c in excess of select values. Continuous measures were summarized as mean values with standard deviations. Linear regression was used to model the mean absolute difference between GMI and HbA1c as a function of various factors, including demographics, comorbidities, and all continuous factors were modeled as continuous linear variables.
Results
This study included 641 separate subjects and office visits (Table 1). The mean age at encounter was 45.6 ± 15.3 years and 52% of the 641 subjects were female. Most of the patients were Caucasian (93% among 578 patients who self-reported) with type 1 diabetes (91% among 635 with data) and had their diabetes for over 20 years (63% among 568 with data). Only 16% of patients received noninsulin diabetes medications. The most common CGM device used was the Dexcom G5. The mean duration of CGM wear among all encounters was 24.5 ± 8 days (range of 14–144 days).
Patient Demographics
Microvascular complications were taken from the EMR problem list. These diagnoses were then confirmed using ICD-9 and ICD-10 billing codes.
NAFLD required imaging (ultrasound or CT scan) and FibroSure testing for diagnosis.
CKD was based on an eGFR <60 mL/(min ·1.73 m2).
Anemia was defined using University of Washington hemoglobin laboratory indices. These values differ by gender.
CGM, continuous glucose monitoring; CKD, chronic kidney disease; eGFR, estimated glomerular filtration rate; NAFLD, nonalcoholic fatty liver disease; SD, standard deviation.
The mean HbA1c among encounters was 7.3% ± 1.0% (56 mmol/mol ±11 mmol/mol) and the average of mean CGM glucoses 162 ± 29 mg/dL (8.99 ± 1.61 mmol/L) [range of 85–296 mg/dL (4.72–16.56 mmol/L)]. The patient-specific mean CGM-HbA1c pairs are summarized in the scatter plot shown in Figure 1 along with the least-squares linear regression line through the data. Also shown in Figure 1 is the linear predictor for HbA1c, that is, GMI. Table S1 shows percentage of subjects for absolute GMI-HbA1c differences. Figure S1 shows the absolute GMI-HbA1c differences by HbA1c subgroups.
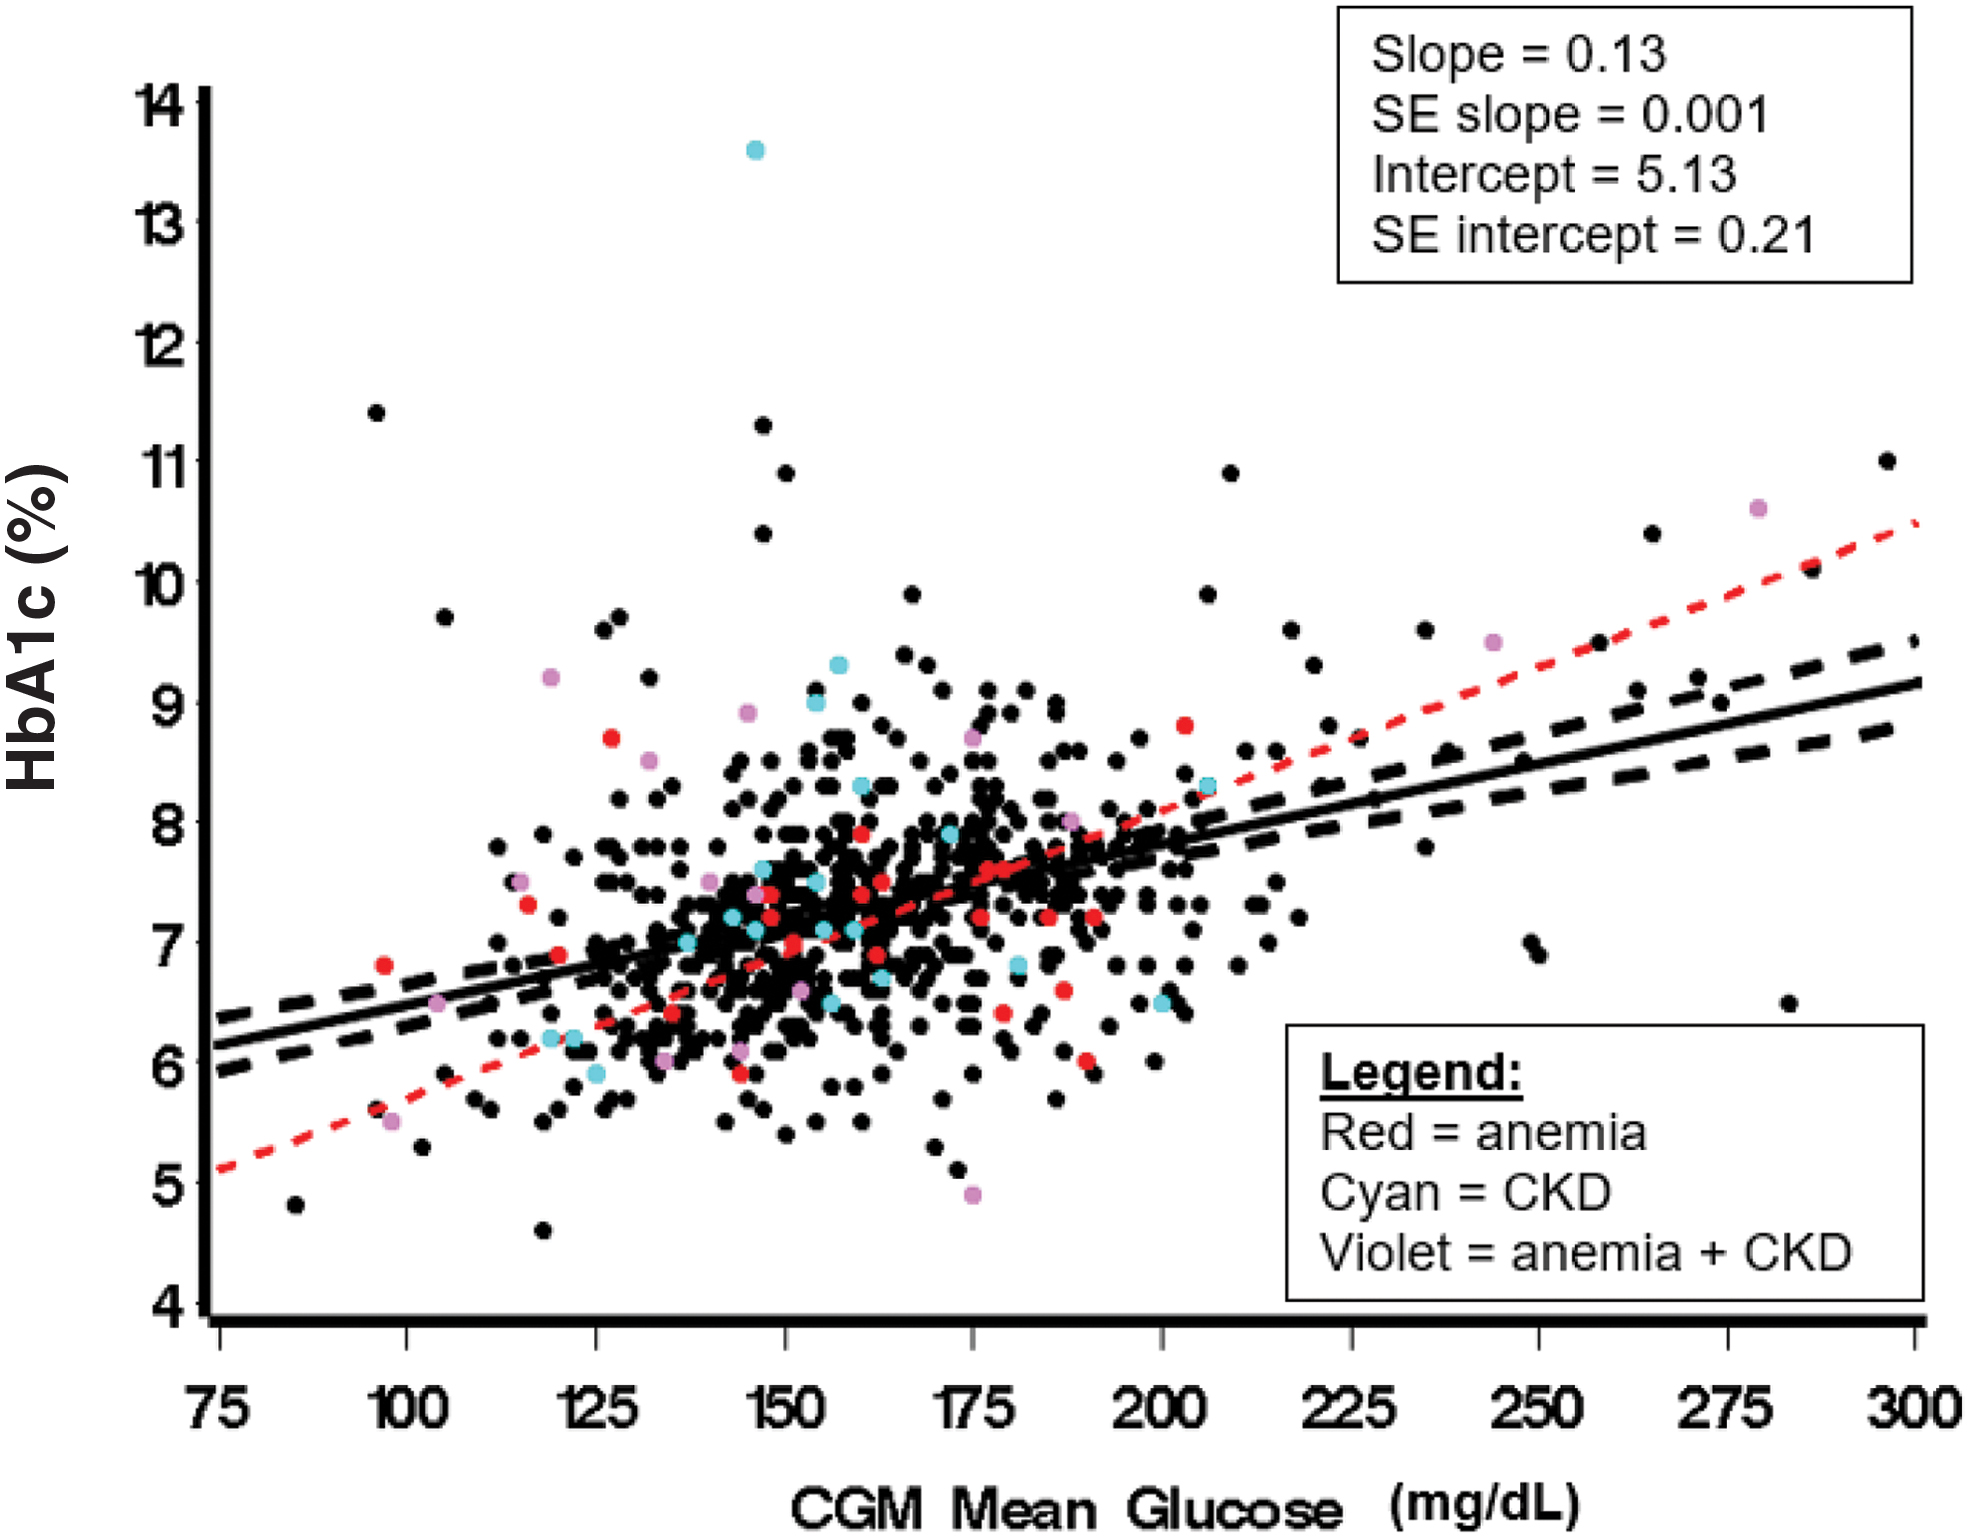
The hashed red line represents the GMI equation. The solid black line is the least-squares regression line fit to the observed data, providing predicted HbA1c for any given CGM mean glucose. CGM, continuous glucose monitoring; GMI, glucose management indicator. Color images are available online.
As a means of visualizing the discrepancy between GMI and measured HbA1c, Figure 2 shows a Bland-Altman plot with difference plotted as a function of the average of these two measures. This plot shows a negative correlation between difference and average such that GMI is higher, on average, than HbA1c when the average value is lower, and GMI is, on average, lower than HbA1c when the average value is higher.
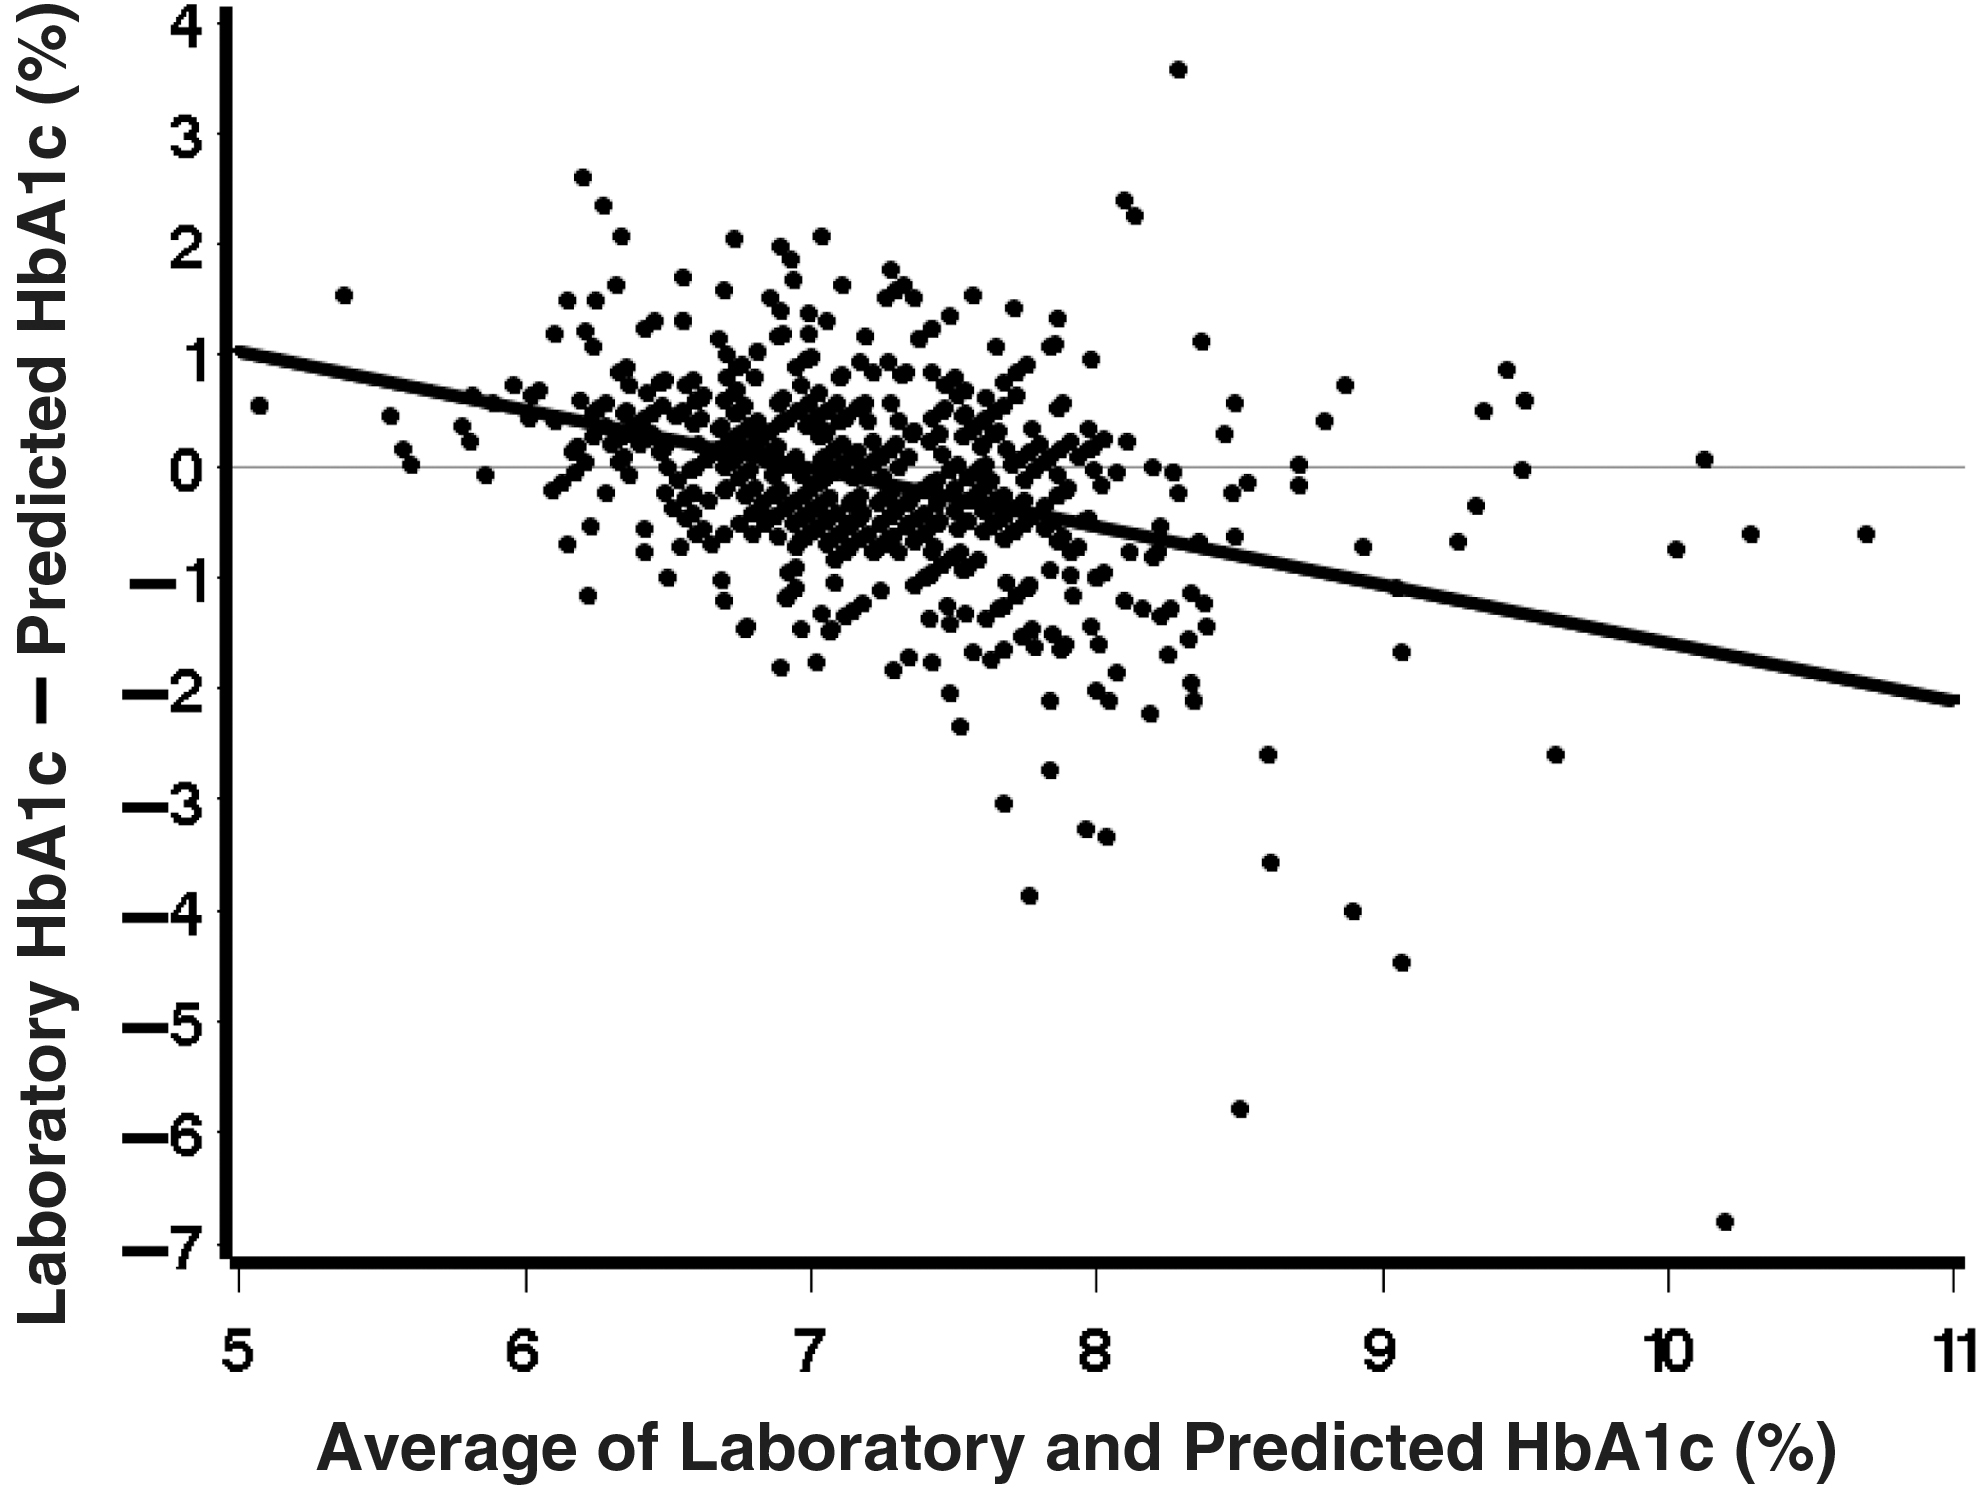
The difference between predicted (GMI) and measured HbA1c is shown on the y-axis. The average of the predicted (GMI) and measured HbA1c is given on the x-axis. The bolded line least-squares regression line fit to the observed data.
The absolute value of HbA1c-GMI discordance ranged from “smaller” to “larger” differences. The root-mean square of the differences (the square root of the mean of the squared differences) was 0.97. Summarized in Figure 3 is the estimated percentage of patients discordant at various chosen levels, and each of these percentages was contrasted to those seen by Bergenstal et al. 1 Only 11% of our patients had discordance <0.1%, while 50% and 22% had differences ≥0.5% and ≥1%, respectively. This compares to 19%, 28%, and 3%, respectively, in report by Bergenstal et al. 1 An important difference between the current data and the Bergenstal report is that the latter was based solely on use of the Dexcom G5 sensor. Given this, we analyzed our data separately among those who used a Dexcom G5 or G6 (n = 309) versus all others (n = 332). Among Dexcom G5/G6 sessions, 10.4% had absolute differences less than 0.1%, while 51.8% and 23% had differences ≥0.5% and ≥1%, respectively. These numbers compared to 11.4%, 47.6%, and 20.8% among sessions that used a sensor other than Dexcom G5/G6. Even the Dexcom G5/G6 data exhibit a more frequent occurrence of disagreement between GMI and HbA1c at various levels than that seen in the Bergenstal report.

The graph is a visual representation of HbA1c discordance calculated by our study as compared to that published in the original GMI article. The percentage of subjects is shown on the y-axis. The HbA1c-GMI discordance is given on the x-axis. Color images are available online.
Given the relatively large mean absolute discrepancy between GMI and HbA1c in our data, we sought to examine the relationship between the mean absolute difference and various factors (including demographics, comorbidities, and parameters associated with CGM) as detailed in Statistical Methods. These results are summarized in Table 2. The absolute mean discrepancy in patients with type 1 diabetes was 0.17% less than in patients with type 2 diabetes, but the difference was not statistically significant (P = 0.08). The absolute mean discrepancy in patients with estimated glomerular filtration rate (eGFR) ≤60 (CKD stage III or worse) was 0.19% higher than patients with GFR >60 (P = 0.05). No other factors showed either a statistically significant difference or an absolute mean difference greater than 0.15% (with the exception of NAFLD, but there were only five such patients, making it difficult to arrive at meaningful conclusions for this comorbidity). Patients with CKD and/or anemia are depicted in Figure 1 as described in the figure legend.
The Impact of Various Factors Including Comorbidities on Glycated Hemoglobin-Glucose Management Indicator Discordance
CKD (stage III or worse) was the only factor to have a statistically significant effect on HbA1c-GMI discordance.
CL, confidence limit; GMI, glucose management indicator; HbA1c, glycated hemoglobin.
Discussion
In this population of 641 individuals with mostly type 1 diabetes, we found surprising levels of discordance between GMI and HbA1c. While only 11% of encounters showed discordance of <0.1%, 50% and 22% have discordances of >0.5% and >1%, respectively. These levels are considerably higher than what is reported in Bergenstal et al. 1 As seen in Figure 2, those with lower HbA1c levels have in general lower GMI levels than the corresponding measured HbA1c, while at higher HbA1c levels the opposite is seen.
There have been various formulas used to calculate an eA1C from CGM data, the first one being the ADAG study. 8 Riddlesworth et al. 5 concluded that with current CGM technology, 10–14 days of CGM data were sufficient to estimate HbA1c in addition to providing a good estimate for other glycemic metrics for a 3-month period. Compared to a shorter amount of time, 14 days or more provides a more accurate estimate of both hypoglycemia and glucose variability. 5 We therefore feel confident that with a minimum of 14 days of CGM data in the current study (and a mean of 24.5 days), the data are adequate and consistent with previous studies. Furthermore, many clinicians and patients noted eA1C a useful metric on the CGM download and it eventually became a core metric on reports. 6 However, the U.S. Food and Drug Administration (FDA) was concerned that eA1C would be interpreted as a direct relationship with measured HbA1c and thus confusion would ensue when the two levels did not match. 1 Thus, an updated equation (GMI) was created based on 528 study subjects from four different clinical trials (456 with type 1 diabetes). The GMI is used today by both clinicians and researchers as a measure of glucose control when it is not possible to access a recent HbA1c. The GMI is of particular importance for patients seen via telemedicine as has become common since the emergence of COVID-19.
We did not expect to find so much discordance between HbA1c and GMI in our clinic population, in particular so much more than that seen in Bergenstal et al. 1 There are many established reasons that HbA1c may misrepresent mean glucose, the most coming from anemia (the direction of error depends on etiology) and hemoglobinopathies. 9 The mean absolute difference between GMI and measured HbA1c was 0.12% higher in patients with anemia than normal hemoglobin levels, but this difference was not statistically significant. Advanced CKD (stages IV and V) is known to underestimate HbA1c relative to mean glucose. 10 We were able to demonstrate this same effect at GFR <60 (CKD stage III or worse) (P = 0.05). There are some rarer factors (certain medications, mechanical heart valves, and untreated hypothyroidism) that can invalidate HbA1c, 11 but these were not present in our population. Previous research suggests that HbA1c is higher in African Americans for any given mean glucose (larger discordance). 12 Our patients were predominantly Caucasian (1% African American) thus negating this potential biological explanation. In summary, we have no obvious physiologic reason for the increased discordance seen in our population.
We considered the accuracy of our institutional HbA1c assay and its effect on discordance. The UW laboratory used two different HbA1c tests during our study period, but they came from the same company and had coefficients of variation less than 2%. We did the same for the different sensors worn by our patients. We felt that the distribution of devices was similar to any academic diabetes practice. A large number of patients (48%) were prescribed the same sensor (Dexcom G5) used to develop GMI. 1 This sensor has a published MARD (mean absolute relative difference) of 9%. 13 Another 7% used a later model of this device (Dexcom G6) that has an identical MARD. 14 More than half of our population wore the same (or very similar) CGM used in the Bergenstal study, and yet, the discordance in these patients was also increased.
It is important to acknowledge that HbA1c remains the most accepted biomarker for assessment of glycemic control. Hemoglobin A1c is still used by insurance companies to determine reimbursements. That said, CGM has become a standard of care in many settings, so it is critical that we find ways to integrate these metrics (including time in range [TIR], time above range [TAR], and GMI) into both clinical care and research. 15 A recent publication demonstrated linear relationships between TIR and TAR and mean glucose and HbA1c. 16 These findings were based on data from previous studies examining the association between TIR and microvascular disease. Beck et al. computed TIR from Diabetes Control and Complications Trial fingerstick data and showed a strong correlation with risk of microvascular complications. 17 Lu et al. and Li et al. determined that decreased TIR and increased glycemic variation is linked to retinopathy and peripheral neuropathy in T2DM. 18,19 In these uncertain times when patients may be nervous about going to a laboratory, we need to have confidence that CGM metrics provide a reasonable surrogate for HbA1c. Our results reinforce the idea that any relationship between mean glucose and HbA1c must be interpreted on an individual basis.
The main strength of our study is the comparison of CGM tracings to concurrent HbA1c measurement in a large number of “real-world” patient encounters. We considered patients with various comorbidities known to affect the accuracy of HbA1c. The main weakness of our analysis is the variable accuracy and need for calibration of the different CGM devices worn by our patients. That said, the discordance we observed among our Dexcom G5 and G6 wearers was similar to those of other sensors. We do think our results would be replicated by other groups as the GMI equation is the same for all devices. We also acknowledge that our population was biased toward type 1 diabetes, which is not representative of the general population. Our results suggest that discordance may be increased in type 2 diabetes even though we could not prove statistical significance. Further investigation is warranted to better understand the relationship of discordance to the risk of diabetes complications. We think it important to emphasize that populations recruited for clinical trials are often different than those observed in cross-sectional studies. It is impossible to determine the impact of our study design on the demonstrated GMI discordance.
Conclusion
Our study shows substantial discordance between GMI and HbA1c in a real-world, academic diabetes clinic. We observed a difference of >0.5% in 50% and >1% in 22% of subjects. CKD was the only comorbidity to have a statistically significant effect on discordance. Clinicians need to be aware that HbA1c may not be as accurate a reflection of mean glucose as previously appreciated. The relationship between mean glucose and HbA1c needs to be interpreted for each patient on an individual basis. It is particularly important that endocrinologists consider CGM metrics as an alternative assessment of glycemic control during this period when obtaining formal laboratory testing could pose a risk to diabetes patients.
Footnotes
Acknowledgments
Dr. J.E.P.'s work was supported by a University of Washington Housestaff Association resident research grant.
Authors Contributions
J.E.P. researched the data and drafted the article; B.M. and J.M. researched the data and edited the article; T.A.G. provided the statistical analysis and edited the article; I.B.H. developed the study concept and drafted the article.
Author Disclosure Statement
J.E.P.: none; T.A.G.: none; B.M.: none; J.M.: none; I.B.H.: research grants from Medtronic Diabetes and Insulet; consulting with Abbott Diabetes Care, Bigfoot, and Roche.
Funding Information
No funding was received for this article.
Supplementary Material
Supplementary Figure S1
Supplementary Table S1
References
Supplementary Material
Please find the following supplemental material available below.
For Open Access articles published under a Creative Commons License, all supplemental material carries the same license as the article it is associated with.
For non-Open Access articles published, all supplemental material carries a non-exclusive license, and permission requests for re-use of supplemental material or any part of supplemental material shall be sent directly to the copyright owner as specified in the copyright notice associated with the article.