




Abstract
Background:
Although guidelines advocate similar continuous glucose monitoring (CGM) targets for insulin-treated persons with type 1 diabetes (T1D) and type 2 diabetes (T2D), it is unclear how these persons differ with respect to hypoglycemia, glucose variability, and other CGM metrics in clinical practice.
Methods:
We used data from 2 multicenter randomized-controlled trials (GOLD and MDI-Liraglutide) where 161 persons with T1D and 124 persons with T2D treated with multiple daily injections were included and monitored with masked CGM.
Results:
Persons from both cohorts had similar mean glucose levels, 10.9 mmol/L (196 mg/dL) in persons with T1D and 10.8 mmol/L (194 mg/dL) in persons with T2D. Time in hypoglycemia (<3.9 mmol/L [70 mg/dL]) was 5.1% and 1.0% for persons with T1D and T2D, respectively (P < 0.001). Corresponding estimates for the standard deviations of mean glucose levels were 4.4 mmol/L (79 mg/dL) versus 3.0 (54 mg/dL) (P < 0.001), for coefficient of variation 41% versus 28% (P < 0.001), and for time in range 38.2% versus 45.3%, respectively (P = 0.004). Mean C-peptide levels were 0.05 nmol/L and 0.67 nmol/L (P < 0.001) for persons with T1D and T2D, respectively.
Conclusions:
Persons with T1D compared with persons with T2D treated with multiple daily insulin injections spend considerably more time in hypoglycemia, have higher glucose variability, and less “time in range.” This needs to be taken into account in daily clinical care and in recommended targets for CGM metrics.
Introduction
Since the 1980s, HbA1c has been the gold standard for measuring glucose control and has served as a basis to evaluate and modify the diabetes treatment regimen. 1 –3 The role of HbA1c as a risk for late complications is well established. 2,3 However, HbA1c has certain shortcomings since it is not capable of revealing information about daily glucose excursions and hypoglycemia. 4
Continuous real time (rtCGM) and flash glucose monitoring Intermittently scanning (isCGM) enable improved metabolic control and daily evaluation of glycemic control and treatment. 5 –7 Use of continuous glucose monitoring (CGM) is increasing, especially in persons with type 1 diabetes (T1D) and in developed countries. However, the relationship between long-term CGM metrics and diabetes complications has not been extensively studied, and hence, it is of interest to investigate the relationship between CGM metrics and HbA1c. 8 –10
Because of differences in the pathophysiology causing hyperglycemia between persons with T1D and type 2 diabetes (T2D), treatment algorithms for glucose-lowering drugs and insulin are different. 11 Recent studies of persons with T1D have observed that monitoring with CGM decreases time in hypoglycemia and improves glycemic control measured by HbA1c. 5 –7 Results from studies of CGM use and glycemic control in persons with T2D are less consistent, as well as in persons with T2D treated with multiple daily insulin injections (MDI). 9,12 –15
The importance of glycemic variability in glucose control and the risk of diabetes complications have been highlighted during the recent years. 16 –21 Moreover, different treatment regimens such as diet, sulfonylurea, and insulin have been found to affect glucose variability. 17,22,23 Previous studies have found that glycemic variability is less in persons with T2D compared with persons with T1D, but most studies included T2D persons with oral hypoglycemic agents or with mixed treatment regimens. 24 –26 Guidelines for CGM metrics recommend similar targets for insulin-treated persons with T1D and T2D. 27 Our aim was to evaluate how persons with TID and T2D treated with MDI differ with respect to CGM metrics, including hypoglycemia, glucose variability, time in range (TIR), and their relation to HbA1c.
Materials and Methods
Cohorts
The data sets from two randomized studies from the same background population of Sweden, including patients aged ≥18 years with diabetes, were the basis for the analysis of CGM metrics and the variables of patient characteristics. Details of the designs of the studies, GOLD (
Inclusion criteria for both studies were treatment with MDI. Both studies used the same CGM system (Dexcom G4, San Diego, CA), and laboratory tests were measured at the Research Centre for Laboratory Medicine at Karolinska University Hospital, Stockholm, Sweden. Inclusion criteria in the two studies were overall similar except that the GOLD-study included persons with T1D and the MDI-Liraglutide study included persons with T2D.
Fasting C-peptide levels were analyzed for all participants screened for both studies. In the GOLD study, persons with T1D were excluded if C-peptide levels exceeded 0.30 nmol/L, and persons with T2D in the MDI-Liraglutide study were excluded if C-peptide levels were below 0.10 nmol/L. The MDI-Liraglutide study excluded persons with very high levels of HbA1c, exceeding 102 mmol/L (11.5%), while the GOLD study had no upper limit for HbA1c.
The GOLD study was designed to evaluate whether CGM improves glycemic control in persons with T1D and was a multicenter randomized trial including 161 persons with a crossover design. Participants used CGM during an 8-week run-in period. The MDI-Liraglutide study was designed to evaluate the effect on HbA1c in persons with T2D adding liraglutide compared with placebo to standard treatment and was a multicenter, double-blind, randomized placebo-controlled trial including 124 participants. CGM was masked during 1 week of the run-in period.
Procedure
We used information from the run-in phases of both trials. Hence, persons with T1D and T2D treated with MDI and using self-measurement of blood glucose for glucose monitoring were included. All persons were monitored with masked CGM. Raw CGM data were used for analyses, except if these were missing, then the manually recorded data of mean glucose and the standard deviations (SDs) from the Electronic Case Report Form were used.
Variables analyzed from both studies were sex, age, height, weight, duration of diabetes, total dose of insulin, daily dose of meal-time insulin, basal insulin, insulin per kg/day, fasting C-peptide level, and HbA1c at screening.
Overall comparisons were performed for conventionally used CGM metrics, including mean glucose level, the SD of mean glucose level, coefficient of variation (CV), and mean amplitude of glycemic excursions (MAGE). CGM metrics of TIR, time above range (TAR), and time below range (TBR) were analyzed in the following intervals in mmol/L (mg/dL): TBR <3.0 (54), TBR <3.9 (70), TIR 3.9–10 (70–180), TAR >10 (180), and TAR >13.9 (250).
Statistical methods
CGM metrics and insulin production, estimated by fasting C-peptide levels, were compared for persons with T1D and T2D between the GOLD and MDI-Liraglutide trials, respectively. Continuous variables are described with mean and SD, median, first and third quartile (Q1; Q3), and categorical variables are described as percentage or number. For comparisons between groups with normally distributed variables, independent t-tests were performed. For comparison between groups not normally distributed, Fisher's nonparametric permutation test was used for continuous variables.
We evaluated the relationship for SD as a function of HbA1c for both persons with T1D and T2D, first by describing the SD level for persons with T1D and T2D as a piecewise linear function of HbA1c levels estimating a nonlinear fit line. We also estimated the means of SD at different levels of HbA1c and tested whether the SD differed for persons with T1D and T2D by performing direct comparisons in persons with similar HbA1c levels. We tested the extent to which the SD differed in persons with T1D and T2D having a mean HbA1c level around 8.0% (7.8%–8.2%) and 9.0% (8.8%–9.2%).
We evaluated whether the association between HbA1c and %TIR differed for persons with T1D and T2D. We tested whether the relationship of %TIR levels as a function of HbA1c differed for persons with T1D and T2D by a covariance analysis between the two groups adjusted for HbA1c together with an interaction analysis T1D/T2D * HbA1c to test if the slopes were parallel. Moreover, in the multivariate analysis, we investigated whether the following variables had an effect on %TIR: age, gender, type of diabetes, body mass index (BMI), C-peptide level, and daily insulin dose. The multivariable analysis was performed to adjust for all confounding baseline variables and study the influence on differences in %TIR given HbA1c.
Tests were two tailed and conducted at 0.05 significance level. All data management was conducted in SAS Software version 9.4.
Results
Patient characteristics
Characteristics of persons with T1D and T2D managed with MDI are shown in Table 1. The persons with T2D included in the MDI-Liraglutide study were older (63.6 years) and had shorter diabetes duration (17.1 years) compared with individuals with T1D (43.8 years and 22.5 years, respectively). They also presented with a higher BMI (33.6 kg/m2 and 27.1 kg/m2, respectively) and used higher insulin doses (105.5 U and 57.3 U, respectively). There were differences in HbA1c T2D 74.6 mmol/mol (9.0%) and T1D 70.1 mmol/mol (8.6%), but there was no significant difference in mean glucose levels of 10.8 mmol/L (194 mg/dL) and 10.9 mmol/L (196 mg/dL), respectively (Table 1 and Table 2). CGM metrics of 3 persons in the MDI-Liraglutide study were lost due to problems with sensors, and for 11 persons in the GOLD and the MDI-Liraglutide, we only had SD and mean glucose due to loss of raw data.
Characteristics of Persons with T1D and T2D Treated with MDI
Differences in the variables describing age, duration of diabetes, C-peptide levels, HbA1c-levels, BMI, and insulin doses between the persons with T1D and T2D are all significant at the 0.05 level.
For categorical variables, n (%) is presented.
For continuous variables, mean (95% CI) and SD are presented.
BMI, body mass index; CI, confidence interval; SD, standard deviation; T1D, type 1 diabetes; T2D, type 2 diabetes.
Comparison of CGM-Metrics in Persons with T1D and T2D Treated with MDI
For continuous variables, mean (SD)/median (Q1; Q3)/n is presented.
For comparison between groups, Fisher's nonparametric permutation test was used for continuous variables. The CI for the mean difference between groups is based on Fisher's nonparametric permutation test.
CV, coefficient of variation; MAGE, mean amplitude of glycemic excursions.
Insulin production
In the MDI-Liraglutide study, the 180 individuals screened for participation had a mean C-peptide level of 0.61 nmol/L (SD 0.49), 12 individuals of the screened persons were excluded due to C-peptide levels below 0.10 nmol/L. Among the 124 individuals included in the study, the mean C-peptide level was 0.67 nmol/L (SD 0.46); of these, 6 persons had C-peptide levels lower than 0.3 nmol/L. In the persons with T1D included in the study, the C-peptide levels was 0.05 (SD 0.04) nmol/L.
CGM metrics
Common CGM metrics for persons with T1D and T2D are shown in Table 2. Persons with T1D and T2D presented with similar mean glucose levels. Persons with T1D had greater glycemic variability in all three evaluated glycemic metrics (SD of mean glucose, CV, and MAGE). The %CV for persons with T2D was 28% (SD 6.4), and 41% (SD 7.0) for persons with T1D. Persons with T1D had an SD of mean glucose of 4.4 mmol/L (79 mg/dL), compared with SD 3.0 mmol/L (54 mg/dL) in persons with T2D. All differences in glycemic variability between persons with T1D and T2D were significant (P < 0.001).
Persons with T1D had a mean %TIR 3.9–10.0 mmol/L (70–180 mg/dL) of 38.1% compared with 45.2% in persons with T2D (P = 0.004). For glucose levels above range, TAR >10.0 mmol/L (180 mg/dL), persons with T1D had a mean of 48.7% and persons with T2D 53.8% (P = 0.035), and for TAR >13.9 mmol/L (250 mg/dL), no significant differences were seen between persons with T1D and T2D (Table 2).
Time spent in hypoglycemia with glucose levels below 3.9 mmol/L (70 mg/dL) was 5.1% in persons with T1D, and 1.0% in persons with T2D (P < 0.001). The greatest relative difference was seen in time spent in hypoglycemia below 3.0 mmol/L (54 mg/dL), where persons with T1D spent 2.1% and persons with T2D spent 0.3% of the time (P < 0.001) (Table 2).
CGM metrics and their relationship with HbA1c
SD of mean glucose generally increased with increasing HbA1c in both persons with T1D and T2D. However, the SD in persons with T1D was increased when compared with T2D patients at all HbA1c levels, as seen in Figure 1. For persons with estimated mean HbA1c of 64 mmol/mol (8.0%), the SD was 4.36 mmol/L in persons with T1D, and 2.70 mmol/L in persons with T2D (P < 0.001). The corresponding SDs with an estimated mean HbA1c of 74 mmol/mol (9.0%) were 4.59 mmol/L in persons with T1D and 3.16 mmol/L in those with T2D (P < 0.001).
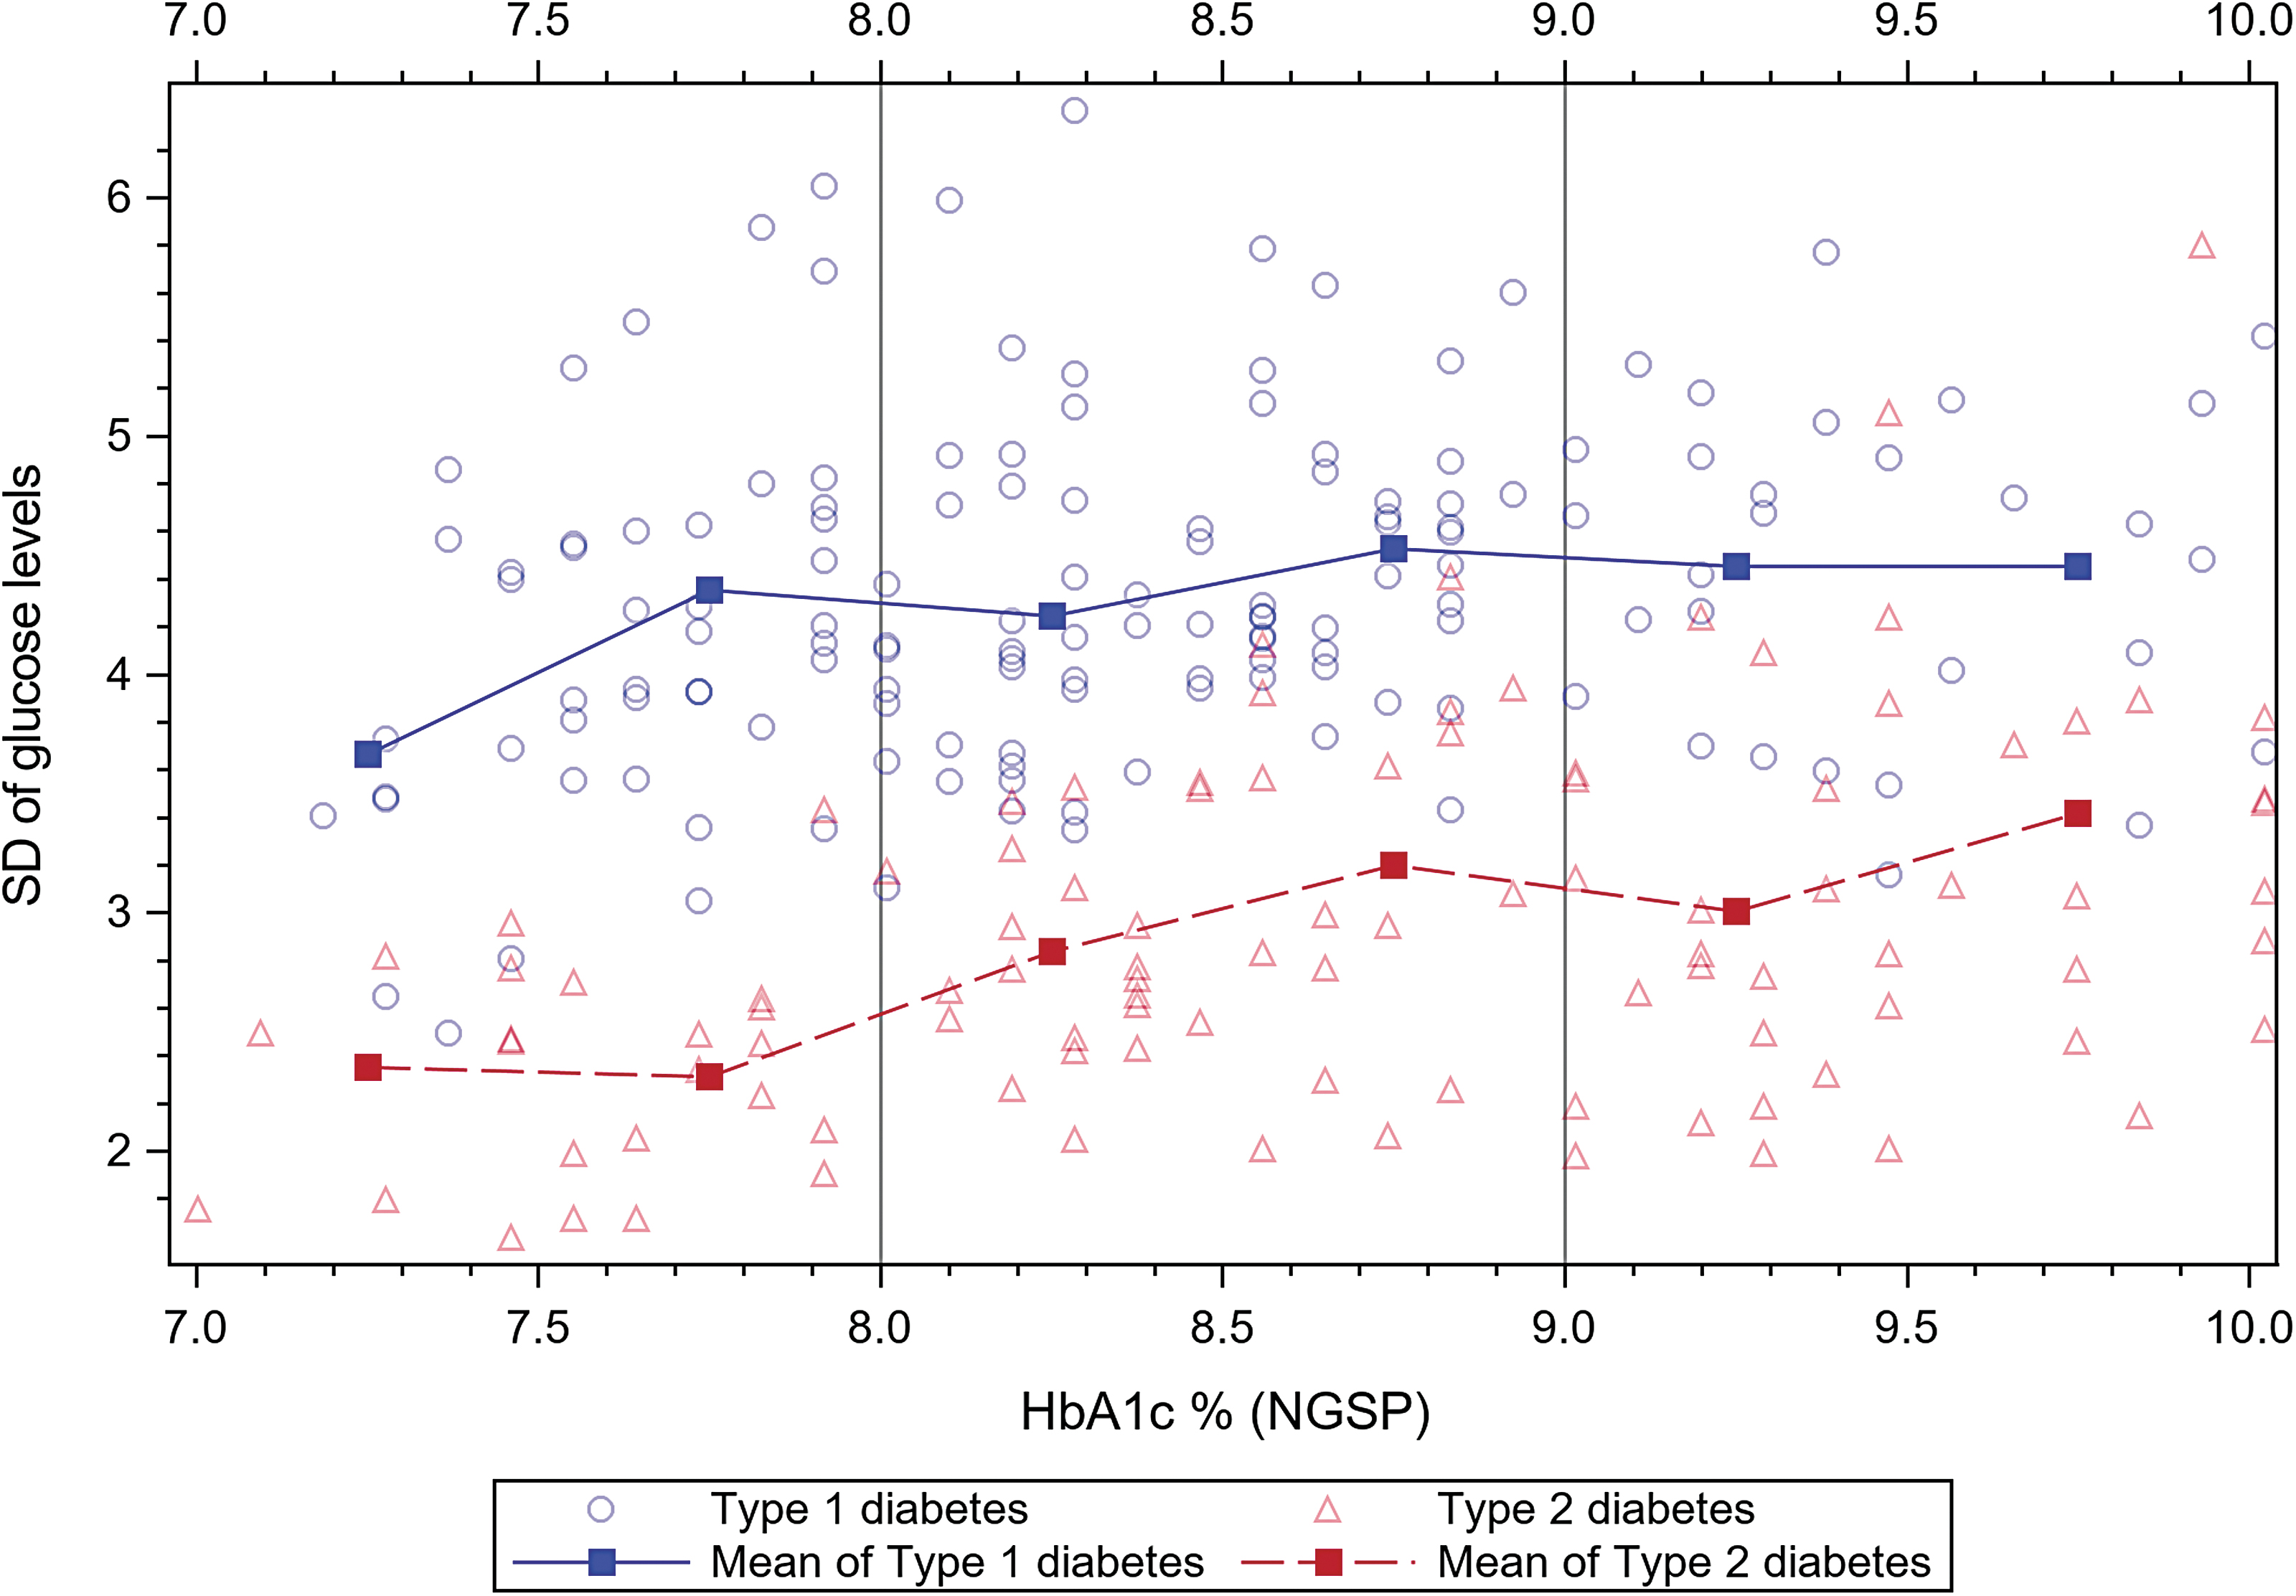
Standard Deviation of glucose levels in mmol/mol related to HbA1c in persons with type 1 and type 2 diabetes.
When different levels of TIR in relation to HbA1c were analyzed, persons with T1D presented lower TIR at the same level of HbA1c compared with persons with T2D with a significant interaction (P < 0.001), and when analyzing the relationship piecewise, this difference was maintained up to HbA1c-level 9.3% (P < 0.001) (Figure 2). For 31%–40% TIR, the corresponding HbA1c levels for persons with T1D and T2D were 70.5 mmol/mol (8.6%) and 76.5 mmol/mol (9.1%), respectively (P = 0.0053). For TIR, 41%–50% HbA1c levels were 66.5 mmol/mol (8.2%) and 73.2 mmol/mol (8.8%), respectively (P = 0.0047). HbA1c levels at TIR 51%–60% were 60.6 mmol/mol (7.7%) and 70.2 mmol/mol (8.6%), respectively (P < 0.001), and at TIR 61%–70%, HbA1c levels were 60.2 mmol/mol (7.7%) and 66.9 mmol/mol (8.3%), respectively (P = 0.056). Between levels of HbA1c 7.6%–8.6%, in persons with T1D, a 0.1% increase in HbA1c corresponded to a decrease of 0.68% in TIR. For persons with T2D, an HbA1c increase of 0.1% corresponded to a decrease in TIR of 1.37% (P < 0.001). When analyzing the level of TIR in both groups and adjusting for variables of age, gender, BMI, daily dose of insulin, and C-peptide level, the estimate of TIR remained significantly different depending on the type of diabetes at a given value of HbA1c.

Percent of Time In Range related to levels of HbA1c in persons with type 1 and type 2 diabetes.
Discussion
In this first study comparing CGM metrics in persons with T1D and T2D treated with MDI, we found considerable differences in many CGM metrics. Persons with T1D overall spent more time in hypoglycemia than persons with T2D (5.1% vs. 1.0%) and presented with clearly higher glycemic variability, with a %CV of 41% versus 28% and an SD of 4.4 mmol/L (79 mg/dL) versus 3.0 mmol/L (54 mg/dL). Persons with T1D had higher HbA1c levels at the same TIR level compared with persons with T2D. Our findings are supported by analyses of CGM metrics related to HbA1c levels in persons with T1D and T2D. Despite having long-standing T2D and MDI, persons in the present study had residual insulin production with an estimated mean fasting C-peptide level of >0.60 nmol/L.
Few studies have been performed comparing CGM metrics and their relation to HbA1c in persons with T1D and T2D, and to our knowledge, this is the first study comparing those groups in persons with MDI treatment. Persons with T2D are heterogeneous as a whole, and in research on CGM and HbA1c, the majority of studies are performed in persons with different treatment regimens including sulfonylurea, basal insulin, premixed insulin, MDI, and continuous Subcutaneous Insulin Infusion. 10,15,25,31,32
In persons with T1D treated with MDI, studies have shown benefits from CGM use with increased TIR and decreased TBR <3.9 mmol/L (70 mg/dL), 5,33 although Beck et al. studied persons with T2D and MDI treatment and found increased TIR using CGM, but without change in TBR <3.9 mmol/L (70 mg/dL). 13 Rama Chandran et al. compared CGM data of persons with T1D and T2D, and the differences between the groups regarding CV and TBR were similar to our results, but the included persons with T2D had mixed insulin regimens. 25
Despite similar means of glucose in the groups, the glucose variability was much higher in the group with T1D, CV 41% compared with CV 28% in the persons with T2D, consistent with results from the DIAMOND trials in persons with T1D and T2D. 6,13 The fact that persons with T1D have a more unstable glucose control was shown by both a higher CV and more time in hypoglycemia. 16,17,20,34
Patients with T1D also spent less TIR compared with persons with T2D, which is of importance since there is growing evidence for the relationship between decreased TIR and complications of diabetes in both persons with T1D and T2D, although most studies use short-term CGM-monitoring. 35 –38 The relationship between %TIR levels and HbA1c in persons with T1D and T2D has been analyzed by Vigersky and McMahon, who found a linear relationship between %TIR and HbA1c, estimating a 0.78% change in HbA1c for each 10% change in TIR. It should be noted that in this analysis by Vigersky and McMahon, the %TIR at the same HbA1c was higher in studies including persons with T2D compared with studies including persons with T1D exclusively, indicating an increased HbA1c at all levels of TIR in persons with T2D compared with T1D. 10
We found the TIR level adjusted for confounders to be significantly related to HbA1c level and type of diabetes. Apart from the increased TBR in persons with T1D, the difference in the relationship between HbA1c and TIR% in persons with T1D and T2D is probably also explained by a higher glucose variability, which accelerates the glycation and increases the levels of HbA1c. 26,39
Longer diabetes duration, as well as the need for insulin treatment, is known to be associated with lower endogenous insulin production in persons with T2D. 40,41 In many instances such as clinical settings, guidelines, and trials, persons with long-standing T2D treated with MDI have been assumed to mimic the endogenous insulin production deficiency in persons with T1D. 27,42,43 However, that we found persons with T2D treated with MDI with a medium diabetes duration of 17 years and a mean fasting C-peptide level >0.6 nmol/L compared with 0.05 nmol/L in persons with T1D contradicts this assumption. In the current study where persons with T2D had mean daily insulin doses >100 U, considerably higher than T1D patients (mean daily insulin doses of 57 U), insulin treatment is, in many instances, likely a tool for exceeding insulin resistance, rather than solely substituting insulin deficiency in contrast to persons with T1D.
There are several important implications from the current study. First, regarding the guidelines of CGM metrics, persons with T2D treated with insulin have similar CGM metric targets as persons with T1D and may therefore be viewed as a homogenous group by clinicians. 27 The fact that persons with very long-standing T2D managed with MDI differ considerably from persons with T1D indirectly shows that most persons with T2D managed with insulin differ from persons with T1D.
Persons with T2D managed with MDI spent five times less time in hypoglycemia than T1D patients, despite T1D patients who are likely being better in adjusting meal-time insulin since they generally have had the disease since childhood and received extensive instruction on insulin adjustment from health professionals. 44 For more advanced hypoglycemia (<3.0 mmol/L [54 mg/dL]), persons with T1D had seven times more time in this range than persons with T2D.
Moreover, the critical association between TIR and HbA1c level, often used since HbA1c has a more established association with complications, differed for persons with T1D and T2D. 3,10,45,46 At all levels of TIR, persons with T1D had lower corresponding HbA1c levels than persons with T2D probably due to differences in glycemic variability and more time spent in hypoglycemia. 26,39 These findings could support that persons with T2D and MDI-treatment with low-glucose variability could aim at achieving %TIR over 70% without exceeding the maximum recommended level of TBR.
Another implication is that persons with T2D managed with MDI need to be treated differently than persons with T1D. In most instances, insulin resistance, rather than insulin deficiency, is the major problem. Persons with T2D generally need treatments reducing insulin resistance, including lifestyle changes with weight reduction, increased physical activity, and specific drugs. 11,47 However, persons with T2D with MDI are heterogeneous, as shown here, where ∼7% of screened MDI patients had very low (fasting C-peptide <0.1 nmol/L) or no insulin production and likely need to be viewed as a heterogeneous group of persons both in clinical practice and clinical trials. So far both guidelines for treatments (e.g., use of CGM and clinical trials) have viewed MDI-managed T2D persons as one group. 13,15,27,30 Effects on glycemic metrics have been modest by rtCGM and isCGM. 12,13,15 It is likely important both in studies and clinical practice to grade persons with respect to endogenous insulin production to understand whether the need is mainly insulin substitution with intensive glucose monitoring or if the person has a barrier to obtaining glycemic targets due to insulin resistance. Future trials stratifying persons on endogenous insulin production are essential to better understand effects of various treatments.
Strengths of this study are the comparison between persons with T1D and T2D from the same background population, using the same central laboratory and the same CGM system for masked CGM data. This is advantageous since many studies on variability and CGM metrics focus separately on persons with T1D or T2D or sometimes using a mixed population. 6,13,28 Another strength is that comparisons were made between individuals with similar treatment in the form of MDI. Moreover, persons with T1D and T2D had similar overall glycemic control, which is important for comparisons.
This study also has some limitations; the length of masked CGM could be too short to fully estimate CGM metrics. 48 Although this was the same length or longer than other similar studies, but somewhat shorter than current recommendations of 14-day monitoring. 10,27 Moreover, it should be noted that the cohort was limited to persons with HbA1c ≥7.5% (58 mmol/mol) and that persons with T2D with BMI <27.5 kg/m2 were excluded.
This study was designed to prioritize the comparison of CGM metrics in persons with similar treatment and therefore included persons with T1D and Self-monitoring Of Blood Glucose and persons with T2D who were not on treatment with GLP-1 or SGLT-2 inhibitors. However, this may not reflect the glycemic variations in persons with modern treatment since CGM in persons with T1D, and GLP-1 or SGLT-2 in persons with T2D, all reduce the glycemic variability. It is likely that in persons with T2D and BMI <27.5 kg/m2 managed with MDI, remaining insulin production is somewhat lower and hence glycemic variability and time in hypoglycemia may be higher. 41 Of note, the key comparisons in the current study were those between central CGM-metrics between persons with T1D and T2D although other characteristics were also compared. In the current study, no adjustment of p-values was performed for multiple testing.
Conclusions
Persons with T1D treated with MDI spend considerably more time in hypoglycemia, have higher glucose variability, and less TIR compared with persons with T2D despite both groups having similar mean glucose levels. The relationship between HbA1c and %TIR differs in persons with T1D and T2D, resulting in increased HbA1c at the same %TIR in persons with T2D. The differences found between persons with T1D and T2D managed with MDI need to be taken into account in daily clinical care, trial design, and in recommended targets for CGM metrics.
Footnotes
Authors' Contributions
S.H., I.H., M.E., S.S., H.A., S.D., A.-M.S., and M.L. participated in critical revision of the article and gave final approval to submit the article for publication. S.H., M.L., and H.A. participated in the analysis and interpretation of data. S.H. and M.L. contributed to the conception and design of the study. S.H. drafted a first version of the article. I.H., S.S., S.D., and M.L. were responsible for acquisition of the data. S.H. is the guarantor of this work and, as such, had full access to all the data in the study and takes responsibility for the integrity of the data and the accuracy of the data analysis.
Acknowledgments
The authors thank the participating sites.
Author Disclosure Statement
The authors declared no potential conflicts of interest with respect to the research, authorship, and/or publication of this article. M.L. has been a consultant or received honoraria from AstraZeneca, Boehringer Ingelheim, Dexcom, Eli Lilly, MSD, Rubin Medical, and Novo Nordisk and received research grants from AstraZeneca, Dexcom, and Novo Nordisk. I.H. has been a consultant for Abbott Diabetes Care, Adocia, Intarcia, Roche, Bigfoot, and Valeritas. S.S. has received lecture fees from Sanofi, Bayer, Novo Nordisk, MSD, and Boehringer Ingelheim. M.E. is an employee and minor shareholder of Novo Nordisk. No other potential conflicts of interest relevant to this article were reported.
Funding Information
This study was financed by grants from the Swedish State under an agreement between the Swedish Government and the County Councils Concerning Economic Support of Research and Education of Doctors, Region Vastra Götaland, and grants from the Novo Nordisk Foundation. The funders had no role in collecting data, study design, interpretation of data, or the decision to submit the article for publication.