
Abstract
Background:
Continuous glucose monitoring (CGM)-derived metrics, including time in range (TIR), are attracting attention as new indicators, beyond hemoglobin A1c, of glycemic control and diabetes complications. This study investigated the associations between CGM-derived TIR, hyperglycemia, and hypoglycemia metrics and cardiovascular autonomic neuropathy (CAN) in patients with type 2 diabetes.
Methods:
A total of 284 patients with type 2 diabetes who underwent CGM using GOLD™ (Medtronic MiniMed) for 3 days or iPro™2 (Medtronic MiniMed) for 6 days and autonomic function tests within 3 months based on outpatient data were recruited. The definition of CGM-derived metrics was subject to the most recent international consensus. CAN was defined as an abnormal result in two or more parasympathetic test, and the severity of CAN was estimated as the sum of the scores of the five cardiovascular autonomic function tests.
Results:
A total of 84 patients (29.6%) were diagnosed with CAN, and the mean TIR was 57.0% ± 7.0%. A multiple logistic regression analysis revealed that the odds ratio (OR) of presence of CAN was 0.876 [95% confidence interval (CI): 0.79–0.98] per 10% increase in the TIR 70–180 mg/dL, after adjusting for age, sex, diabetes duration, any medications, and glycemic variability. A 10% increase in the TIR was significantly inversely associated with the severity of CAN (OR: 0.89, 95% CI: 0.81–0.98). Among the metrics of hyperglycemia, each 10% increase in a time above range (TAR) >180 mg/dL was also independently correlated with the presence of CAN (OR: 1.141, 97.5% CI: 1.01–1.29) and the severity of CAN (OR: 1.13, 97.5% CI: 1.01–1.26).
Conclusion:
A TIR 70–180 mg/dL and a TAR >180 mg/dL were significantly associated with CAN in outpatients with type 2 diabetes.
Introduction
Cardiovascular autonomic neuropathy (CAN) caused by damage to autonomic nerve fibers that innervate the heart and blood vessels is one of the most serious complications of diabetes, leading to abnormal heart-rate control and vascular dynamics dysfunction. 1 In addition, since CAN is an independent predictor of major cardiovascular events, including silent myocardial infarction, and reduces the life expectancy of patients with diabetes, it is important to prevent and recognize CAN promptly in the clinical setting. 2 –5
As evidence supporting the use of advanced glucose monitoring options for the management of diabetes has been on the rise recently, studies are emerging that indicate that chronic complications of diabetes are linked to glycemic variability and hypoglycemia as well as chronic hyperglycemia. In this sense, continuous glucose monitoring (CGM) overcomes several limitations of existing intermittent measurement methods, such as hemoglobin A1c (HbA1c) or self-monitoring of blood glucose, and can not only provide data on the mean glucose level and glycemic variability but can also determine the percent of time spent in hypoglycemia, hyperglycemia, and the target range. 6 –9
Among CGM-derived metrics, time in range (TIR) is the simplest and most intuitive key indicator of the quality of glucose control throughout the day and TIR has been proposed as an internationally standardized CGM parameter for glycemic targeting in the clinical setting. 10 Several studies have shown to date that TIR and other key parameters are correlated with the clinical outcomes of type 2 diabetes. According to the results of previous studies of patients with type 2 diabetes, TIR has been significantly linked to a lower presence of more advanced diabetic retinopathy and each 10% increase in the TIR 70–180 mg/dL was associated with a reduced risk of abnormal carotid intima-media thickness and albuminuria by 6.4% and 6.0%, respectively. 11 –13
Meanwhile, CAN has been reported to be associated with glucose variability as well as hypoglycemia as measured by CGM, in patients with type 1 diabetes. 14,15 Even in cross-sectional studies involving patients with type 2 diabetes, it was reported that glycemic variability measured by blinded CGM was associated with heart rate variability, which is one of the earliest indicators of CAN and the presence of CAN. 16,17
However, to date there has been no study assessing the association between CAN and CGM metrics derived from professional CGM in a blinded manner in patients with type 2 diabetes in an outpatient setting, which would offer real-world clinical data. Therefore, this study will describe the relationship between CGM metrics and CAN in outpatients with type 2 diabetes.
Methods
Study population
The patients included in this study were those who underwent CGM and autonomic function testing at the same time or within 3 months of each other at the Division of Endocrinology and Metabolism of Samsung Medical Center, Seoul, Republic of Korea, from March 2009 to July 2019. Cardiovascular autonomic function tests were routinely performed on all patients to screen for diabetes complications.
Patients with type 1 or gestational diabetes mellitus (n = 108); cancer who were undergoing treatment (n = 5); a history of thyroid dysfunction (n = 17); a history of myocardial infarction, revascularization, or stroke (n = 39); severe liver disease defined as a Child–Pugh score of >7 points (n = 5); an estimated glomerular filtration rate of <30 mL/min/1.73 m2 as derived from the Chronic Kidney Disease Epidemiology Collaboration formula; or lack a of relevant clinical data such as HbA1c (n = 2) were excluded (Fig. 1). Finally, a total of 284 patients were included in this study.
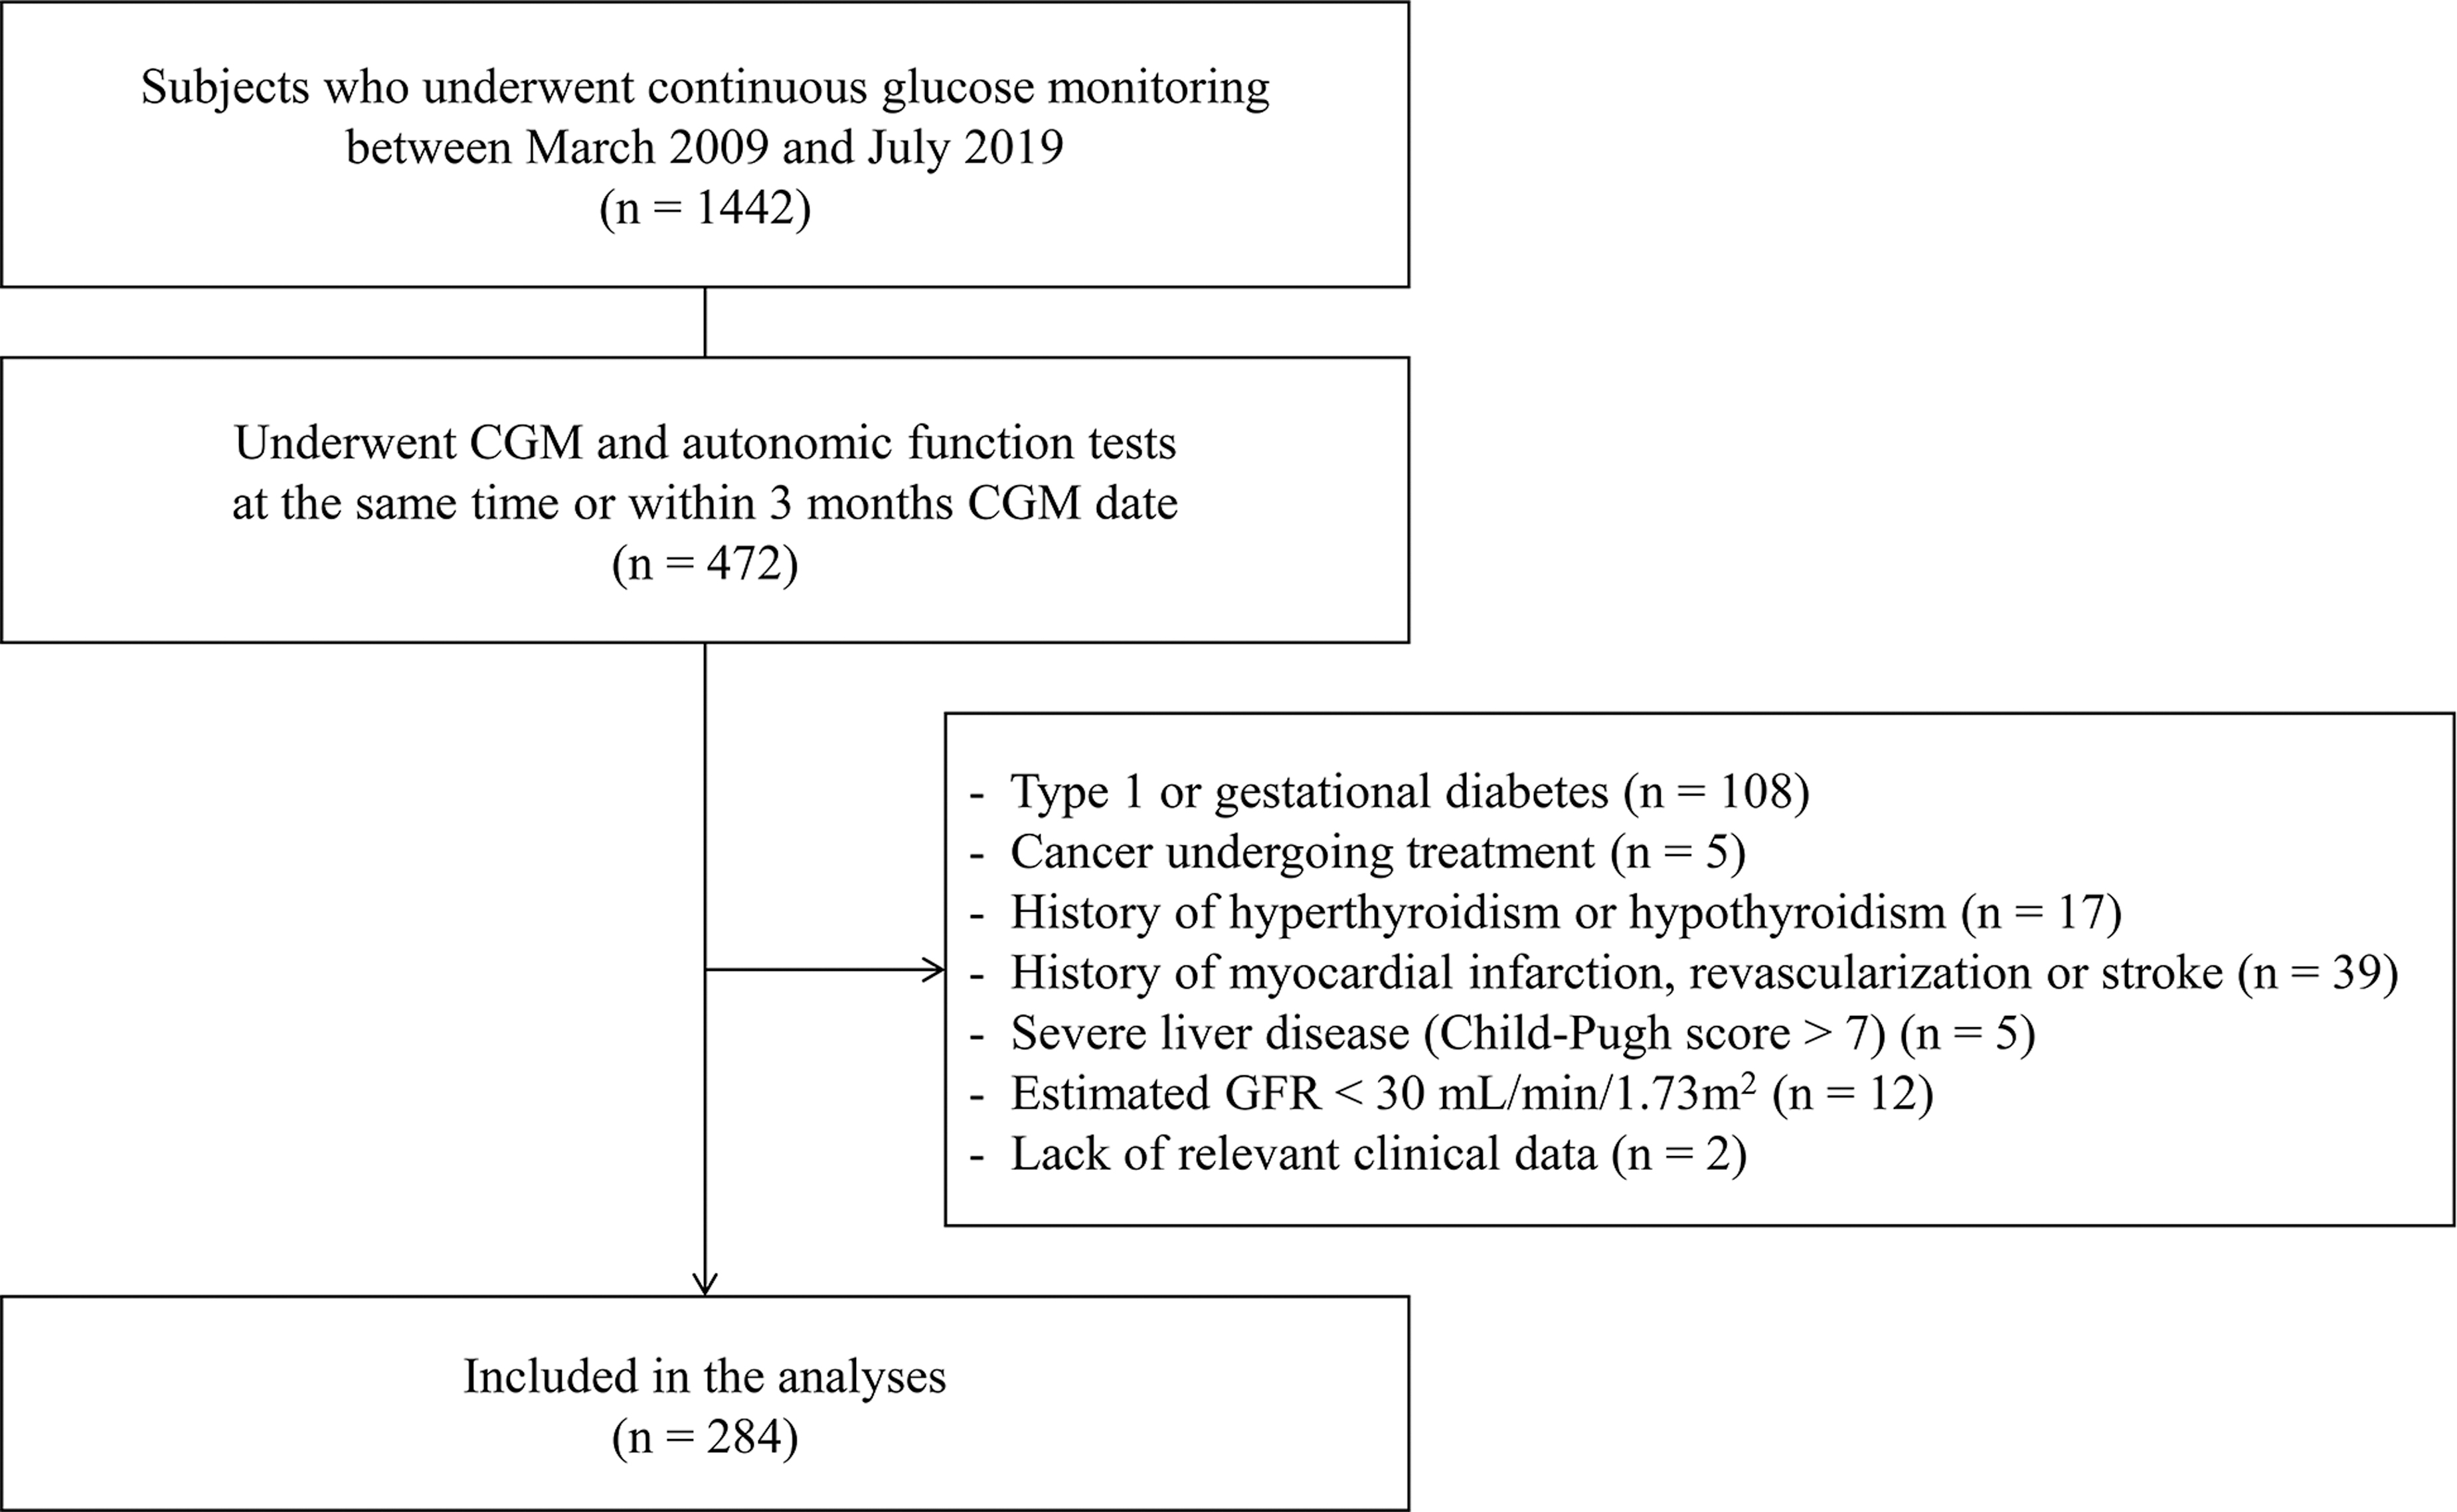
Inclusion and exclusion criteria for the study population. CGM, continuous glucose monitoring; GFR, glomerular filtration rate.
The protocol for this study was approved by the Institutional Review Board of Samsung Medical Center (no. 2020-03-111-001).
Clinical variables and biochemical measurements
Anthropometric measurements, such as the height and weight of study participants, were collected and used to calculate the body mass index (kg/m2). Systolic and diastolic blood pressure values were recorded as the mean of two blood pressure values measured with the patient remaining in a stable sitting position for 5 min or longer. At the time of CGM, blood samples were collected for biochemical measurements, including HbA1c, total cholesterol, high- and low-density lipoprotein cholesterol, triglycerides, C-peptide, and creatinine, after a 12-h overnight fast.
Data on the patients' medical history and use of antihypertensive medications, such as angiotensin-converting enzyme inhibitors, angiotensin receptor blockers, and β-blockers, were collected. In addition, lipid-lowering agents and antidiabetic agents in use at the time of CGM implementation were reviewed. Hypertension was defined as having a blood pressure of 140/90 mmHg or higher or by the current use of antihypertensive medications.
CGM metrics
The CGM was conducted in a blinded manner using the GOLD™ system (Medtronic MiniMed, North Ridge, CA) for 3 consecutive days (n = 267) or iPro™2 (Medtronic MiniMed) for 6 days (n = 17), and the collected data were retrospectively reviewed. The CGM devices were calibrated by measuring participant capillary blood glucose levels at least twice a day from the 1st day of CGM. In accordance with the international consensus recommendations for CGM metrics, TIR was defined as the percentage of time spent in the target blood glucose level range of 70–180 mg/dL. 18 The CGM metrics of hyperglycemia [time above range (TAR) >250 mg/dL and >180 mg/dL] hypoglycemia [time below range (TBR) <70 mg/dL and <54 mg/dL], and glycemic variability [standard deviation (SD), coefficient of variation (CV)] were also calculated.
Assessment of CAN
CAN was evaluated using the results of five cardiovascular autonomic function tests proposed by Ewing et al. 19 Patients were asked to avoid vigorous physical activity, smoking, and drinking alcohol for 24 h before the test, and to stop consuming coffee and food for 3 h before the test. Drugs which might have affected the test result, such as antihistamines, antidepressants, β-blockers, acetaminophen, and diuretics, were stopped 12 h before the test.
Assessments of heart rate response to deep breathing (exhalation:inhalation ratio), standing (30:15 ratio), and the Valsalva maneuver (Valsalva ratio) were performed to evaluate parasympathetic functions. We evaluated sympathetic functions by measuring blood pressure responses to standing and to a sustained handgrip. The heart rate response was assessed automatically from electrocardiography recordings captured using the DICAN evaluation system (Medicore Co., Ltd., Seoul, Korea).
According to the age-specific reference, each of the three parasympathetic function tests was scored as zero points for normal or one point for abnormal results, while each of the two sympathetic function tests was scored as zero points for a normal result, 0.5 points for a borderline result, or one point for an abnormal result. 16
CAN was defined as an abnormal result in two or more parasympathetic test; the severity of CAN was evaluated using the sum of the partial scores of the five cardiovascular autonomic function tests and categorized as either 0–1.5 points, 2–2.5 points, or 3–5 points.
Statistical analysis
Continuous variables were expressed as means (SD), and categorical variables were expressed as ratios or percentages. For comparing baseline characteristics according to the presence or absence of CAN, the Student's t-test or Mann–Whitney U test was used for continuous variables, while the chi-square test was performed for categorical variables.
Multiple logistic regression analyses were performed to assess the odds ratio (OR) and 95% confidence interval (CI) for the associations between the presence of CAN and a 10% increase in the TIR 70–180 mg/dL, a 10% increase in the TAR (>180 mg/dL, >250 mg/dL), and TBR (<54 mg/dL, <70 mg/dL), after adjusting for confounding variables such as age, sex, duration of diabetes, and other known risk factors for CAN. A dominance analysis was performed to compare the relative importance of those CGM parameters that were statistically significant in logistic regression analysis for prevalence of CAN.
We also conducted subgroup analyses to evaluate the interaction between subgroups with regard to age (<65 vs. ≥65), duration of diabetes (≤10 years vs. >10 years), glucose status (HbA1c 7.5% vs. >7.5%), and the use of insulin or medications that can cause hypoglycemia. In addition, multivariate ordered logistic regression analysis was used to evaluate the association between the severity of CAN and CGM parameters, while a trend test across ordered groups was used to evaluate the presence of any trend for TIR 70–180 mg/dL according to the total cardiovascular autonomic function test score.
Statistical analysis was executed using the Statistical Package for the Social Sciences version 25.0 (IBM Corporation, Armonk, NY) and Stata version 16.0 (StataCorp LLC, College Station, TX). A P-value of <0.05 was considered statistically significant in two-tailed test. In case of multiple testing, P-value and CI were adjusted using Bonferroni method.
Results
Baseline characteristics
A total of 284 subjects were classified into two groups according to results of cardiovascular autonomic function testing: the CAN group (n = 84, 29.6%) and the non-CAN group (n = 200, 70.4%). The baseline characteristics of the enrolled study participants according to the presence of CAN are shown in Table 1. The mean age of the entire study population was 57.4 ± 10.5 years, and 58.5% were men. The mean diabetes duration was 12.0 ± 8.5 years and the mean HbA1c level was 8.3% ± 1.4%. Patients with CAN tended to be younger, with higher HbA1c concentrations; higher diastolic blood pressure values; and higher levels of total cholesterol, triglycerides, and low-density lipoprotein cholesterol relative to study participants without CAN. There were no differences between the two groups in terms of the proportions of patients using the aforementioned medications, except for the proportion of those using angiotensin-converting enzyme inhibitors/angiotensin receptor blockers and lipid-lowering agents.
Baseline Characteristics According to the Presence of Cardiovascular Autonomic Neuropathy (n = 284)
ACEI, angiotensin-converting enzyme inhibitors; ARB, angiotensin receptor blocker; BMI, body mass index; CAN, cardiovascular autonomic neuropathy; CGM, continuous glucose monitoring; CV, coefficient of variation; DBP, diastolic blood pressure; DPP-4, dipeptidyl peptidase-4; eGFR, estimated glomerular filtration rate; GLP-1, glucagon like peptide-1; GMI, glucose management indicator; HbA1c, hemoglobin A1c; HDL-C, high-density lipoprotein cholesterol; LDL-C, low-density lipoprotein cholesterol; SBP, systolic blood pressure; SD, standard deviation; SGLT-2, sodium glucose cotransporter-2; TAR, time above range; TBR, time below range; TIR, time in range.
The mean CGM time was 77.0 ± 23.7 h among patients without CAN and 76.9 ± 19.2 h among study participants with CAN, which was a comparable amount of time (P = 0.782). The mean TAR >180 mg/dL was significantly higher in study participants with CAN than in those without CAN (34.4 ± 27.3 vs. 41.1 ± 27.6, respectively; P = 0.049), while the mean TBR <70 mg/dL (2.9 ± 5.6 vs. 1.6 ± 3.7, respectively; P = 0.018) and TBR <54 mg/dL (1.2 ± 3.7 vs. 0.5 ± 1.4, respectively; P = 0.021) were significantly lower in the CAN group. Other CGM metrics were not significantly different between the two groups.
CGM target achievement according to the presence of CAN
The rates of achieving the CGM targets according to the presence of CAN are shown in Figure 2. The targets were selected according to the recent international consensus guidelines for individuals younger than the age of 65 years. When compared with study participants without CAN, those with CAN had markedly lower rates of achieving the targets of TIR 70–180 mg/dL >70% and TAR >180 mg/dL <25%. However, other CAN metrics, including the CV, were comparable between the two groups.

Prevalence of subjects who achieved the CGM targets according to the presence of cardiovascular autonomic neuropathy in study participants younger than 65 (n = 220).
Associations between TIR 70–180 mg/dL and CAN
To investigate the relationship between change in the amount of TIR 70–180 mg/dL and CAN, multivariate logistic regression analyses were conducted. As shown in Table 2, the OR for the presence of CAN was 0.894 (95% CI: 0.81–0.99) per 10% increase in a TIR 70–180 mg/dL in the model adjusted for age, sex, and duration of diabetes (Table 2, Model 1). The association was still significant after further adjustment for the CV as a glycemic variability metric and the use of insulin, oral hypoglycemic agents, aspirin, lipid-lowering agents, and β-blockers (Table 2, Model 4; Supplementary Table S1) (OR: 0.876, 95% CI: 0.79–0.98). However, the correlation between TIR and CAN was not significant in the model adjusted for HbA1c (Table 2, Model 5). On subgroup analyses (Supplementary Table S2), subjects younger than 65 years, those with diabetes for more than 10 years, those with an HbA1c concentration of <7.5%, and those receiving antidiabetic drugs that could cause hypoglycemia showed a strong inverse association between TIR and CAN, but no interaction was observed (all P for interaction >0.05).
Association between Time in Range (70–180 mg/dL) and the Presence of Cardiovascular Autonomic Neuropathy
Model 1: adjusted for age, sex, and duration of diabetes.
Model 2: adjusted for model 1 plus any medication (insulin, OHA, aspirin, dyslipidemia).
Model 3: adjusted for model 2 plus CV.
Model 4: adjusted for model 3 plus β-blocker.
Model 5: adjusted for model 4 plus HbA1c.
Odds ratios represent per 10% increase in TIR.
CI, confidence interval; OHA, oral hypoglycemic agent; OR, odds ratio.
Associations between other core CGM parameters and CAN
Table 3 shows the relationship between CAN and other CGM core metrics, including TAR, and TBR. Only a 10% increase in the TAR >180 mg/dL among hyperglycemic metrics was significant after adjustment for confounding factors. However, with regard to hypoglycemia, neither TBR <70 mg/dL nor TBR <54 mg/dL were significantly associated with CAN in the adjusted models. A dominance analysis was performed to determine the relative importance of TIR and TAR >180 mg/dL, and the result was in order of TAR >180 mg/dL and TIR 70–180 mg/dL (Supplementary Table S3).
Association between Other Continuous Glucose Monitoring Parameter and Cardiovascular Autonomic Neuropathy
Model 1: adjusted for age, sex, and duration of diabetes.
Model 2: adjusted for model 1 plus any medication (insulin, OHA, aspirin, dyslipidemia).
Model 3: adjusted for model 2 plus CV.
Model 4: adjusted for model 3 plus β-blocker.
Model 5: adjusted for model 4 plus HbA1c.
Odds ratios represent per 10% increase in TIR and TAR.
Adjusted using Bonferroni method.
Associations between CGM parameters and the severity of CAN
Finally, we explored the relationship between the severity of CAN, as assessed by total cardiovascular autonomic function test scoring and CGM parameters by ordered logistic regression analysis (Table 4). As previously mentioned, the total cardiovascular autonomic function test score was categorized as 0–1.5 points (n = 171), 2–2.5 points (n = 82), and 3–5 points (n = 31). 20 A higher TIR was significantly inversely associated with the presence of advanced CAN (Table 4, Model 4) (OR: 0.89, 95% CI: 0.81–0.98). Other CGM parameters were not statistically significant, but an increase in the TAR >180 mg/dL, among the indicators of hyperglycemia, markedly increased the odds of advanced CAN (Table 4, Model 4) (OR: 1.13, 97.5% CI: 1.01–1.26). The relationship between the total cardiovascular autonomic function test score and TIR is shown in Figure 3; as the total cardiovascular autonomic function test score increased, the TIR tended to decrease in a statistically significant manner (P for trend <0.001).
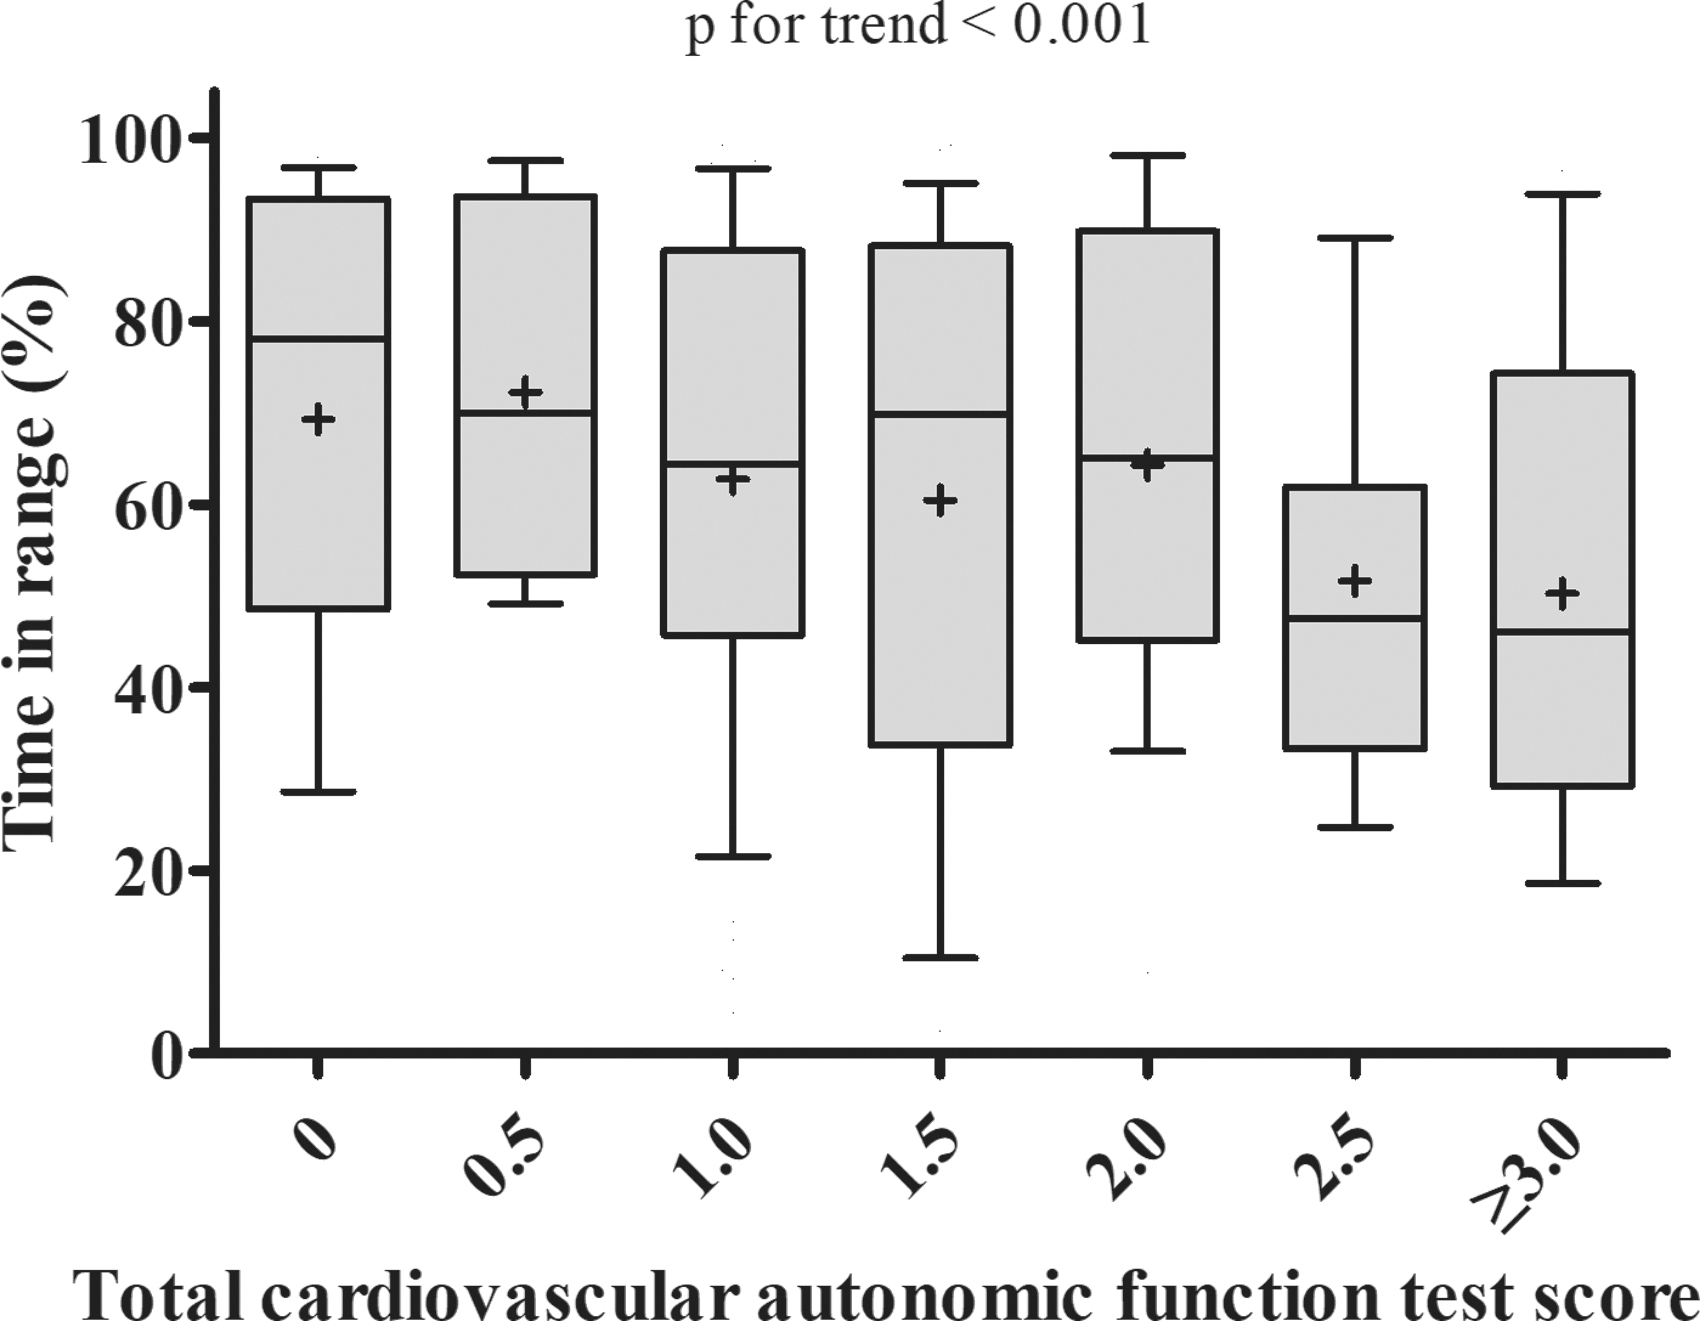
Boxplot of time in range according to total cardiovascular autonomic function test score. The box represents the upper and lower quartiles. Each + and horizontal line in the box indicates the mean and median value of time in range, respectively. The bar denotes 10–90 percentiles.
Ordered Logistic Regression Analysis of the Associations between Continuous Glucose Monitoring Parameters and the Severity of Cardiovascular Autonomic Neuropathy
Model 1: adjusted for age, sex, and duration of diabetes.
Model 2: adjusted for model 1 plus any medication (insulin, OHA, aspirin, dyslipidemia).
Model 3: adjusted for model 2 plus CV.
Model 4: adjusted for model 3 plus β-blocker.
Model 5: adjusted for model 4 plus HbA1c.
Odds ratios represent per 10% increase in TIR and TAR.
Adjusted using Bonferroni method and 97.5% CI.
Discussion
To our knowledge, this study is the first to report a significant inverse association between a CGM-derived TIR 70–180 mg/dL and the presence of CAN in outpatients with type 2 diabetes. This association was maintained even after adjusting for various confounding factors, including the CV for the glycemic variability metrics or the use of β-blockers, which are thought to possibly affect the clinical course of CAN. In addition, an increase in the amount of TAR >180 mg/dL, a marker of hyperglycemia, was also independently correlated with CAN, unlike indicators of hypoglycemia.
HbA1c is heretofore the most well-established tool by which to evaluate glycemic control and diabetes treatment efficacy, and it is known that improvements in HbA1c significantly decrease the development of diabetic complications, regardless of whether the patient has type 1 diabetes or type 2 diabetes. 21,22 Several studies have focused on the relationship between HbA1c and metrics that can be measured using CGM. Vigersky and McMahon 23 analyzed 18 randomized controlled trials, which included 2577 patients with type 1 diabetes and type 2 diabetes, reported a strong correlation between HbA1c and TIR 70–180 mgl/dL, while Beck et al. 24 found that a 10% increase in the TIR 70–180 mg/dL decreased the mean A1c by 0.6%.
Given the above correlation between TIR and HbA1c, TIR could be a useful surrogate marker for various diabetes complications, with several previous studies supporting this idea. Lu et al. reported that, with regard to relationship between TIR and diabetic retinopathy in patients with type 2 diabetes, the TIR quartile and the severity of diabetic retinopathy were inversely correlated. 11 In addition, for the relationship between TIR and carotid intima-media thickness, which is a surrogate marker for cardiovascular disease, when TIR increased by 10%, the risk of abnormal carotid intima-media thickness decreased by 6.4%. 12 We previously reported that albuminuria, a microvascular complication of diabetes, was found to be inversely associated with TIR and positively associated with hyperglycemic metrics; importantly, as in other studies, albuminuria was inversely correlated with TIR even after adjusting the glycemic variability metrics. 13 The results of these previous studies strengthen the potential of TIR as a tool for predicting the risk of diabetes complications.
Recently, Guo et al. reported that TIR is inversely correlated with the presence of CAN independent of HbA1c and glycemic variability metrics in hospitalized patients with type 2 diabetes using CGM. 25 However, the hospitalized state is subject to changes in dietary pattern, physical activity, and compliance with medication, which are important factors in glycemic control in patients with diabetes and may not reflect the patient's true daily lifestyle. In line with this, there was a discrepancy between the assumed TIR as estimated from the baseline HbA1c and the real TIR, which was relatively better than that which was assumed, in the hospitalized setting. However, in the present study, as we retrospectively confirmed blood glucose levels using blind CGM and the actual life patterns of the patients were likely accurately represented and reflected in the outpatient setting, there was a reduced discrepancy between the value of HbA1c at baseline and TIR. Therefore, probably due to the strong association between HbA1c at baseline and TIR, our study did not show a significant association between TIR and CAN after further adjusting for HbA1c, which is similar to our previous study concerning the relationship between TIR and albuminuria in the outpatient setting. 13
Although differences were observed in hypoglycemia CGM metrics TBR <70 mg/dL and TBR <54 mg/dL according to the presence of CAN, these differences were no longer present after adjusting for age.
In addition, this study showed that an increase in the amount of TAR >180 mg/dL was independently associated with the presence of CAN even after adjusting the CV as a glycemic variability metric. Although the mechanism of diabetic CAN is still not fully understood, known risk factors include chronic hyperglycemia, obesity, hypertriglyceridemia, and duration of diabetes. Among these, hyperglycemia plays a pivotal role in the initial pathophysiology and progression of CAN by inducing direct neuronal damage or dysfunction with increased oxidative and nitrosative stress and by inducing endothelial dysfunction that leads to neuronal ischemia. 26 –28 In the dominance analysis for the relative importance of variables identified on logistic regression analysis, the results appeared in the order of TAR >180 mg/dL and TIR 70–180 mg/dL. However, in accordance with previous studies which reported that TIR and TAR >180mg/dL had a strong negative correlation with each other, we also showed that these two metrics had a strong negative correlation (r = −0.98; P < 0.001, data not shown). 29 –32 Therefore, in this context, the effects of the two variables on CAN could be interpreted as one phenomenon.
The strength of this study is that it is the first report to assess the relationship between CAN and CGM metrics, including hyperglycemic and hypoglycemic metrics as well as TIR of target glucose, which were collected in a blinded manner, in outpatients with type 2 diabetes. In addition, we adopted a recently updated international consensus report for evaluating the proportion of patients who met the glycemic target for TIR and other CGM-derived metrics. Moreover, we evaluated the presence of CAN, as well as severity of CAN using the total cardiovascular autonomic function test score and confirmed the inverse relationship between TIR and CAN. Moreover, the types of antidiabetic agents able to affect TIR or CAN were examined and adjusted for in the analyses.
However, this study also has several limitations that should be noted. The sample size in this study was small, and since it was conducted on outpatients and with people who needed CGM, its retrospective nature, which is subject sensitive to selection bias requires careful consideration when applying the results to different groups. Second, as recently reported, the optimal duration of CGM monitoring required to reflect a patient's glycemic control status over a 3-month period is 14 days; therefore, the CGM monitoring period of 3–6 days used in this study may be too short to assess an appropriate glycemic pattern. 33 Third, this study was designed as a cross-sectional investigation, so it is difficult to evaluate the causal relationship between exposure and outcome. Further longitudinal studies are needed.
Conclusions
This study supports that TIR 70–180 mg/dL and TAR >180 mg/dL measured by CGM are significantly associated with the presence and severity of CAN in patients with type 2 diabetes patients seen on an outpatient basis.
Footnotes
Authors' Contributions
M.Y.K., J.H.K., and G.K. are responsible for this study. G.K. and J.H.K. conceived and designed this study. M.Y.K., J.Y.P., M.S.C., K.Y.H., S.-M.J., Y.-B.L., and J.E.J. collected data. M.Y.K. conducted statistical analyses and drafted the article. G.K. and J.H.K. reviewed and revised the article. All authors read and approved the final article.
Acknowledgments
This article was preprint posted in Research Square on November 5, 2020.
Availability of Data and Materials
The datasets generated and/or analyzed during the current study are available from the corresponding authors on reasonable request.
Author Disclosure Statement
No competing financial interests exist.
Funding Information
This research was supported by a grant of the Korea Health Technology R&D Project through the Korea Health Industry Development Institute (KHIDI), funded by the Ministry of Health and Welfare, Republic of Korea (grant number: HI19C0543). This research was funded by the Korea Disease Control and Prevention Agency (grant number 2020-ER6402-00).
Supplementary Material
Supplementary Table S1
Supplementary Table S2
Supplementary Table S3
References
Supplementary Material
Please find the following supplemental material available below.
For Open Access articles published under a Creative Commons License, all supplemental material carries the same license as the article it is associated with.
For non-Open Access articles published, all supplemental material carries a non-exclusive license, and permission requests for re-use of supplemental material or any part of supplemental material shall be sent directly to the copyright owner as specified in the copyright notice associated with the article.