
Abstract
Aims:
To identify profiles of type 2 diabetes from continuous glucose monitoring (CGM) data using ambulatory glucose profile (AGP) indicators and examine the association with prevalent complications.
Methods:
Two weeks of CGM data, collected between 2015 and 2019, from 5901 adult type 2 diabetes patients were retrieved from a clinical database in Chennai, India. Non-negative matrix factorization was used to identify profiles as per AGP indicators. The association of profiles with existing complications was examined using multinomial and logistic regressions adjusted for glycated hemoglobin (HbA1c; %), sex, age at onset, and duration of diabetes.
Results:
Three profiles of glycemic variability (GV) were identified based on CGM data—Profile 1 [“TIR Profile”] (n = 2271), Profile 2 [“Hypo”] (n = 1471), and Profile 3 [“Hyper”] (n = 2159). Compared with time in range (TIR) profile, those belonging to Hyper had higher mean fasting plasma glucose (202.9 vs. 167.1, mg/dL), 2-h postprandial plasma glucose (302.1 vs. 255.6, mg/dL), and HbA1c (9.7 vs. 8.6; %). Both “Hypo profile” and “Hyper profile” had higher odds of nonproliferative diabetic retinopathy (“Hypo”: 1.44, 1.20–1.73; “Hyper”: 1.33, 1.11–1.58), macroalbuminuria (“Hypo”: 1.58, 1.25–1.98; “Hyper”: 1.37, 1.10–1.71), and diabetic kidney disease (DKD; “Hypo”: 1.65, 1.18–2.31; “Hyper”: 1.88, 1.37–2.58), compared with “TIR profile.” Those in “Hypo profile” (vs. “TIR profile”) had higher odds of proliferative diabetic retinopathy (PDR; 2.84, 1.65–2.88).
Conclusions:
We have identified three profiles of GV from CGM data. While both “Hypo profile” and “Hyper profile” had higher odds of prevalent DKD compared with “TIR profile,” “Hypo profile” had higher odds of PDR. Our study emphasizes the clinical importance of recognizing and treating hypoglycemia (which is often unrecognized without CGM) in patients with type 2 Diabetes Mellitus.
Introduction
Type 2 diabetes is a global problem and affects more than 400 million people worldwide, more than 75 million of whom live in India. 1 To diagnose and treat diabetes, clinicians use measurements that are restricted to single time points such as fasting plasma glucose or postload glucose as part of an oral glucose tolerance test. In addition, the glycated hemoglobin or HbA1c is a robust indicator of long-term glycemic control. It is now increasingly being recognized that over and above chronic hyperglycemia, glycemic variability (GV) plays an important role in the development of diabetes complications. 2 Continuous glucose monitoring (CGM) devices have therefore become increasingly popular in tracking intraday variability in blood glucose, particularly in high-income countries, although its adoption is still in its infancy in low- and middle-income countries. 3 –5
An increasing number of studies using biomarkers for dysglycemia show that there might be distinct clusters of diabetes phenotypes among patients. 6 –8 In the present study, we use CGM data to identify clusters of individuals sharing intraday GV profiles among type 2 diabetes patients treated at a tertiary care center in urban India. Current guidelines recommend the use of 10 summary metrics consisting of averages (average of sensor glucose, glucose management indicator (GMI), and percentage of time in different ranges) and variability (coefficient of variation) to aid the interpretation of CGM data. 3 These measures are linearly dependent in an individual or are potentially correlated thereby masking latent profiles of GV. We hypothesize that profiles associated with departure from recommendations would be associated with higher prevalent complications.
Subjects, Materials, and Methods
Study design
Study participants were selected from the anonymized clinical database of a tertiary diabetes center at Chennai in southern India. We included those who had been initiated on Abbott FreeStyle Libre Pro, an intermittently scanned continuous glucose monitoring (isCGM) device, between 2015 and 2019. Eligibility criteria included age between 18 and 80 years, having at least 75% of isCGM data recorded over the 14-day period, and having valid HbA1c measurements within 30 days of isCGM. Data on isCGM and clinical characteristics were available for 6362 individuals. After excluding participants with other forms of diabetes, our final sample consisted of 5901 patients with type 2 diabetes who had complete data on isCGM and HbA1c (%).
Data collection
CGM parameters
isCGM records consisted of a measure of blood glucose (mg/dL) every 15 min for 2 weeks. 9 We obtained a series of measurements for all eligible participants for the prescribed duration and aggregated the individual measures to summary measures as per ambulatory glucose profile (AGP) reporting recommendations (Table 1). 3 Using these measures, we derived profiles of GV that were used to investigate profiles and their association with complications.
Recommended Continuous Glucose Monitoring Summary Measures in Ambulatory Glucose Profile at First Visit (n = 5901)
Values are reported as mean ± SD or median (25th percentile, 75th percentile) for continuous variables and N (%) for categorical variables.
G = 1.509 × [ln (glucose)1.084 − 5.381].
GRADE, Glycemic Risk Assessment Diabetes Equation (additional details in Supplementary Note S1); HBGI, high blood glucose index; LBGI, low blood glucose index; MAGE, mean amplitude of glycemic excursion; SD, standard deviation; TIR, time in range.
Clinical characteristics
Anthropometric, biochemical, clinical, and treatment information, which was available closest to the date of initiation of isCGM, was obtained. Procedures for data collection have been published previously (Supplementary Data). 10 All biochemical analyses were carried out in a central laboratory certified by the National Accreditation Board for Testing and Calibration Laboratories and the College of American Pathologists. 11
Diabetes-related complications
At the study center, all patients are tested for complications using an established protocol. Retinopathy was clinically assessed using retinal color photography into nonproliferative diabetic retinopathy (NPDR) or proliferative diabetic retinopathy (PDR). 12 Microalbuminuria was diagnosed as urinary albumin excretion 30–300 μg/mg of creatinine. Macroalbuminuria was defined as urinary albumin excretion greater than 300 μg/mg of creatinine. Estimation of glomerular filtration rate (eGFR) was carried out using the Modification of Diet in Renal Disease study equation. 13 Individuals with macroalbuminuria and eGFR less than 60 mL/min/1.73 m2 were diagnosed as having diabetic kidney disease (DKD). We categorized those who were not tested for complications and whose duration of diabetes was 5 years or less as negative for complications.
Informed written consent was obtained from all participants. Ethical approval for the study was obtained from the Institutional Ethics Review Board (EC/HIST/INST/2019/2584).
Statistical analysis
Continuous variables are expressed in mean ± standard deviation (SD; if normally distributed) or median (with interquartile range [IQR]). Categorical variables are expressed in frequencies and percentages. We used the first valid CGM record as per eligibility criteria to classify into subtypes of glycemic patterns based on AGP indicators. For the analysis, we did not use number of days of wear and percentage time the CGM is active from the proposed list of 10 AGP indicators. 3
We used non-negative matrix factorization (NMF), a feature-based clustering algorithm, to identify non-negative linear combinations of our eight glycemic summary characteristics. 14 For a given positive integer K, NMF decomposes our data into two matrices—bases (a row for each individual and empirical probability of belonging to each of the K profiles) and coefficients (a column for each variable and loading to each profile). We ran the NMF analysis after minimum/maximum scaling of our variables for 100 iterations with random initializations for K = 2 to 8. We assessed the robustness of our procedure by calculating an Amari dissimilarity index (100 runs), with lower values indicating higher stability. 15 We chose the number of bases based on highest stability, and clinical interpretation based on descriptive statistics.
We assessed the association of profile membership with prevalent complications using multinomial logistic regressions for retinopathy (NPDR, PDR, neither) and nephropathy (microalbuminuria, macroalbuminuria, neither). We used logistic regression to assess the association of profile membership with prevalent DKD. All associations were adjusted for HbA1c (%), age at onset of diabetes, duration of diabetes, and sex.
Sensitivity analysis
We repeated the NMF analysis for our more comprehensive list of CGM statistics presented in Supplementary Table S1. We derived the NMF coefficients from an independent training (75%) set and classified our sample in the test (25%) set to assess if our factorization was generalizable. We conducted a bias analysis using e-values to estimate the minimum magnitude of association a hypothetical confounder should have with profile membership and prevalent complications to explain away the observed association. We also compared the NMF using AGP indicators with alternate schema using log-transformed average glucose and using the blood glucose symmetrization transformation (G; 1.509 × [ln (glucose)1.084 − 5.381]) due to the asymmetry of glucose distribution as well as curvilinear relationship between glucose and time between 70 and 180 mg/dL (%; time in range [TIR]). 16,17
We conducted a post hoc analysis to identify cut-points for standard measures (time above range [TAR], time below range [TBR], high blood glucose index [HBGI], low blood glucose index [LBGI], percentage of Glycemic Risk Assessment Diabetes Equation in hypoglycemia and hyperglycemia) that could be used to classify our sample into profiles (details in Supplementary Note S1). 18 –21 We assessed the concordance of alternate categorizations with the NMF derived from AGP measures using Cohen's Kappa statistic.
We performed all analyses in R 3.6.1 using the following packages: tidyverse 1.2.1, NMF 0.21.0, cgmanalysis 2.4, and nnet 7.3–12.
22
–24
The code used for analysis is available at
Results
Clinical and isCGM characteristics at baseline
Our final sample based on the eligibility criteria consisted of 5901 individuals (male: 64.8%) who wore the device for 14 days as per guidelines. The average sensor glucose from the CGM was near-normally distributed across the sample (mean: 155.5 ± 45.6; median: 147.2, IQR: 123.6–179.8) with 2216 (37.6%) exceeding GV target (% coefficient of variance [CV] ≤36). A summary of characteristics as per AGP recommendations for CGMs is reported in Table 1. The distribution of AGP measures and the correlations between them are provided in Figure 1. We observed a curvilinear relationship of average glucose (mg/dL) with TIR (%). 25
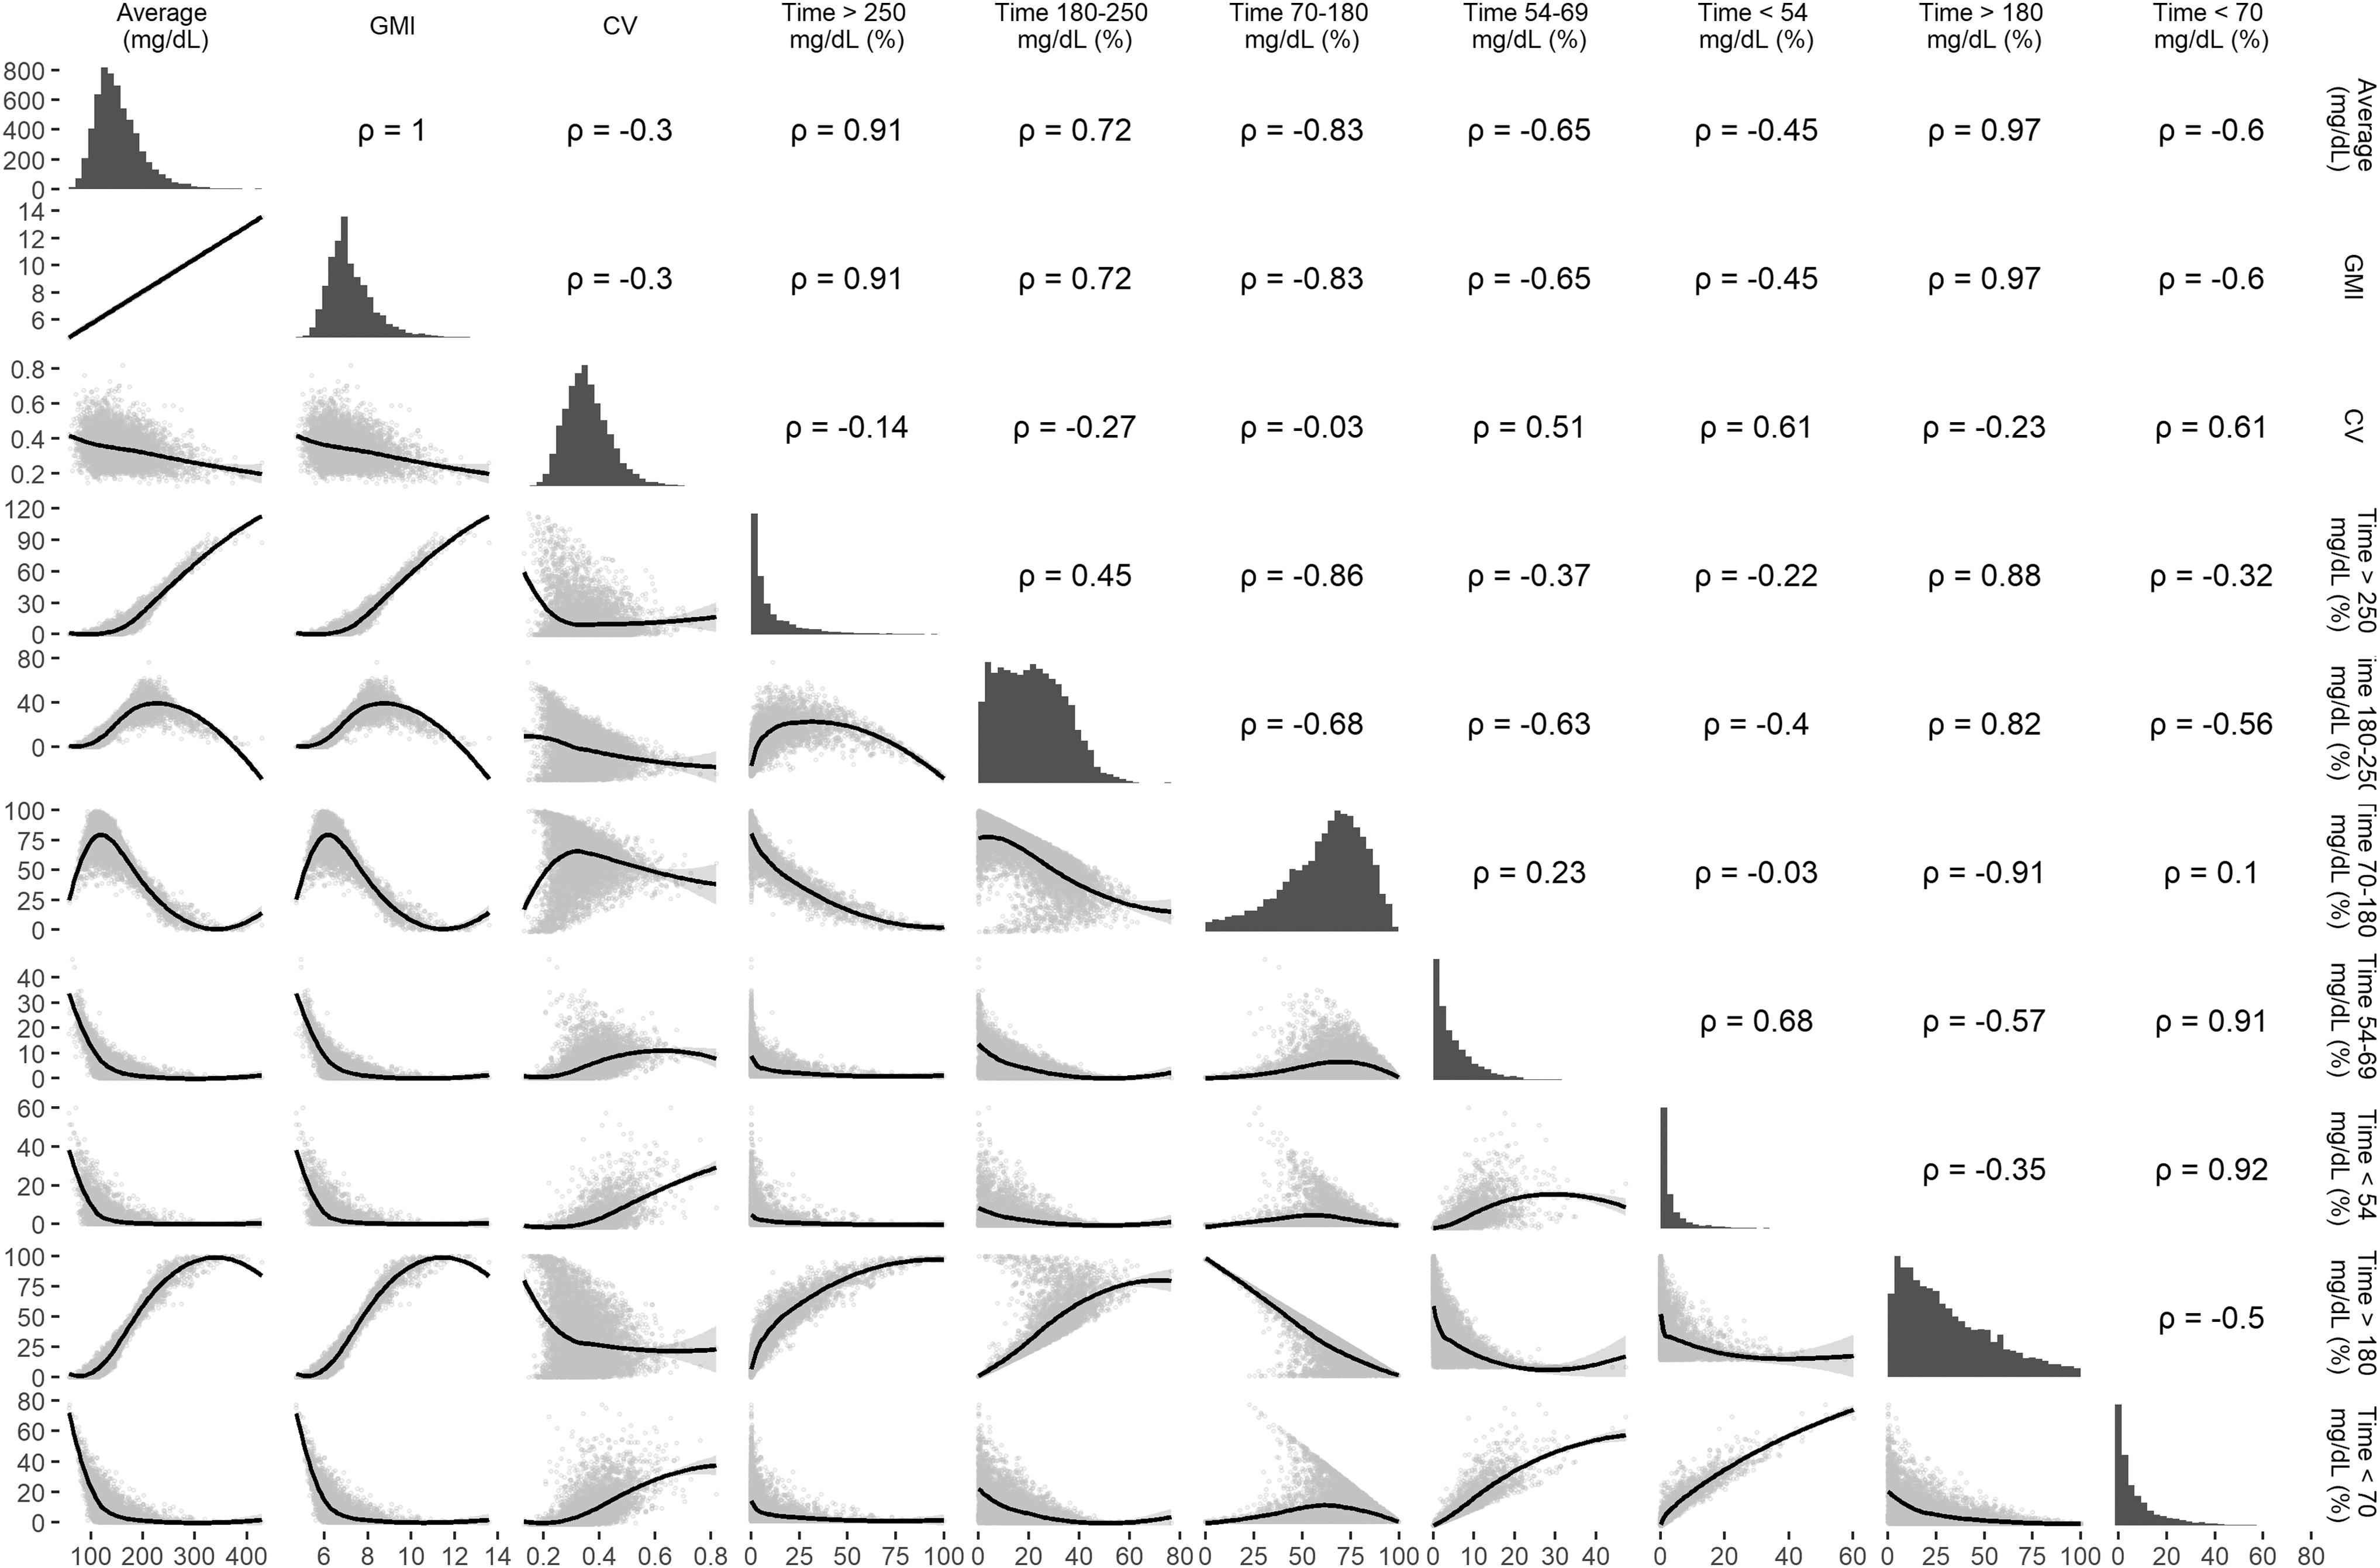
Correlation matrix of AGP summary measures (n = 5901). All values are Pearson correlations. We do not use TIR (<70 mg/dL) and time above range (>180 mg/dL) in further analysis since they are not part of the recommended set of AGP indicators. AGP, ambulatory glucose profile; TIR, time below range.
Among the participants, 2658 (45.0%) were overweight (body mass index [BMI] ≥25 kg/m2) and 1237 (21.0%) were obese (BMI ≥30 kg/m2). The average age of the sample was 55.4 ± 10.5 years. A detailed summary of patient characteristics at first CGM is provided in Table 2. Of the final sample, 423 (7.2%) had more than one isCGM initiated and 45 patients had three or more isCGM initiations. All our participants had more than 99% of isCGM data available for 14 days. Among 5827 patients in whom data on insulin status were available, 4011 (68.8%) were prescribed the same at time of CGM. The mean HbA1c (%) in the sample was 9.0 (75 mmol/mol) ±1.8. Among the sample, 1775 (30.1%) had retinopathy and 2092 (35.5%) had nephropathy. Additional summaries of isCGM characteristics are provided in Supplementary Table S1.
Clinical Characteristics of Patients at Continuous Glucose Monitoring Initiation by Glycemic Variability Profile (n = 5901)
Values are reported as mean ± SD for normally distributed continuous variables and N (%) for categorical variables.
Includes those whose duration is less than 5 years and were not tested (as negative retinopathy: 273; as negative albuminuria: 80).
eGFR <60 mL/min/1.73 m2 and have macroalbuminuria.
BMI, body mass index; eGFR, estimation of glomerular filtration rate; HbA1c, glycated hemoglobin; HDL, high-density lipoprotein; LDL, low-density lipoprotein; NPDR, nonproliferative diabetic retinopathy; PDR, proliferative diabetic retinopathy.
Description of isCGM profiles
Based on our profile selection criteria of dissimilarity index (Supplementary Fig. S1) and clinical relevance, we derived three profiles of glycemic patterns integrating eight AGP characteristics. The loadings for each of the bases are displayed in Supplementary Figure S2. We assigned each patient to a profile based on the highest probability of membership derived from NMF. For ease of reporting, we named the three profiles as Profile 1 [“TIR Profile”] (n = 2271), Profile 2[“Hypo”] (n = 1471), and Profile 3 [“Hyper”] (n = 2159). A detailed summary comparing derived profiles is provided in Tables 1 and 2.
The mean age was similar across the three profiles. The age at onset (years; mean ± SD) was lower in “Hyper profile” (41.0 ± 8.8) and similar between “TIR profile” (42.7 ± 9.1) and “Hypo profile” (42.8 ± 9.5). However, the duration of diabetes (years) was higher in “Hyper” (14.7 ± 8.0) and “Hypo” (13.5 ± 8.4) profiles compared with “TIR profile” (11.9 ± 8.0). The prevalence of overweight or obesity was higher in “Hyper profile” (73.4%), followed by “TIR profile” (70.3%) and “Hypo profile” (63.2%). Fasting plasma glucose (202.9 ± 67.9), postprandial glucose (302.1 ± 92.2), and HbA1c (%; 9.7 ± 1.7) were highest in the “Hyper profile.” Relative to “Hypo profile,” mean amplitude of glycemic excursion (MAGE) was higher in “Hyper profile” (110.2 ± 27.2 vs. 82.5 ± 27.0), while % CV >0.36 was lower (11.1% vs. 19.5%).
Density plots for biochemical and anthropometric measures (Supplementary Fig. S3), as well as key indices of GV (Supplementary Fig. S4), suggest overlap for all measures across the range of values. Scatterplots with isoprobability contours displaying the association between anthropometric/biochemical outcomes and GV indices by profile membership are provided in Supplementary Figures S5–S7.Visual examination of clusters across measures of GV suggests that the “TIR profile” and “Hyper profile” are well separated on TIR, while “Hypo profile” separates itself from “TIR profile” and “Hyper profile” on coefficient of variation. However, clusters are not separated on BMI, HbA1c (%), and fasting blood glucose.
Examples of 2-week isCGM data for the different profiles are provided in Figure 2A
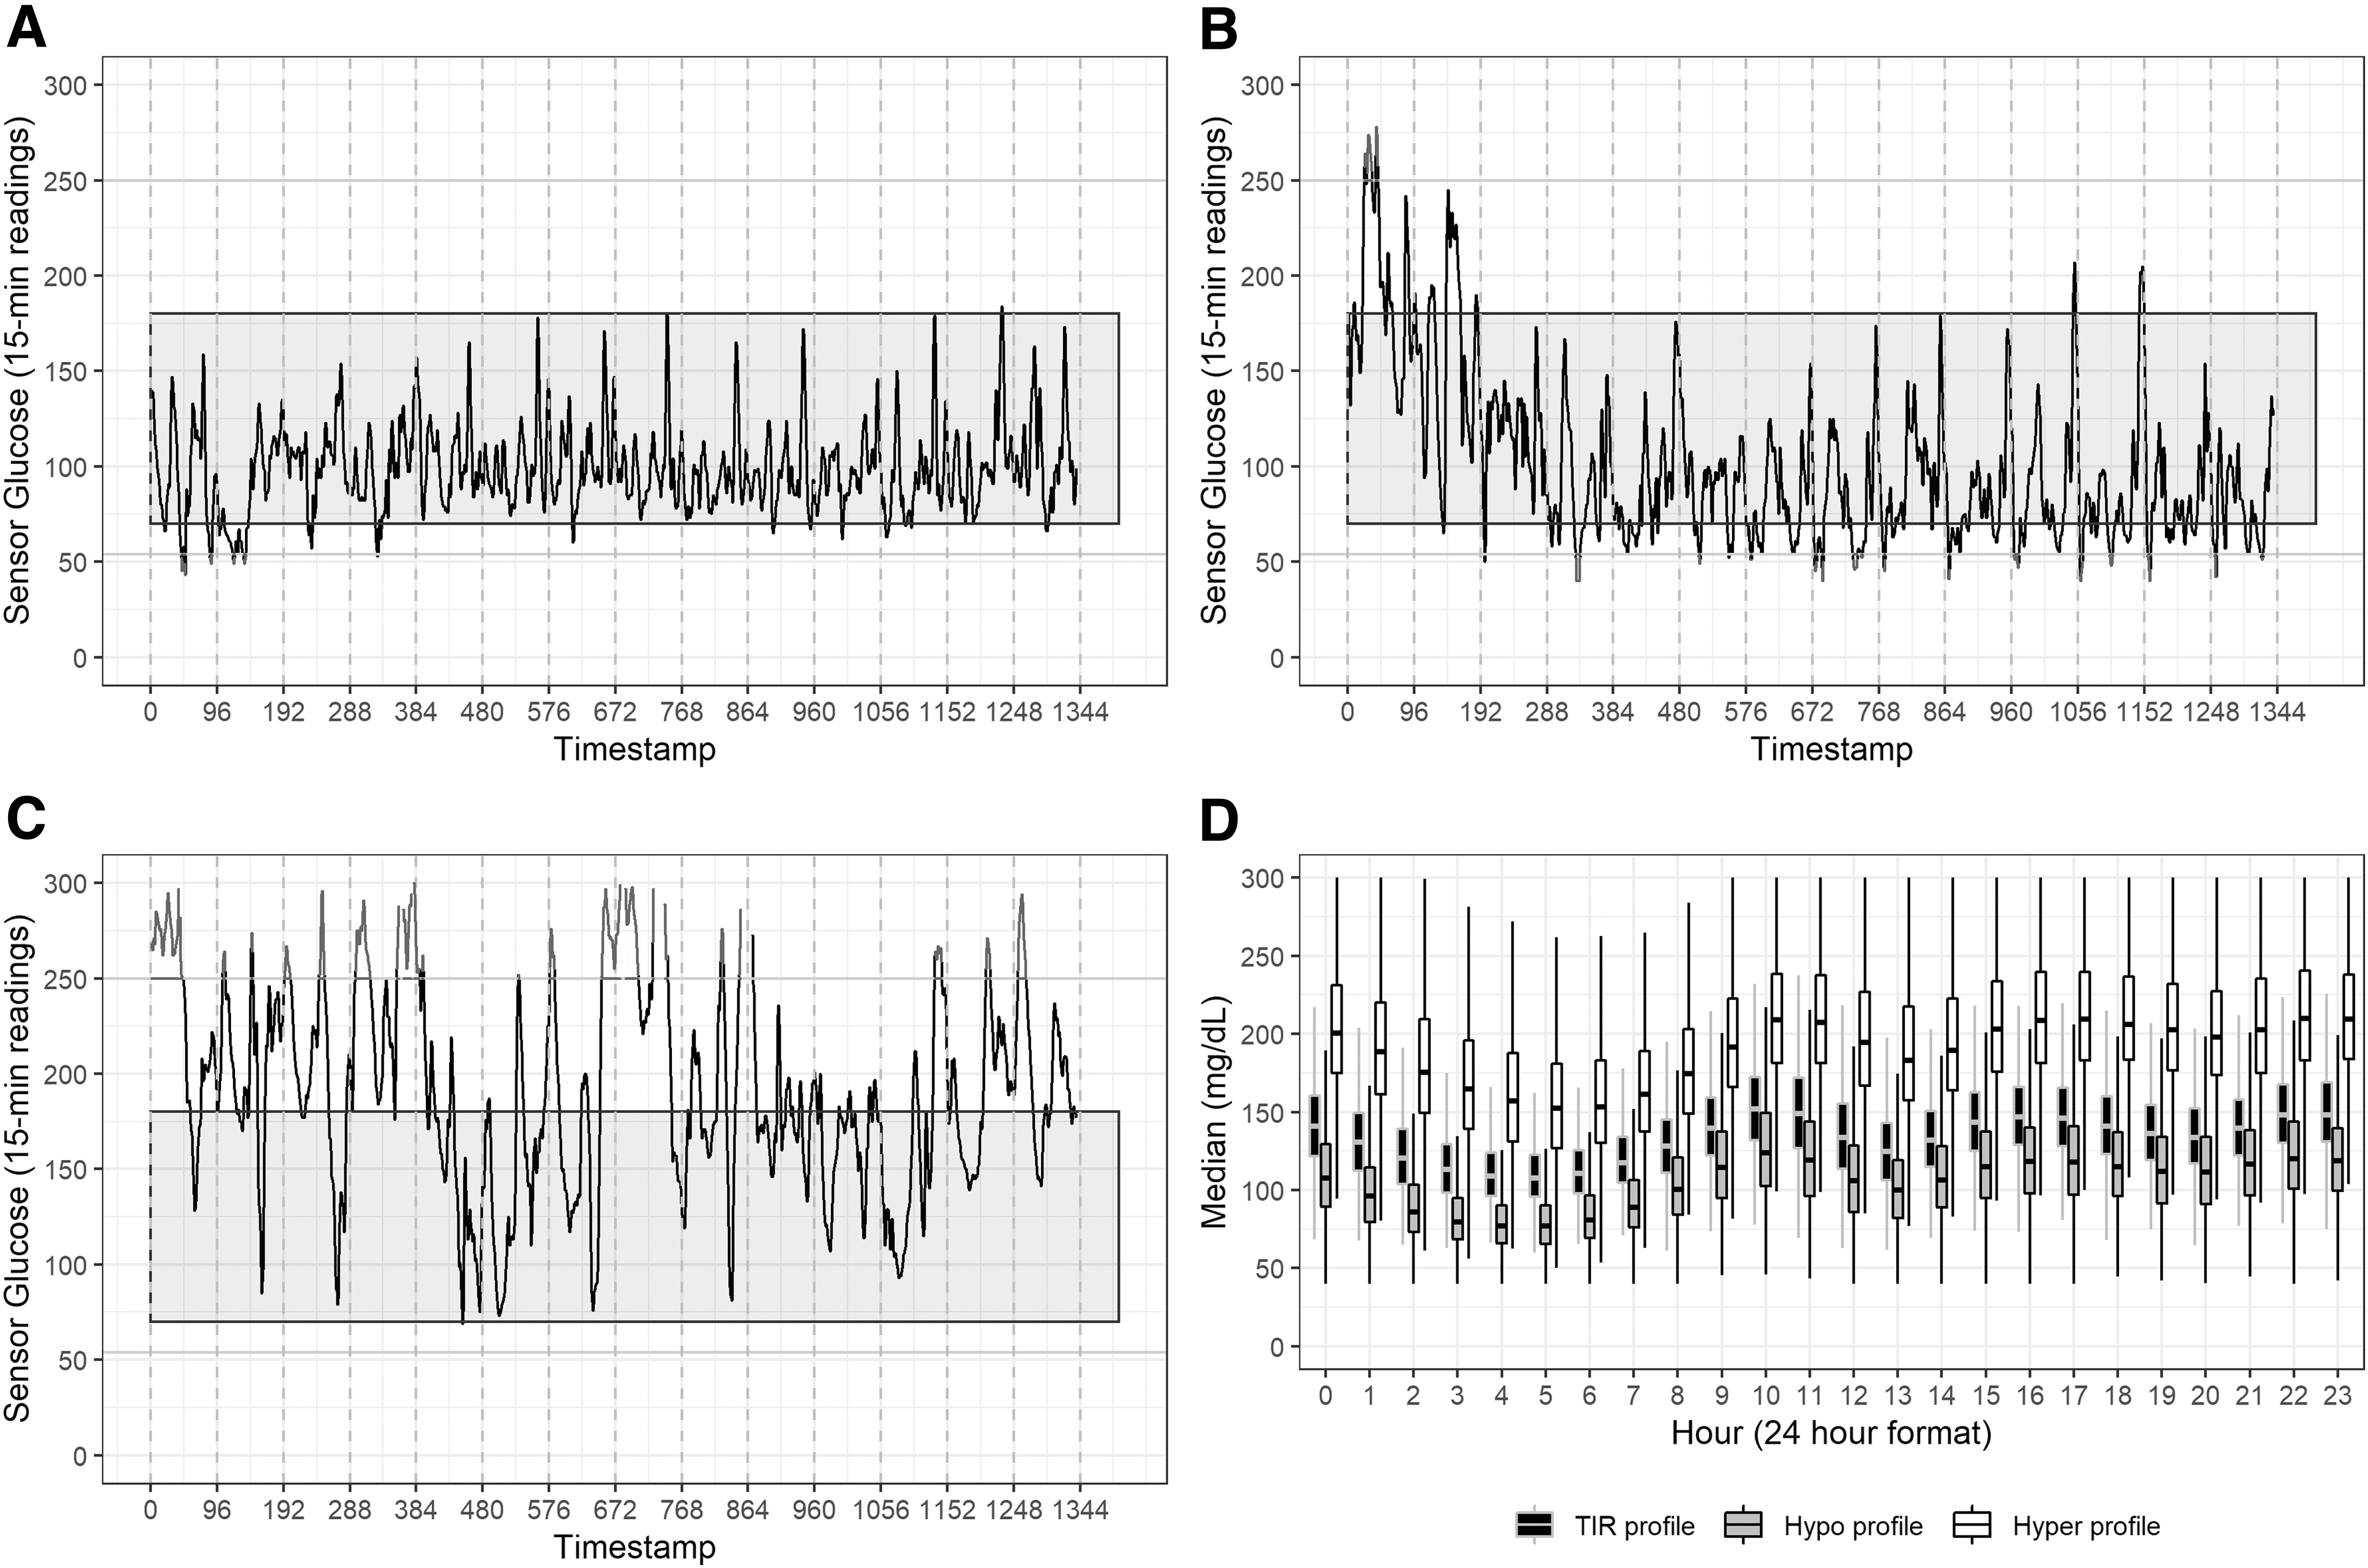
Examples of 14-day glycemic profiles derived from non-negative matrix factorization. Examples of 2-week isCGM for individuals belonging to glycemic profiles for
Association of CGM profiles with existing complications
“Hypo” and “Hyper” profiles had higher prevalent odds of all complications compared with “TIR profile” after adjusting for HbA1c (%), age at onset of diabetes, duration of diabetes, and sex (Table 3). “Hypo” and “Hyper” profiles had higher odds of prevalent PDR (“Hypo profile”: 2.84, 1.65–4.88; “Hyper profile”: 1.39, 0.78–2.45), macroalbuminuria (“Hypo profile”: 1.58, 1.25–1.98; “Hyper profile”: 1.37, 1.10–1.71), and DKD (“Hypo profile”: 1.65, 1.18–2.31; “Hyper profile”: 1.88, 1.37–2.58), compared with “TIR profile.” The odds ratio (OR) for different complications was similar for “Hypo” and “Hyper” profiles, except that the odds for PDR were higher in the “Hypo profile.” Follow-up information on complications was available only for a subset of individuals. As a result, we could not assess risk of progression of complications and how it was different across profiles.
Adjusted Odds Ratio of Prevalent Complications with Profile Membership (n = 5901)
Associations were adjusted for HbA1c (%), age at onset of diabetes (years), duration of diabetes till CGM initiation (years), and sex.
CGM, continuous glucose monitoring.
Sensitivity analysis
We repeated the profile analysis after including additional CGM characteristics. We present a comparison of profiles derived using recommended AGP measures and additional measures in Supplementary Table S2. There was high concordance between the two sets of profiles (Cohen's κ = 0.88). From the original profiles, 264 (17.9%) of “Hypo profile” and 186 (8.6%) of “Hyper profile” were reclassified, primarily into the new “TIR profile.” There was one reclassification from the original TIR profile. Repeating the factorization using a training set (n = 4426, 75%) achieved high concordance (Cohen's κ = 0.97) with the pooled data (Supplementary Table S3). We also achieved high concordance (Cohen's κ = 0.82) when applying the factorization derived from the training set on an independent test set (n = 1475, 25%).
Our bias analysis for unmeasured confounding suggests that a hypothetical confounder that is strongly associated (OR = 5.13) with both the “Hypo profile” membership (relative to “TIR profile”) and PDR is required to explain away the association. Results for other pairs of associations are presented in Supplementary Table S4. Repeating the analysis after log-transformation of average glucose and using the blood glucose index transformation did not change our results (Supplementary Tables S5 and S6).
Results from our post hoc analysis using univariate density plots (Supplementary Figs. S4 and S8) suggest that binary cut-points derived from well-characterized indices of GV could partition our sample into NMF profiles. TAR (at 40%) and TBR (at 10%), HBGI (at 10) and LBGI (at 5), as well as %GRADEhyper (at 90%) and %GRADEhypo (at 20%) achieved high concordance (Cohen's κ of 0.88, 0.78 and 0.80, respectively) with profiles derived from NMF (Supplementary Table S7). We display the pairs of GV indices used for post hoc separation into profiles by profile membership in Figure 3.

Distribution of continuous glucose monitoring indicators for post hoc separation of profiles. A combination of well-characterized GV indicators (Supplementary Note S1) could separate the profiles based on data-derived cut-points. 18,20,58 –60 However, the replicability of these cut-points in an independent sample is pending evaluation (Supplementary Table S7). Isoprobability contours at 33rd percentile and 67th percentile are displayed for each panel.
Discussion
Our analysis from integrating proposed summary measures recommended as part of the AGP suggests three profiles of GV derived from isCGM data among people with type 2 diabetes. We also show that these profiles have distinct anthropometric, clinical, and biochemical profiles that were consistent with what is expected given the intraday glycemic pattern. Our sample was distributed across the three profiles, with “TIR profile” (38.5%) and “Hyper profile” (36.6%) being in the majority. The “Hyper profile” and “Hypo profile” represented poorer control of intraday glucose, with the mean daily glucose, MAGE, and GMI (%) being highest in “Hyper profile,” while percentage of those with coefficient of variation greater than 36% was higher in “Hypo profile.” The average proportion of time spent in hypoglycemia and hyperglycemia by hour of day is presented in Supplementary Figure S9.
We found differences in age at onset and duration of diabetes between profiles, with those belonging to “Hyper profile” having a longer duration of diabetes on average. HbA1c (%), fasting plasma glucose, and postprandial plasma glucose were higher in “Hyper profile” compared with other profiles. The odds of prevalent retinopathy (both NPDR and PDR) and nephropathy were higher among both “Hypo” and “Hyper profiles” relative to “TIR profile,” with the “Hypo profile” having the highest odds of PDR. Results from our bias analysis to assess unmeasured confounding suggested that a hypothetical confounder strongly associated with both profile membership and PDR is required to explain away the association.
The link between risk of microvascular complications and chronic hyperglycemia has been unequivocally demonstrated both in type 1 diabetes and type 2 diabetes, such as the Diabetes Control and Complications Trial and the U.K. Prospective Diabetes Study. It is, therefore, not surprising that individuals in the “Hyper profile,” who had the highest mean daily glucose, had higher risk of retinopathy and nephropathy compared with the “TIR profile.” While most discussions on the role of GV in the development of chronic diabetes complications have focused on macrovascular (cardiovascular) disease, more recent studies show that measures of GV are associated with the risk of microvascular disease as well, even after adjusting for clinical characteristics, including HbA1c (%). 26,27 In this context, it is of interest that individuals in the “Hypo profile,” who had lower mean daily glucose but higher GV compared with the other two profiles, also had higher odds of both retinopathy and nephropathy compared with the “TIR profile.” Thus, our study adds to the earlier reports that studying and trying to reduce GV, that is, improving TIR and CV, could be the new dimensions in diabetes therapy beyond fasting and postprandial plasma glucose and HbA1c estimations. 28,29
It is also interesting to note that individuals in the “Hypo profile” had the highest odds of PDR, despite their mean daily glucose being the lowest among the three clusters. The “Hypo profile” spends more TBR (<70 mg/dL) as a result of high GV. 30 Worsening of retinopathy with acute reduction in blood glucose (particularly with the use of insulin) has been widely described in the literature, and this phenomenon has been suggested to underlie the increased risk of retinopathy progression associated with use of the glucagon-like peptide receptor agonist, semaglutide. 31 –38 However, none of these earlier studies have shown an association between frequent hypoglycemia (as occurs in the “Hypo profile”) and risk of proliferative retinopathy; this could reflect the limitations of HbA1c and intermittent blood glucose monitoring (the only tools utilized to assess glycemic control in these studies) in detecting hypoglycemic events. 39 Further studies are warranted to evaluate whether higher GV with increased frequency of hypoglycemic episodes is a more potent risk factor for severe retinopathy compared with chronic hyperglycemia.
CGM initiation has been found to be effective in improving clinical outcomes in different settings and looks promising in customizing treatments. 5,8,40 –44 Studies have used clinical and biochemical data of diabetes patients to identify novel subtypes for nearly three decades. 7,45 –48 Previous studies have used CGM data to predict the incidence of hypoglycemia and hyperglycemia, identify temporal variations associated with birth outcomes, as well as identify patterns of GV to classify individuals into subtypes. 8,44,49 –54 Our results are consistent with findings using the sparse principal component analysis, which suggests the existence of two orthogonal components (from 25 parameters) that could be used to explain the interdependence of GV indices in both type 1 diabetes and type 2 diabetes. 55,56
Another study additionally included measures of interday reproducibility (mean of daily difference) in their principal component analysis (total of 22 indices). 19 The authors concluded that a single index (such as CV or TIR) may not be sufficient to explain the complexity of GV. This is consistent with our exploratory analysis which suggests that categorizations derived from a single index such as TIR or CV may not differentiate across profiles. In addition, our study explores partitioning of GV into within and between profiles under the assumption of distinct subpopulations.
Our analysis has many strengths. First, the sample size considered for analysis is the largest reported in a study of CGM in low- and middle-income countries. In addition, standardized protocols were used to obtain anthropometric, biochemical, and clinical measurements for all patients in the sample. Second, results from the robustness analysis using Amari-based dissimilarity showed stable estimates of profile membership for NMF. Alternative methods that use distance-based approaches to identify profiles/clusters suffer from issues of high dimensionality as well as restrictive neighborhood assumptions, and those that use model-based clustering might not perform well in high-noise settings. 57 Third, all assessments and diagnoses were carried out in a clinic setting for care-seeking patients minimizing respondent burden.
Finally, our sensitivity analysis suggests that profiles derived using NMF could be replicated post hoc by using well-characterized indices of GV such as TAR, TBR, LBGI, HBGI, and %GRADE (hypo, hyper). The clinical utility of these GV indices, their ease of estimation and interpretation, as well their interrelationships have been described previously. 17,18,20,58 –60 Further research is required on whether the cutoffs used for these indices are generalizable to other settings.
However, our study is not without limitations. Our study consists of free-living patients who have diabetes and have experienced progressive worsening of symptoms. This is not representative of the clinic patients, many of whom are newly diagnosed, and could indicate prognostic bias where clinicians initiate CGMs to prevent progression rather than improve status. 10,61 Second, CGMs are not initiated often in patients of lower socio-economic status (SES) due to the high out-of-pocket cost. As a result, the patients in our sample might be relatively wealthier and subject to different lifestyle exposures than a poorer urban or rural Indian. Thus, our study is generalizable only within the context of a diabetes specialty center. However, previous studies have shown that the patient profile of the clinic is fairly representative of Chennai city.
Third, the CGM device that is used has a higher mean absolute relative difference (%), which indicates error in measurement, compared with the other alternatives available in the market. 62,63 We conducted the analysis assuming measurement error to be nondifferential in the sample. Fourth, the relatively recent introduction of CGM into the Indian market prevents us assessing the stability of membership for an individual in a profile as well as risk of incident complications by profile membership. Finally, we have used summary CGM measures that might not capture the dynamic variability associated with intraday patterns of glucose. However, our supplementary analyses using additional summary measures captured through the day indicated similar results.
Our study supports evidence from other studies to indicate the existence of phenotypes (“glucotypes”) in type 2 diabetes. 6,44 We show distinct profiles of intraday GV derived from CGM. These profiles are associated with different clinical profiles and odds of prevalent complications. Further studies that explore the long-term effects of GV ought to be conducted to confirm these associations.
Footnotes
Authors' Contributions
Author contributions are as follows: V.M., K.M.V.N., J.S.V., J.C.H., and R.M.A. conceptualized the study; J.C.H., J.S.V., S.A.P., and R.M.A. designed the analysis plan; R.P., S.J., and V.B. were involved in data acquisition; J.S.V. performed the analysis and wrote the initial draft; all authors read and approved the final draft.
Acknowledgments
The authors would like to acknowledge the contributions of Bridgett Figueroa and Mark Hutcherson (Emory Global Diabetes Research Center), Yubin Park (Bonsai Research LLC), Thangamani S (Dr. Mohan's Diabetes Specialities Center) and clinical staff at the Madras Diabetes Research Foundation and Dr. Mohan's Diabetes Specialities Center. They also thank the editorial staff and anonymous reviewers who provided their valuable insights to help improve this article.
Author Disclosure Statement
No competing financial interests exist.
Funding Information
No funding was obtained for this project.
Supplementary Material
Supplementary Figure S1
Supplementary Figure S2
Supplementary Figure S3
Supplementary Figure S4
Supplementary Figure S5
Supplementary Figure S6
Supplementary Figure S7
Supplementary Figure S8
Supplementary Figure S9
Supplementary Table S1
Supplementary Table S2
Supplementary Table S3
Supplementary Table S4
Supplementary Table S5
Supplementary Table S6
Supplementary Table S7
Supplementary Note S1
References
Supplementary Material
Please find the following supplemental material available below.
For Open Access articles published under a Creative Commons License, all supplemental material carries the same license as the article it is associated with.
For non-Open Access articles published, all supplemental material carries a non-exclusive license, and permission requests for re-use of supplemental material or any part of supplemental material shall be sent directly to the copyright owner as specified in the copyright notice associated with the article.