




Abstract
Background:
Suboptimal glycemic control is associated with maternal and neonatal morbidity and mortality in pregnancy complicated by type 1 diabetes (T1D). Prospective analysis of continuous glucose monitoring (CGM) metrics, insulin pump settings, and insulin delivery can better characterize the changes in glycemic levels and insulin use throughout pregnancy with T1D.
Materials and Methods:
Prescribed parameters, insulin delivery, carbohydrate intake, and CGM data for 25 pregnant women with T1D from three U.S. sites were collected. Participants enrolled before 17 weeks gestation and used personal insulin pumps and study CGM. Mean daily total, basal, and bolus insulin doses (units/kg), CGM time in range (TIR: 63–140 mg/dL), and pump-entered carbohydrates were analyzed for every 2-week gestational interval. Linear mixed-effects regression models were used to evaluate changes across gestational ages compared to 12–14 weeks.
Results:
Basal insulin was higher during weeks 6–12 and 24–40. Daily bolus and total insulin were higher during weeks 20–40. Pump parameters were adjusted to intensify insulin therapy from 22 weeks onward. Average TIR across pregnancy was 59% ± 14%. Between 18 and 30 weeks, TIR was significantly lower, and time above range was significantly higher compared to the reference biweek. Time below target was lower between 22 and 34 weeks. Seven participants achieved >70% recommended TIR for pregnancy. Participants with maternal complications or infant neonatal intensive care unit admissions had lower TIR.
Conclusion:
While insulin dosing changed significantly with advancing gestation, most participants did not achieve >70% TIR. Customized anticipatory pump setting adjustments and automated systems aimed toward the designated TIR are needed to improve outcomes for this population. NCT03761615
Introduction
Pregnancy in women with type 1 diabetes (T1D) is associated with increased maternal, fetal, and neonatal morbidity and mortality; however, tight glycemic control has been shown to improve outcomes. 1 Maternal risks include increased perinatal mortality, preeclampsia, preterm birth, and cesarean section; while fetal and neonatal complications include congenital malformations and growth abnormalities (both fetal growth restriction and large for gestational age [LGA] babies). 2 –7 Pregestational and gestational elevated hemoglobin A1c (HbA1c), time in target glucose range, time in hyperglycemia, and incidence of hypoglycemia have been associated with poorer maternal and fetal outcomes. 8 –14 The International Consensus on time in range (TIR) has recommended a goal percentage of TIR between 63 and 140 mg/dL greater than 70% for pregnant women with T1D. 15 In practice, this goal has been difficult to achieve in studies before and after the international consensus recommendations. Automated insulin delivery (AID) in pregnancy in a small cohort has only achieved about 62% TIR for day and night system use but demonstrated higher median TIR for participants with lower baseline HbA1c and higher TIR during an extension phase in later pregnancy. 16 Further, the most advanced continuous glucose monitoring (CGM) has not been used uniformly in cohorts in previous studies.
Previous studies have shown that total daily insulin dose fluctuates throughout pregnancy and reaches 160%–300% of the preconception daily dose by the time of delivery. 17,18 It has been reported to increase until week 9, followed by a nadir at week 16, and finally a progressive increase until week 37. 19 While the total basal rate has an overall increase of 39%–48% during pregnancy, 17,18 conflicting data have been reported on basal rate changes showing a nadir at 9 weeks in one study with later increases and more steady progressive increases in another. 18,20 The rise in bolus doses appears to be more dramatic as they can increase from 106% to 306% across pregnancy. 17,18 Similar to total daily dose and basal doses, a nadir at 9 weeks and a peak at 35 weeks has been described for bolus doses. 18 These studies have been limited by small numbers of patients on pumps, 18,19 lack of data on carbohydrate intake and continuous CGM data, 18 –20 and inclusion of only one site. 18 –20 Of note, only one study of nine patients has analyzed a U.S. population. 18
Prospective data and guidance are needed for anticipatory pump setting adjustments and the development of AID systems for pregnant women. The objective of this study was to analyze pump settings and CGM-derived glycemic metrics obtained prospectively in pregnancies complicated by T1D from three clinical sites. The information obtained regarding insulin use throughout pregnancy can guide future therapy development and decision support.
Materials and Methods
Pregnant women with preexisting T1D for at least 1 year were enrolled before 17 weeks gestational age at the Icahn School of Medicine at Mount Sinai in New York City, Mayo Clinic in Rochester, and Sansum Diabetes Research Institute. The study was conducted between January 2019 and September 2020. Approval for the study was obtained at a central Institutional Review Board at Mayo Clinic Rochester. Written informed consent for study participation, including permission to view medical records of infants was obtained. Study data were collected and managed using REDCap electronic data capture tools hosted at Mayo Clinic. 21,22
Participants were already using an insulin pump for diabetes management and continued using their personal pump throughout the study. Women with HbA1c >10%, glomerular filtration rate <60 mL/(min ·1.73 m2), active gastroparesis, uncontrolled hypertension, chronic oral steroid use, or use of an AID system other than low glucose suspend or predictive low glucose suspend were excluded. All participants were provided a Dexcom G6 CGM system and trained on its use. Sensor site placement was based on subject preference and comfort (abdomen, arm, buttock, or leg). Participants were also provided and trained on the use of a control-tested study blood glucose meter (Contour ®NEXT, Ascensia Diabetes Care) to be used for CGM calibration when prompted by the CGM or when the participant felt it was indicated without additional specified times for self-monitoring of blood glucose (SMBG). Participants continued their usual diabetes and pregnancy care with their clinical endocrine and/or obstetric providers and performed SMBG with either their personal or study meter based on their guidelines. Providers utilized available SMBG and CGM data to guide insulin dose adjustments. HbA1c was measured in CLIA certified laboratories or with validated point of care machines.
Research staff contacted participants in person or by telephone 1 week after enrollment and every 2 weeks thereafter until the end of pregnancy and for a visit up to 12 weeks postpartum. The number of visits depended on the week of pregnancy at enrollment. During these contacts, prescribed pump settings were recorded, and study CGM and personal insulin pump data were downloaded. Recent weight, HbA1c values, and any complications for the mother and fetus/neonate were obtained from participants' medical records.
Changes in the prescribed insulin pump therapy parameters, insulin doses per kilogram (kg) body weight, CGM values, and HbA1c were analyzed. CGM, insulin pump, and carbohydrate intake data were evaluated for inclusion in the analyses based on the following criteria: CGM data must be available for more than 20 h within the relevant 24 h; at least two insulin boluses and carbohydrate intake entries must be present during the day.
American College of Obstetricians and Gynecologists' definitions of trimester dating were used: first trimester: first day of last menstrual period to 13 weeks and 6 days gestational age; second trimester: 14 weeks to 27 weeks and 6 days; and third trimester: 28 weeks to 40 weeks and 6 days. 23 In our calculations, for higher accuracy, the first day of pregnancy is inferred from final estimated due date for each participant.
Descriptive statistics
Average daily CGM percentage of time below, within, and above the target range, basal and bolus insulin use, and programmed insulin pump settings are presented. Since carbohydrate ratio and insulin sensitivity factor settings were mostly used during daytime (6 AM-midnight) and were tuned more precisely for this period when participants were eating, these parameters were evaluated for the daytime. Basal profile is evaluated for 24 h periods. Mean and standard deviation of HbA1c by pregnancy trimester are presented as timing for measurements for HbA1c were variable.
Statistical analyses
Linear mixed-effects (LME) model analyses 24 were conducted to analyze the association between gestational age in biweeks (i.e., every 2 weeks) and the following response variables: (I) daily percentage of time spent in the target glucose range (63–140 mg/dL), (II) daily percentage of time spent below 63 mg/dL, (III) daily percentage of time spent above 140 mg/dL, (IV) total daily basal insulin, (V) total daily bolus insulin, (VI) total daily insulin, and (VII) total daily carbohydrate intake. The effect of using a pump with active automated suspension feature (i.e., low glucose suspend or predictive low glucose suspend) was controlled for in response variables I through VI. To control for weight gain-related variations in insulin and carbohydrate intakes, the response variables IV through VII were normalized per kilogram bodyweight estimate of each participant on each day. The day-by-day bodyweight estimations were based on a linear model fitted on the bodyweight measurements reported from the start of pregnancy until delivery. Both the high percentage of variation explained by the linear model on our data (adjusted R-squared of 90% ± 9%) and previous literature supported the choice of linear fit. 25
For each response variable, a LME model was fitted, including overall mean and biweek fixed effects as well as random participant-specific effects for intercept and biweek. The participant-specific overall and participant-specific biweek random effects were modeled as independent variables. Gestational age was considered categorical to avoid the assumption of changes occurring systematically in a certain direction and to allow consideration of nonlinearity in the changes throughout pregnancy. Through the random participant-specific biweek effect, the models capture differences in the effect of gestational age on response variables between participants.
A two-sided P ≤ 0.05—two tailed—was used to assess statistical significance threshold for all statistical analyses. Values are presented as mean ± standard deviation for exploratory statistics and as estimate [standard error] for the LME model results. Statistical significance was evaluated based on a reference gestational 2-week interval defined as 12 weeks to 13 weeks, 6 days. This interval was chosen based on being the earliest available time with more than 75% of the cohort represented to reduce the risk of higher bias due to the small sample size and the potential in early pregnancy of rapid dosing adjustments after discovery of pregnancy to improve glycemic control. In addition, the end of the first trimester has been described as a relatively stable interval in previous literature. 18 –20
To analyze whether the glycemic control performance was associated with pregnancy outcomes, we explored differences in maternal gestational CGM TIR based on three outcomes: (1) composite outcome of maternal complications, including gestational hypertension, preeclampsia, polyhydramnios, or preterm labor, (2) whether the newborn was LGA, which was defined as birth weight greater than 90th percentile for gestational age, 26 and (3) whether the newborn was admitted to neonatal intensive care unit (NICU) for any amount of time. Independent samples t-test is used for the statistical evaluation of differences.
MATLAB version 2019b and R version 3.5.3 were used in data preprocessing and statistical analyses.
Results
Patient characteristics and data
Twenty-five women with a mean age of 30.2 ± 4.8 years had delivered as of September 2020 and were included in this analysis (see Table 1 for further demographic data). Women were enrolled at a mean gestational age of 11.2 ± 3.9 weeks and delivered at a mean gestational age of 37.7 ± 1.6 weeks. HbA1c at enrollment was 6.6% ± 0.9%.
Participant Demographics
Mean ± SD for quantitative and count (percent) for categorical data
One of the Medtronic pump users switched to Tandem t-slim in the last biweek of their pregnancy
Pedersen and Pedersen. 30
BMI, body mass index; HbA1c, hemoglobin A1c.
Due to the variability of gestational age at enrollment, the number of available and valid data points for gestational ages 12–36 weeks were greater compared to earlier pregnancy weeks. The number of participants and average number of days per participant analyzed for each gestational age are detailed in Supplementary Figure S1. Data from the day of delivery were not included in the analyses. Overall, average available data per participant were 186 ± 30 days from enrollment until delivery; 91% ± 7% passed the validity criteria for CGM and 96% ± 6% passed the validity criteria for insulin infusion data. The intersection of both CGM and insulin data was valid in 87% ± 7% of the available days, and 89% ± 20% passed for the carbohydrate validity from enrollment to delivery.
Baseline weight at enrollment was 77.7 ± 15.9 kg with a body mass index of 28.6 ± 6.2 kg/m2. Linear model fits on the gestational weight gain showed an average of 0.42 ± 0.14 kg/week increase (Supplementary Fig. S2).
Glycemic metrics
Mean HbA1c was 6.5% ± 0.9% in the first trimester and stable at 6.2% ± 0.8% and 6.3% ± 0.7% in the second and third trimesters, respectively. Number of HbA1c measurements taken per participant by their clinical care team was 6.4% ± 2.8% with mean of 39 ± 18 days between measurements.
The cumulative TIR per participant across pregnancy was 59% ± 14%, which is below the clinical recommendation. There was no significant difference between the daytime and nocturnal TIR (daytime: 59% ± 16%, nighttime: 61% ± 13%, P = 0.3). Overall time above target was 38% ± 15% and time below target was 3% ± 3%. Figure 1 depicts a biweekly breakdown of the average and standard deviation of these metrics. Only seven participants achieved ≥70% TIR cumulatively over their pregnancy.
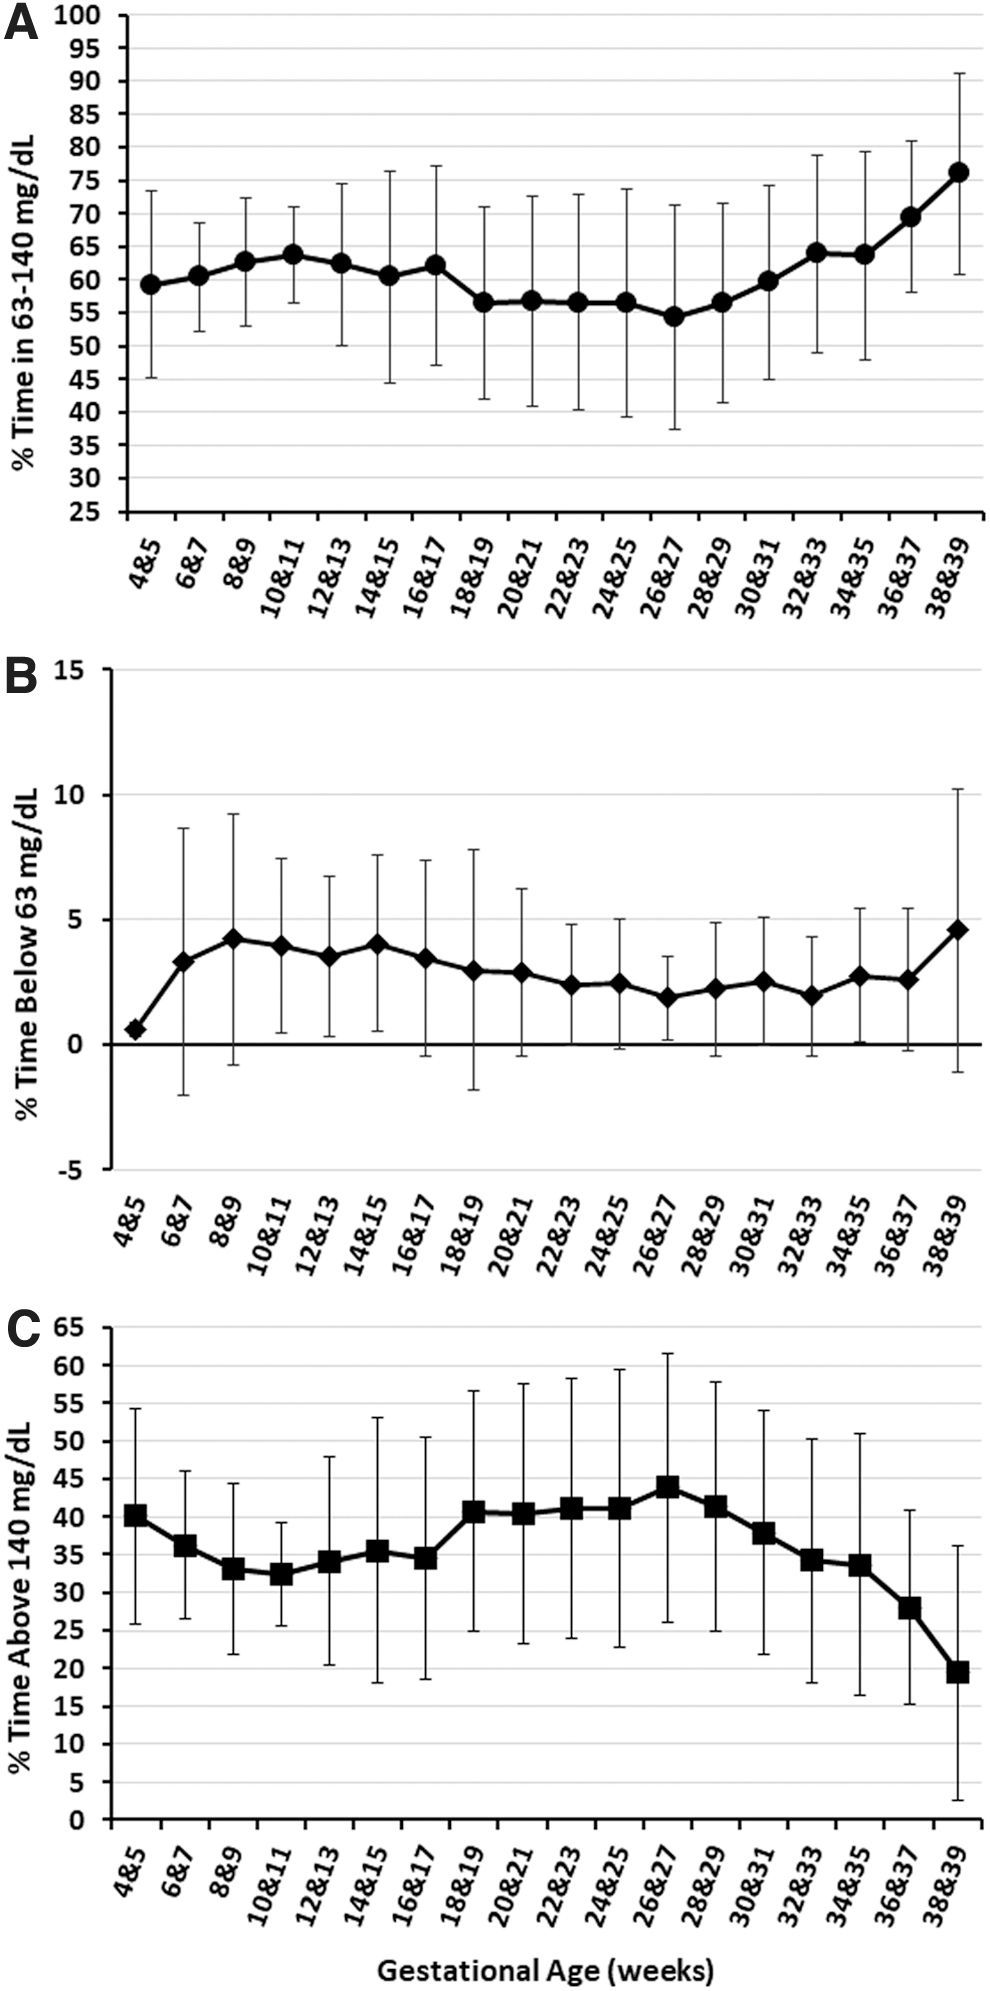
CGM outcomes presented as mean ± SD.
Significantly lower mean daily percentage of TIR (ranging from 59.6% to 61.7%) and a higher time above range (ranging from 36.8% to 37.9%) were observed between 18 and 29 weeks, 6 days (Fig. 1 and Table 2). After 30 weeks, there was a trend of increasing TIR and decreasing time above range, which does not meet significance until 38 weeks to 39 weeks, 6 days (TIR 73.8%, time above range 22.9%). The percentage of time below the target range was significantly lower between 22 and 33 weeks, 6 days (0.8%–1.5%) (Fig. 1 and Table 2).
Linear Mixed-Effects Regression Analyses' Results for Daily Percentage of Continuous Glucose Monitoring Below, Within, and Above the Target Range of 63–140 mg/dL by Gestational Biweeks
The presented values are LME model estimates presented as estimate [standard error]. CGM data on the day of delivery is not included in the models.
The reference gestational age with respect to which the P-values are calculated in the models.
P ≤ 0.05.
CGM, continuous glucose monitoring; LME, linear mixed effects.
Insulin dosing parameters and insulin use
The changes in basal, bolus, and total daily insulin use per kilogram bodyweight are presented in Figure 2 along with the ratio of bolus insulin to total daily insulin throughout gestation. Evaluated by LME models, there were significant changes in basal, bolus, and total insulin use, all normalized for bodyweight. Compared to the reference biweek, significantly higher basal insulin doses were observed both during the early pregnancy weeks (P < 0.001 from 6 to 11 weeks, 6 days) and from 24 to 39 weeks, 6 days (P < 0.001). Similarly, significantly higher bolus insulin doses were observed from 18 to 39 weeks, 6 days (P < 0.001). The resulting total daily insulin use was significantly higher starting from 20 to 39 weeks, 6 days (P < 0.001) (Fig. 2 and Table 3). From the end of first trimester (i.e., 12–13 weeks reference baseline) to the end of pregnancy (i.e., weeks 38–39), there was 54% increase in the basal insulin (P < 0.001) and 60% increase in the bolus insulin use (P < 0.001). Concordant changes were observed in programmed insulin settings with insulin dosing parameters (i.e., lower carbohydrate ratio, lower insulin sensitivity factor, and higher basal insulin profile) becoming more assertive starting around 22 weeks (Fig. 3).
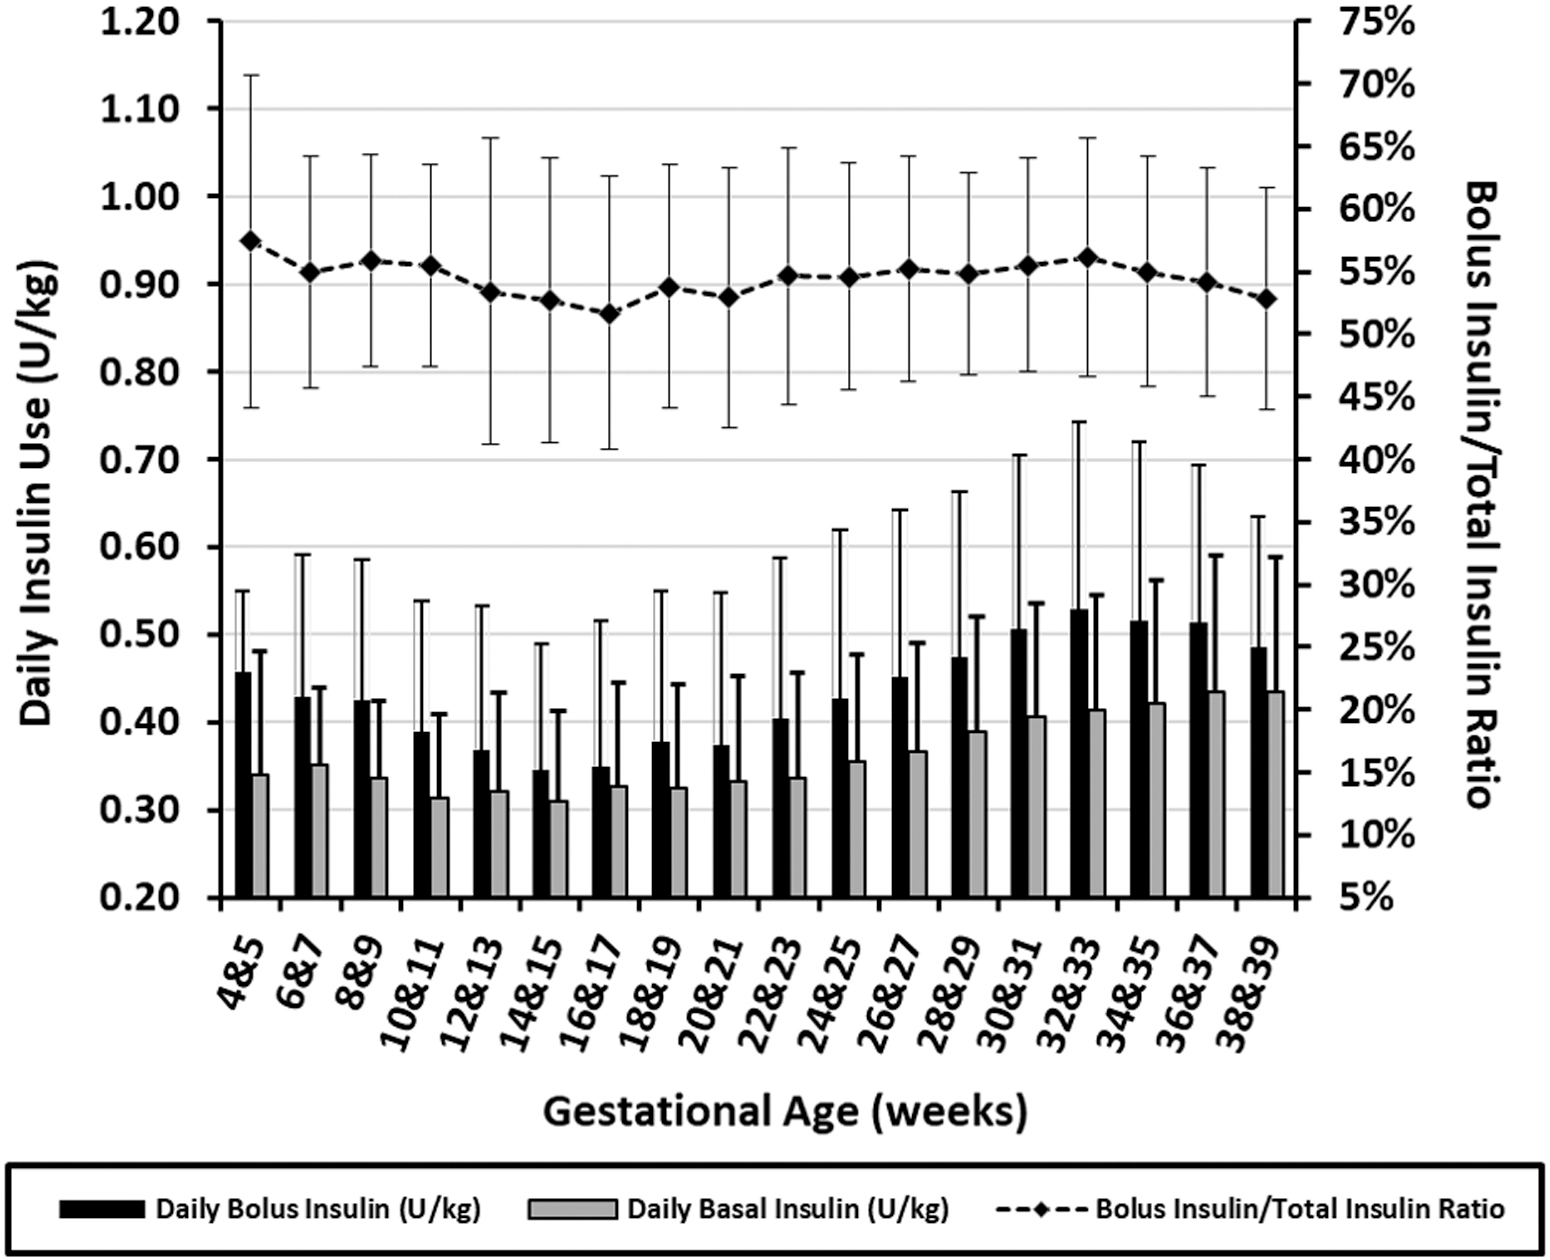
Insulin injection data by gestational age presented as mean ± SD. Bar plots show daily basal and bolus insulin use and the line plot shows the ratio of bolus insulin to total insulin use.

Changes in prescribed pump parameters by gestational age presented as mean ± SD. Two participants did not use the meal bolus calculator in their pumps; hence the daytime CR profiles are evaluated for 23 participants instead of 25.
Linear Mixed-Effects Regression Analyses' Results for Daily Basal, Bolus, Total Insulin Use, and Carbohydrate Intake Per Kilogram Bodyweight by Gestational Biweeks
The presented values are LME model estimates presented as estimate [standard error].
Pump data on the delivery day are not included in the models.
The reference gestational age with respect to which the P-values are calculated in the models.
P ≤ 0.05.
The N for the carbohydrate intake analysis is N-1 for all gestational ages, but weeks 4 and 5 since one of the participants did not enter the carbohydrate intake into the bolus calculator for most of the pregnancy.
Carbohydrate intake
Average carbohydrate intake, as entered into insulin pumps, is presented in Figure 4 for each gestational 2-week period. As observed in the figure, LME regression models confirmed no overall trends in changes in daily carbohydrate intake per kilogram bodyweight, except a lower pump-entered intake at three intervals, (1) between 4 and 5 weeks, 6 days, (2) between 20 and 21 weeks, 6 days, and (3) between 30 and 31 weeks, 6 days (Fig. 4 and Table 3).

Carbohydrate intake as entered into insulin pump presented as mean ± SD.
Pregnancy complications
During pregnancy, 8% (2/25) developed gestational hypertension and an additional 20% (5/25) developed preeclampsia, including 12% (3/25) with severe features. Two participants had possible seizures, 1 at 18 weeks gestation with confirmed hypoglycemia after vomiting and the other at 33 weeks gestation while on vacation without confirmed glucose data at the time of the event. One additional subject at 11 weeks gestation had severe hypoglycemia requiring hospital admission without seizure due to vomiting after a meal bolus. None of the women experienced diabetic ketoacidosis.
Polyhydramnios was diagnosed in 8% (2/25). None of the participants had eclampsia, oligohydramnios, or cholestasis of pregnancy. Thirty-two percent of infants (8/25) were born late preterm (at 34–37 weeks). About half of women (12/25) delivered vaginally with one requiring a forceps delivery due to nonreassuring fetal heart rate, and the remaining 52% delivered by Cesarean section (38% due to history of Cesarean section, 23% due to fetal intolerance of labor, 15% due to preeclampsia, 15% due to failure to progress, and 8% due to patient preference).
Median birth weight was 3700 g (range 2135–4345 g), and 56% of infants (14/25) were LGA. Forty percent of infants (10/25) were admitted to the NICU (40% due to respiratory distress, 30% due to prematurity, 20% due to hypoglycemia, and 10% due to intrauterine growth restriction).
Participants who had at least one maternal pregnancy complication (gestational hypertension, preeclampsia, polyhydramnios, or preterm labor) had a significantly lower TIR (maternal complication: 49% vs. no complication: 66%, P = 0.001). Similarly, participants whose newborn was admitted to NICU also had significantly lower TIR (NICU stay required: 52% vs. no NICU stay required: 64%, P = 0.05) (Fig. 5). No statistically significant difference was found in maternal TIR for participants who delivered LGA babies (LGA baby: 58%, not LGA baby: 62%, P = NS).
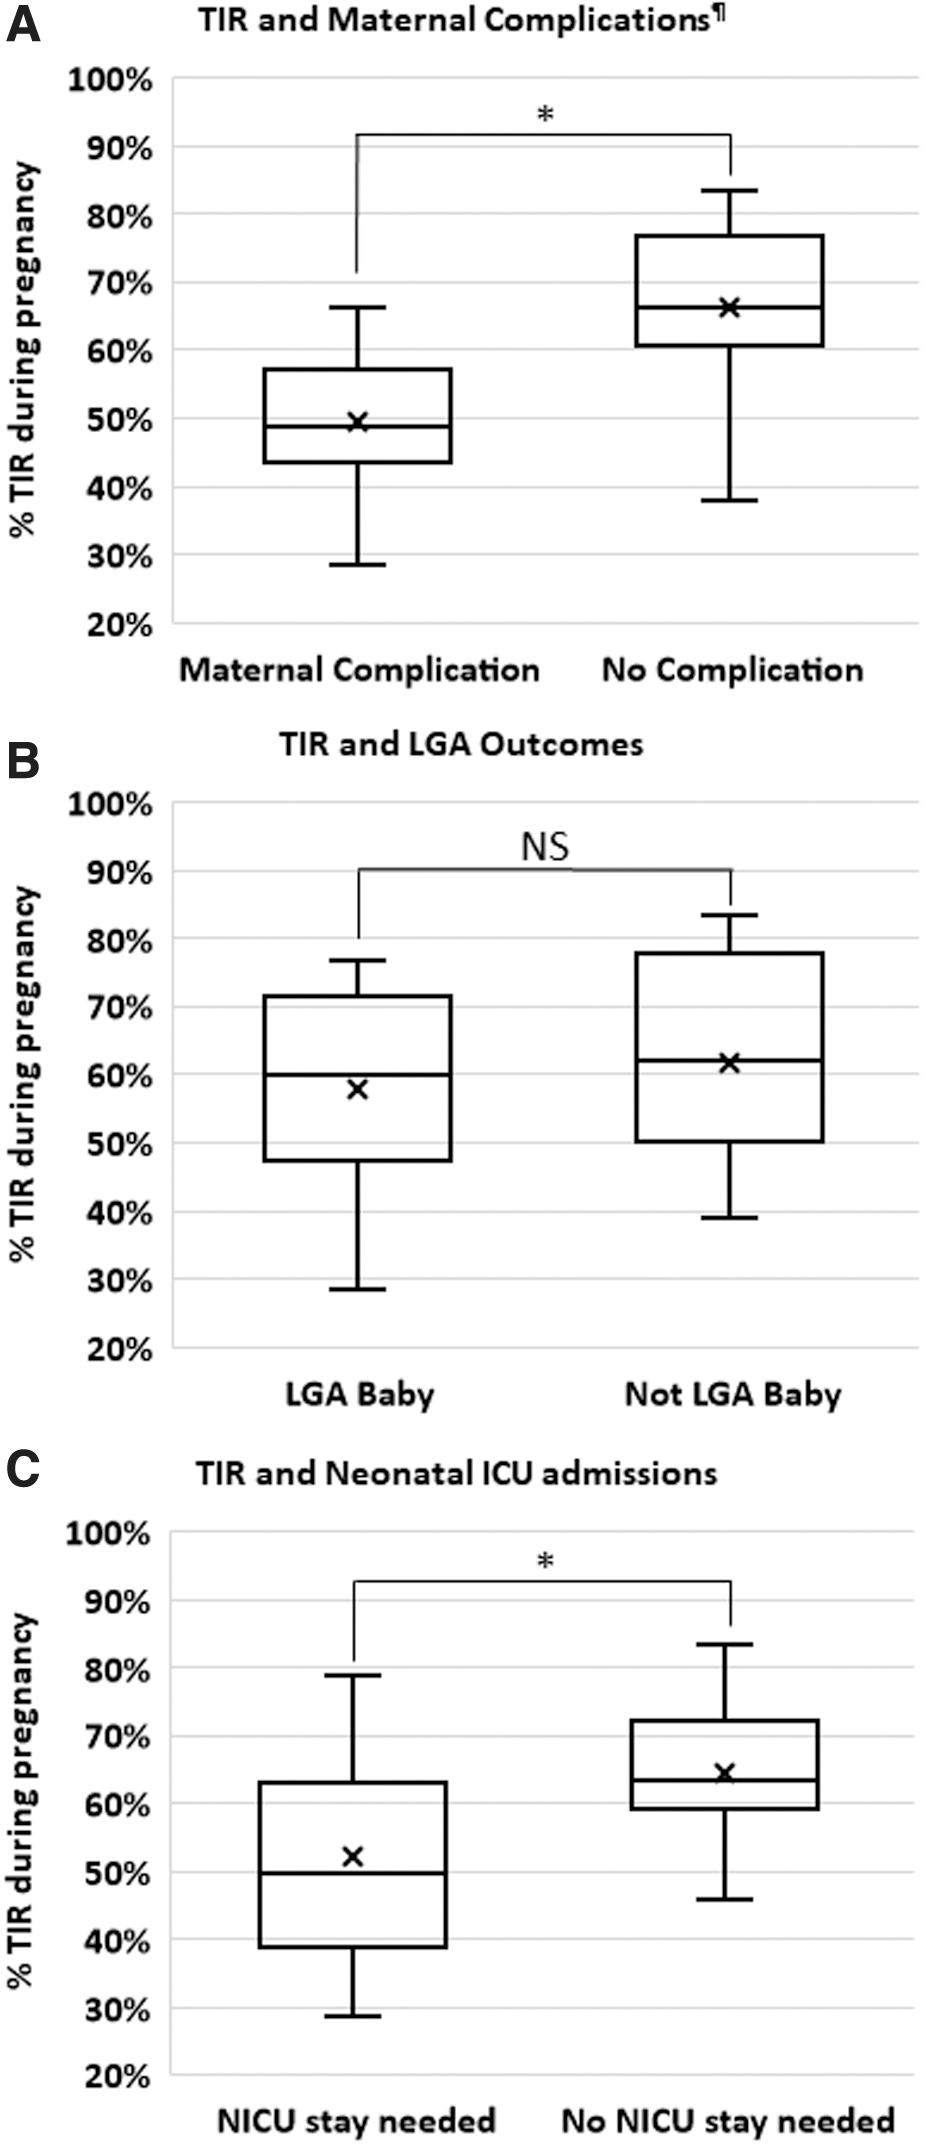
Pregnancy TIR and maternal outcomes. Association of maternal TIR and
Among the seven participants who reached TIR >70%, none had maternal complications, but 57% of them delivered LGA babies, and NICU stay was required for 29% of the babies in this subsample (none of the NICU admissions was for babies in the LGA category). Out of the remaining 18 participants who did not reach the recommended TIR, 56% had at least one maternal complication, 56% delivered LGA babies, and 44% of the delivered babies were admitted to NICU.
Discussion
Our data demonstrate insulin doses in pregnancy decrease to a nadir at the beginning of the second trimester and then trend upwards from 22 weeks onward. The increase in insulin requirements is statistically significant in the late second and third trimester. Our observations are overall consistent with the previously published literature. The insulin use trends we observed were similar to Garcia-Patterson et al.'s that primarily analyzed women using multiple daily injections. 19 Lower TIR at mid-gestation also supports previous data published in insulin pump users. 27 Other studies reporting insulin pump setting adjustments reported dose adjustments over longer time intervals, potentially missing some nuanced setting adjustments. Similar to other studies, 20,28 when our results for the glycemic outcomes and insulin use are evaluated together, it appears that increasing doses of insulin are required to counteract increased time above the target range due to insulin resistance. In addition, we observed insulin pump parameter changes from the mid-second trimester onward that are concordant with the observed changes in glycemic control for this period. Following the increase in the time above target range from the 18 weeks on, we see an increase in basal insulin and more aggressive meal dosing. With these adjustments, the average time above range stayed stable, but did not decrease until 30 weeks. This suggests that providers may need to further adjust insulin doses during the second trimester. Although changes are made, we can only speculate the reasons for less-than-ideal dose adjustments, which may have included providers making reactive as opposed to anticipatory pump setting changes, more modest setting adjustments due to concerns regarding hypoglycemia by the participant or provider, lack of patient follow-up, or therapeutic inertia. More information is needed to best determine how providers make dosing changes.
Poor glycemic control during pregnancy is a well-established risk factor associated with adverse perinatal outcomes in women with T1D. However, the observed TIR reported in observational and interventional studies remains below TIR targets, and the rates of perinatal complications remain high. Our data demonstrate the challenges of insulin dose titration to achieve glycemic targets during pregnancy even with the newest real-time CGM with high acceptance and user satisfaction. Each 5% increase in TIR improves outcomes, 27 however, attempts to optimize glycemic control during pregnancy can be complicated by the ongoing changes in insulin sensitivity and the desire to avoid potentially dangerous hypoglycemia. Given the rapid changes seen in insulin requirements from week to week during pregnancy, reactive adjustments are not likely to consistently achieve the TIR goals. The CONCEPTT study reported higher overall TIR (68% ± 13%) at 34 weeks for their participants wearing CGM as well a modest HbA1c improvement being associated with improved neonatal outcomes. 9 Our data showed similar trends of improved TIR-related pregnancy outcomes (Fig. 5) and similar HbA1c results to those in CONCEPTT. Although our study is not powered for individual outcomes, we did find that women with hypertensive disorders, polyhydramnios, or preterm labor had a lower TIR than women who did not have pregnancy complications. A similar trend was found for women whose infants were admitted to the NICU. We did not, however, find a difference in TIR for women who delivered infants who were LGA, and the women who achieved > 70% overall TIR had similar rates of LGA infants. Our data add to the growing understanding that factors contributing to LGA infants are complex and need further study and analysis to better understand the contribution of a variety of factors impacting infant birthweights.
In a detailed post hoc analysis of the CONCEPTT study, lower TIR during the second trimester was reported in insulin pump users, similar to our results. 27 Our TIR results and time above target are comparable to the results for GlucoMOMS participants. 29 Several factors may have contributed to our lower mid-gestation mean TIR compared to CONCEPTT participants, including our smaller sample size, less aggressive dosing in subjects with a history of severe hypoglycemia during pregnancy, less controlled eating patterns in the second trimester, use of insulin pumps exclusively for patient management, and no prespecified provider-based titration protocols or guidance regarding treatment goals for TIR versus HbA1c results.
The strengths of this study include its prospective design, use of latest available CGM, granular analysis of insulin pump settings and insulin delivery beyond previously published reports, and inclusion of CGM and carbohydrate intake data making it the most comprehensive analysis of glycemic management in pregnant women with T1D in the United States to date.
In our models, pregnancy stages were treated as categorical variables; hence, the temporal connection between consecutive gestational ages was not considered. While it may be a potential limitation, this approach allowed the models to avoid any assumption on the shape of a fitted curve to describe the observed changes. One limitation is nonfrequent weight measurements that were not always under the same conditions, such as the time of the day or the duration after last meal. This limitation is partially addressed by using a model fit based on the existing measurements as both the literature and data from our participants supported a linear pattern in the gestational weight gain. Finally, this study includes a small sample size, especially in the early weeks, including our reference biweek, participant selected CGM site wear that could include sites with lower accuracy, 30 and differences in provider directed titration protocols for insulin pump settings during pregnancy.
Conclusions
We present a comprehensive picture of CGM metrics, insulin treatment parameters and dosing, and pregnancy outcomes for pregnant pump users with preexisting T1D in the United States. This is of particular interest for clinical use as well as the development of future AID systems as it provides a baseline open-loop control data for CGM and insulin pump use and a priori information on the time and magnitude of changes in insulin requirements for pregnancy complicated by T1D.
There is need for improvement in glycemic control of pregnant women with T1D to meet the recommended goals and decrease the health risks related to poor glycemic control during pregnancy. Insights from our results can inform clinical guidance for longitudinal use of high accuracy CGM throughout pregnancy, anticipatory pump setting adjustments, and development of AID systems. Systems that are customized to this population's targets with changing insulin sensitivity are needed to improve outcomes and decrease maternal and fetal morbidity.
LOIS-P Diabetes and Pregnancy Consortium
John A. Paulson School of Engineering and Applied Sciences, Harvard University, Cambridge, MA: Eyal Dassau (PI), Francis J. Doyle III, Basak Ozaslan; Icahn School of Medicine at Mount Sinai, New York: Carol J. Levy (PI), Barak Rosenn (PI), Camilla Levister (I), Grenye O'Malley (I), Dushyanthy Arasaratnam, Emily Nosova, Selassie Ogyaadu; Mayo Clinic, Rochester, MN: Yogish Kudva (PI), Donna Desjardins, Ravinder Jeet Kaur, Walter K Kremers, Corey Reid, Byron Smith, Shelly McCrady-Spitzer, Mari Charisse Trinidad; Sansum Diabetes Research Institute, Santa Barbara, CA: Jordan E. Pinsker (PI), Kristin Castorino (I), Mei Mei Church (I), Jimena Perez, Molly Piper, Camille Andre.
Footnotes
Authors' Contributions
G.O., K.C., Y.K., C.J.L., J.E.P., and E.D. were responsible for study design. B.O. and W.K. designed, conducted, and interpreted the analyses in the article with support from E.D. and F.J.D. G.O. and B.O. wrote the article with support from C.J.L., E.D., J.E.P., and Y.K. C.J.L., E.D., B.R., J.E.P., and Y.K. were principal investigators at their respective sites. S.M.S. managed the IRB process. C.R. set up the online platform for data access and management. C.L., M.C., D.D., R.J.K., and S.M.S. conducted study visits and managed data collection at their sites, and B.O. was responsible for central management of data collection. All authors were responsible for reviewing and revising this article and assume responsibility and accountability for the results. E.D. is the guarantor of this work, and as such, had full access to all the data in the study and takes responsibility for the integrity of the data and the accuracy of the data analysis.
Acknowledgments
The work of the LOIS-P Diabetes and Pregnancy Consortium is dedicated to the memory of Dr. Lois Jovanovič, a pioneer in the field of diabetes and pregnancy, a tireless advocate for her patients, and a mentor to many of the coauthors. Statistical support was provided by Byron Smith, Mayo Clinic, and data science specialist Steven Worthington, at the Institute for Quantitative Social Science, Harvard University.
Author Disclosure Statement
G.O. receives research support from Tandem Diabetes, Insulet, Dexcom, and Abbot. C.J.L. has received research support from Insulet, Abbott Diabetes, Tandem Diabetes and Dexcom paid to her institution, and has received consulting fees from Dexcom and Eli Lilly. K.C. receives research support provided to her institution from Dexcom, Abbott, Medtronic and Novonordisk. J.E.P. reports receiving grant support, provided to his institution, and consulting fees and speaker fees from Tandem Diabetes Care; grant support, provided to his institution, and advisory board fees from Medtronic; grant support, provided to his institution, and consulting fees from Eli Lilly; grant support and supplies, provided to his institution from Insulet; and supplies, provided to his institution from Dexcom. WKK receives research funding from the NIH, DOD, AstraZeneca, Roche, and Biogen, all unrelated to this study. Y.C.K. reports product support from Roche Diabetes, Dexcom, Tandem Diabetes, and consulting fees from Novo Nordisk. C.M.L. receives research support from Tandem Diabetes, Insulet, Dexcom, and Abbot. F.J.D. reports equity, licensed IP, and is a member of the Scientific Advisory Board of Mode AGC. E.D. reports receiving grants from JDRF, NIH, and Helmsley Charitable Trust, personal fees from Roche and Eli Lilly, patents on artificial pancreas technology, and product support from Dexcom, Insulet, Tandem, and Roche. E.D. is currently an employee and shareholder of Eli Lilly and Company. The work presented in this article was performed as part of his academic appointment and is independent of his employment with Eli Lilly and Company. No other conflict of interest was reported.
Funding Information
REDCap data management was supported by the Research Computing Facility grant (UL1TR002377). Financial support for this study was provided by the National Institutes of Health (R01DK120358). Product support was provided by Dexcom, Inc., (AP-2018-016).
Supplementary Material
Supplementary Figure S1
Supplementary Figure S2
References
Supplementary Material
Please find the following supplemental material available below.
For Open Access articles published under a Creative Commons License, all supplemental material carries the same license as the article it is associated with.
For non-Open Access articles published, all supplemental material carries a non-exclusive license, and permission requests for re-use of supplemental material or any part of supplemental material shall be sent directly to the copyright owner as specified in the copyright notice associated with the article.
