Numerous methods have been proposed as measures of quality of glycemic control resulting in confusion regarding the best choice of metric to use by clinicians and researchers. Some methods use a single metric such as HbA1c, Mean Glucose, %Time In Range (%TIR), or Coefficient of Variation (%CV). Others use a combination of up to seven metrics, for example, Q-Score, Comprehensive Glucose Pentagon (CGP), and Personal Glycemic State (PGS). A recently proposed Composite continuous Glucose monitoring index utilizes three metrics: %TIR, Time Below Range (%TBR), and standard deviation (SD) of glucose. This review proposes that only two metrics can be sufficient when monitoring an individual patient or when comparing two or more forms of management interventions. These two metrics comprise (1) a measure of efficacy such as Mean Glucose, HbA1c, %TIR, or %Time Above Range (%TAR) and (2) a measure of safety based on risk of hypoglycemia such as %TBR, Low Blood Glucose Index (LBGI), or frequency of specified types of hypoglycemic events per patient year. By analysis of the two-dimensional graphical and statistical relationships between metrics for safety and efficacy and by testing identity versus nonidentity of these relationships, one can improve sensitivity for detection of the effects of medications and of other therapeutic interventions, avoid the need for arbitrary scoring systems for glucose values falling within versus outside the target range, and offer the advantage of conceptual and practical simplicity.
Introduction
Numerous methods have been proposed to estimate quality of glycemic control, often involving a combination of five components such as HbA1c, mean glucose, hypoglycemia, hyperglycemia, variability, and adequacy of glucose data.1–36 Recent reviews have discussed many of these methods in detail2–6 and discuss some of their properties, advantages, and disadvantages. Many of these metrics have been used successfully for analysis of clinical trial and real-world data comparing alternative methods for management of people with diabetes, both type 1 and type 2.
Three factors have been driving the search for new methods to characterize quality of glycemic control. First is the recognition that the HbA1c metric, the “gold standard” since the Diabetes Control and Complications Trial (DCCT) and United Kingdom Prospective Diabetes Study (UKPDS) studies, and metrics such as mean glucose that are highly correlated with HbA1c often do not detect clinically important changes such as those introduced by low-glucose suspend, closed loop control, and automated insulin delivery systems where the primary clinical response is often a reduction in the risk of hypoglycemia. Second, the conceptual and/or mathematical complexity of several of the previously described methods2–23 has made it difficult for clinicians and patients to understand and use the results. Third, the rapidly growing availability of Continuous Glucose Monitoring (CGM) has greatly facilitated use of simple metrics such as Mean Glucose, Median Glucose, %Time In Range (%TIR), Time Below Range (%TBR), %Time Above Range (%TAR), and Coefficient of Variation (%CV). There has been a trend away from use of a single metric (HbA1c) to use of metrics such as Mean Glucose, %TIR, or %CV.13,17,32 When these metrics are found to be insufficient, additional metrics have been considered, for example, the combination of %TIR, %TBR, and %TAR,22 or the combination of HbA1c and risk of hypoglycemia in terms of incidence of Severe Hypoglycemia (SH) per 100 patient years,1,22,23 %TBR,24 or Low Glucose Index (LGI), hyperglycemia,2 and variability (e.g., standard deviation [SD] and especially %CV),1,5,6,25–32 average within day glucose Range,17 and Mean Of Daily Differences (MODD).17 (LGI is a minor modification of the terminology and/or method of calculation of the Low Blood Glucose Index [LBGI]33 that had been originally developed for use with blood as opposed to interstitial fluid glucose34,35).
We have examined the correlations among several of these metrics3 with the goal of identifying available metrics that would be simple, readily understandable by patients and family caregivers, health care professionals, and researchers, readily calculated, and effective and efficient as a basis for comparison of outcomes for alternative therapies and interventions, and suitable for monitoring of individual patients.
Methods
We conducted a selective critical review of the literature regarding methods to describe quality of glycemic control, hypoglycemia, hyperglycemia, and glycemic variability, for glucose data obtained using either blood glucose meters or CGM, both real time and intermittently scanned.1–52 We have classified each of the available methods in terms of their inclusion of four types of metrics: overall, hypoglycemia, hyperglycemia, and glycemic variability.
Results
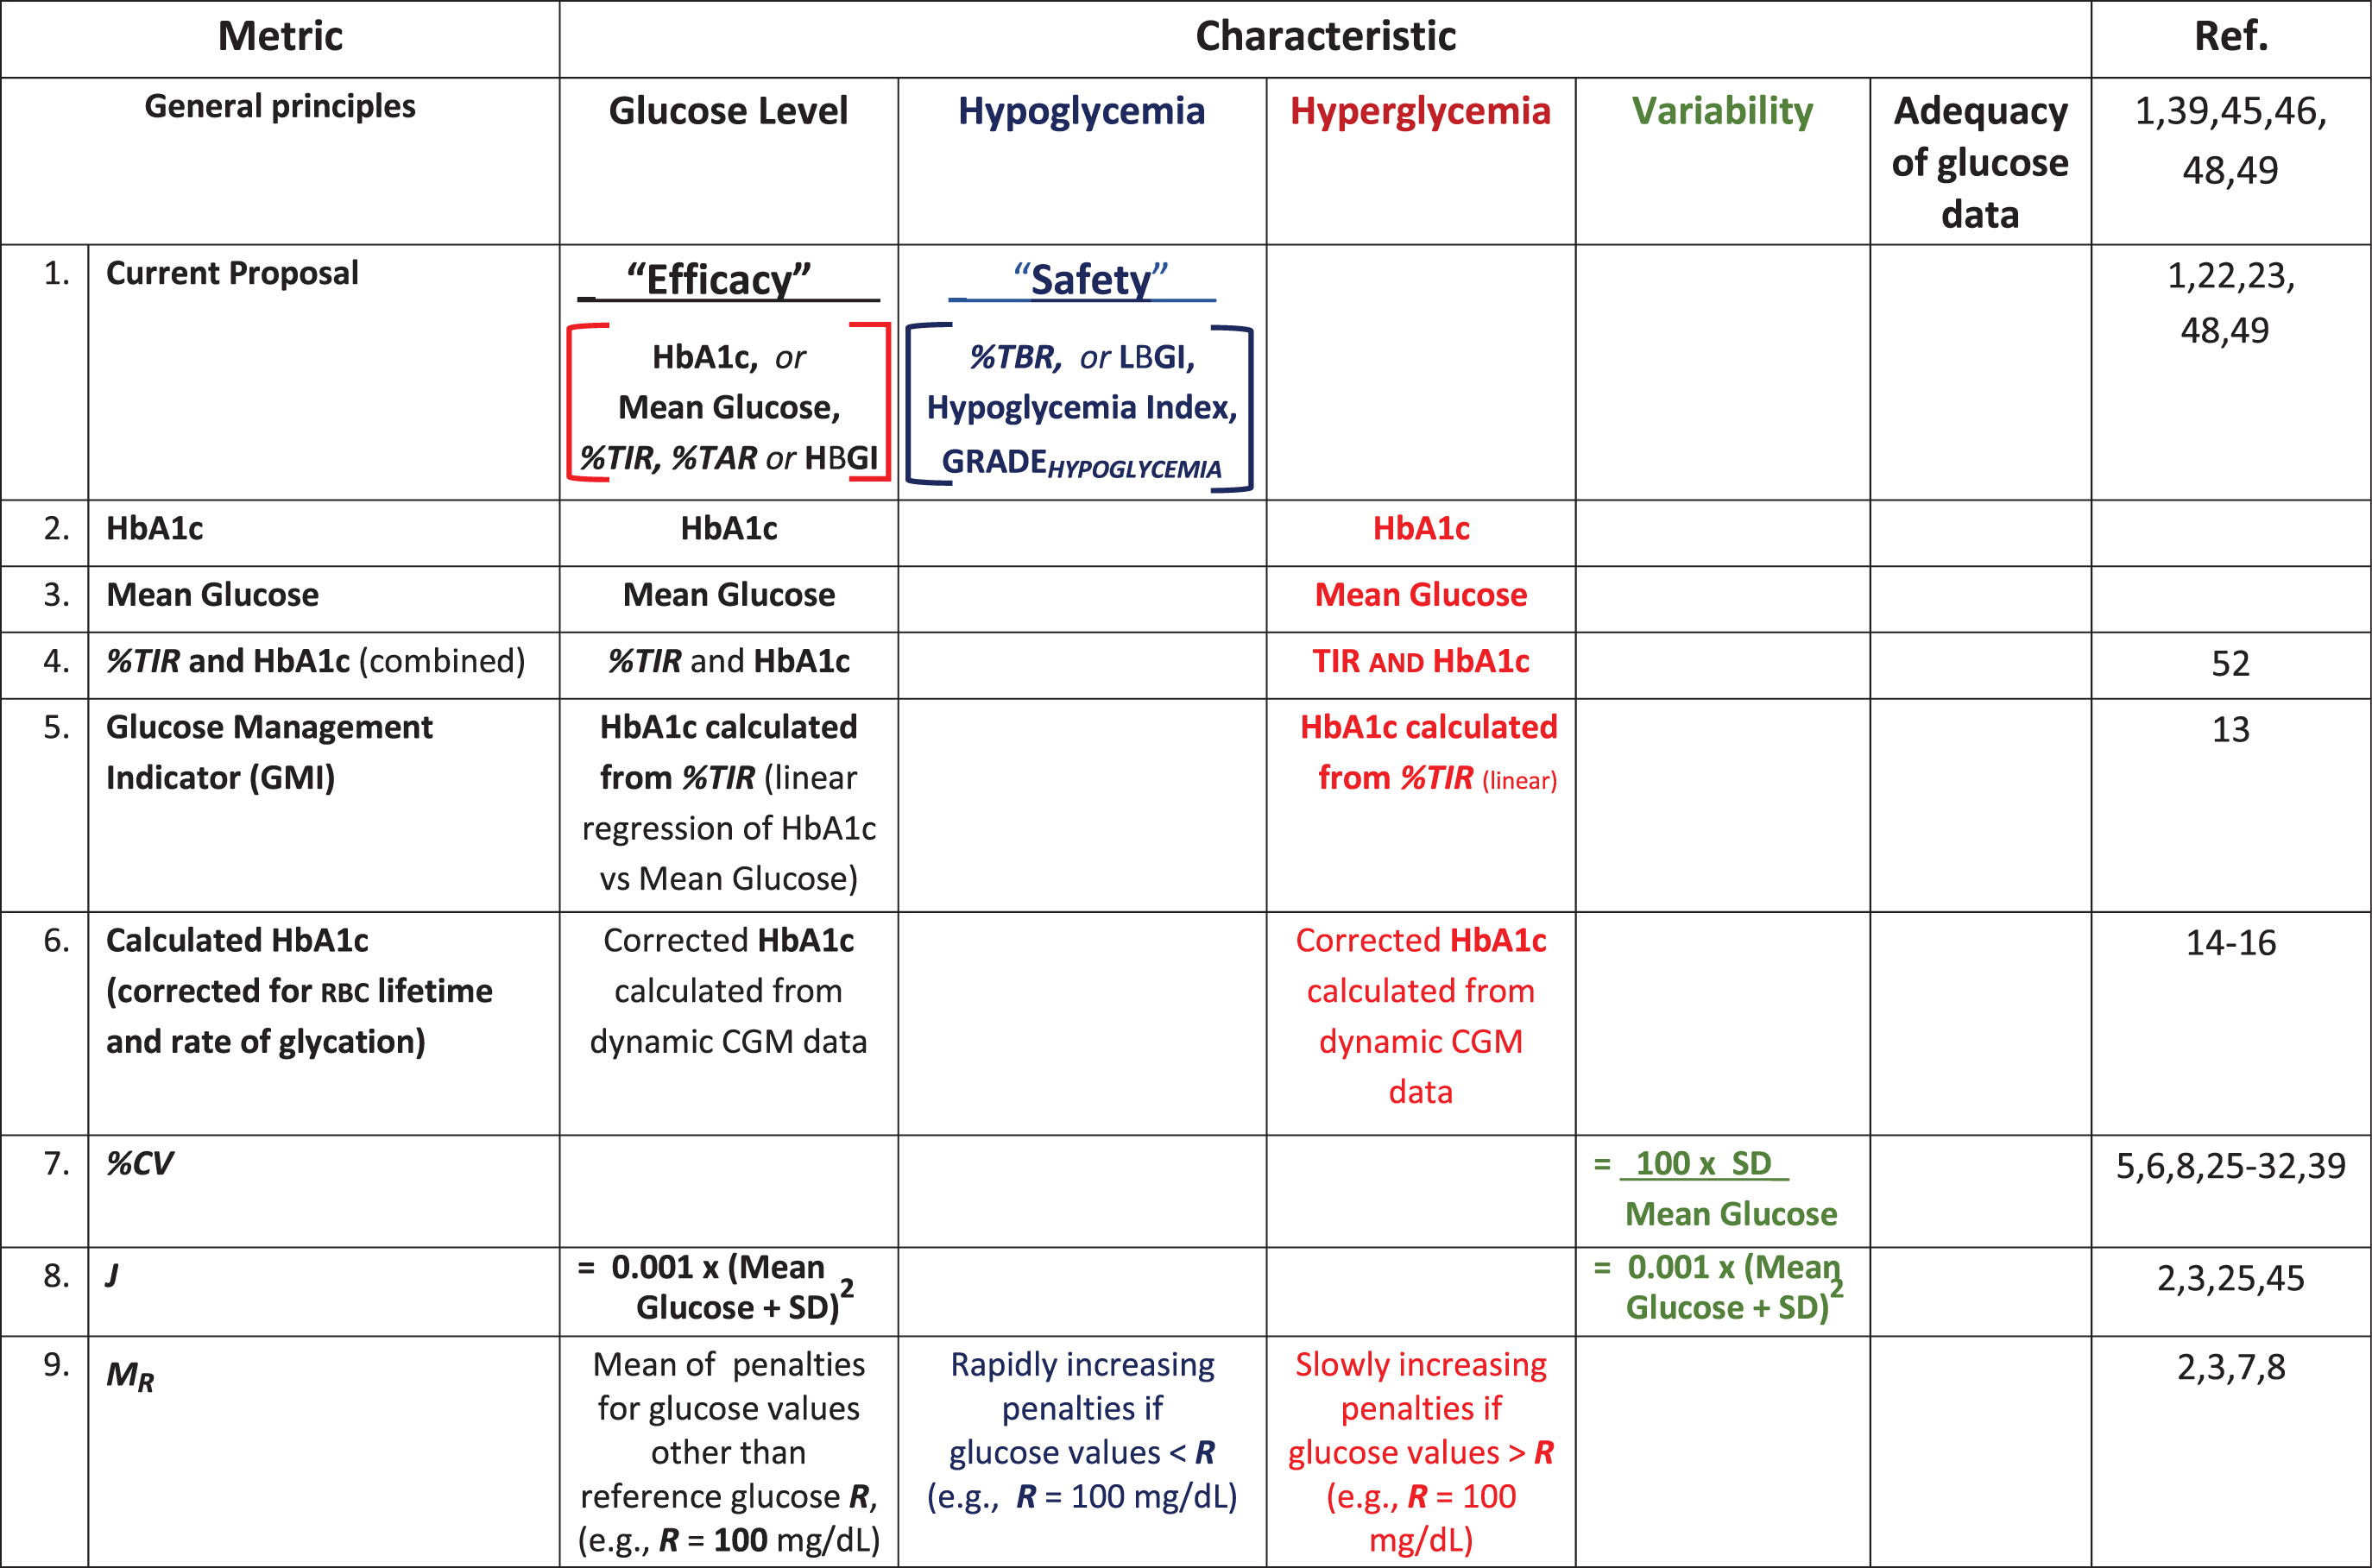
Table 1 summarizes 22 criteria that have been proposed for evaluation of quality of glycemic control and as measures of response to introduction of medications, devices, or other interventions for people with diabetes.1–39 Column headings display four major categories.1 A few methods involve only one metric: HbA1c, an estimate of HbA1c (Glucose Management Indicator calculated using only Mean Glucose;13 or HbA1c calculated from dynamic CGM data after making corrections for between subject variability in the kinetics of hemoglobin glycosylation, erythrocyte lifetime,14–16 or multiple other factors14). Other metrics utilize only a single metric, for example, Mean Glucose, J-Index (J), %CV, %TIR, and %TAR. Fifteen metrics include one or more measures of hypoglycemia. Six metrics involve a combination of Mean Glucose (or one of its proxies) with one or more measures of glycemic variability. Four metrics involve five or more components.17–21 Some of these metrics include parameters or thresholds that can be modified, for example, upper and lower glucose values defining the target range (Upper Limit of Target Range [ULTR] and Lower Limit of the Target Range [LLTR]), the thresholds for hypoglycemia and hyperglycemia, and other adjustable parameters, such as the reference value (R) in Schlichtkrull's M value relative to a selected glucose reference level, r (MR),7 and four to six parameters in Index of Glycemic Control (IGC).3,8 The recently introduced Composite continuous Glucose monitoring Index (COGI) combines three metrics, %TIR, %TBR, and SD of glucose in a formula involving six arbitrary parameters.38
Metrics for Quality of Glycemic Control
Summary of 22 criteria that have been proposed for evaluation of quality of glycemic control and as measures of response to introduction of medications, devices, or other interventions for people with diabetes. See original reports for methods of calculation. Degree of adequacy of glucose data should be considered for all methods. %CV, %Coefficient of Variation; %TAR, %Time Above Range; %TBR, %Time Below Range; %TIR, %Time In Range; AUC, area-under-the-curve; BGRI, Blood Glucose Risk Index; CGM, Continuous Glucose Monitoring; COGI, Composite continuous Glucose Monitoring Index; GRADE, Glycaemic Risk Assessment Diabetes Equation; GRI, Glucose Risk Index; HBGI, High Blood Glucose Index; J, J-Index; LBGI, Low Blood Glucose Index; LGI, Low Glucose Index; LLTR, Lower Limit of the Target Range; MODD, Mean of Daily Differences; MR, Schlichtkrull's M value for any selected glucose reference level R; RBC, red blood cells (erythrocytes); SD, Standard Deviation; SH, Severe Hypoglycemia; ULTR, Upper Limit of the Target Range.
GRADE subcomponents may be expressed as absolute calculated values or as relative percentages of overall GRADE score, possibly altering interpretation.
May be calculated using alternative values for parameters (ULTR, LLTR, a, b, c, d).
%TIR, %TBR, %TAR may be calculated with different limits for each glucose range or category (e.g., level 1, level 2, or levels 1 and 2 combined), may be considered qualitatively, individually, in pairs, or jointly, or with scoring as ‘acceptable’ or ‘not acceptable’ within individual subjects and as percentages within treatment groups.
For prediction of %TBR from mean or median glucose and SD or %CV, one may use assumptions that glucose values follow a gaussian or log-gaussian distribution or intermediate cases (39).
One method, first proposed by this author,1,22,48,52 is designated as Method 1 for comparison with the other approaches. Some of these methods are simple, based on a single metric, for example, HbA1c, Mean Glucose, %TIR, or %CV. Other metrics have a readily understandable rationale in principle, but involve mathematical transformations of glucose values involving logarithms and exponents (e.g., MR, IGC, Blood Glucose Risk Index [BGRI], and Glycaemic Risk Assessment Diabetes Equation [GRADE]), such that they can be difficult to understand by many clinicians, patients, and researchers.7–12 Methods are available for estimation of HbA1c from CGM data using a simple linear relationship with Mean Glucose13 and when using more accurate, but complex methods involving corrections for the kinetics of hemoglobin glycation, red blood cell lifetimes, and other factors.14–16 Some metrics calculate a numerical score based on several components (e.g., average glucose, hypoglycemia, hyperglycemia, and variability).1,2,17–21 Some metrics combine multiple criteria for the individual components, for example, for glycemic variability,17 hypoglycemia,18,21 or hyperglycemia.20,21
Recently, Leelarathna et al. proposed a new metric, the COGI.38COGI is based on three metrics obtained using CGM—%TIR, %TBR, and glycemic variability (SD of glucose). These three metrics are assigned weights of 50%, 35%, and 15% of the total score. [The 50 points based on %TIR increase linearly as %TIR ranges from 0 to 100; the 35 points for %TBRincrease linearly as %TBRdecreases from 15% to 0%; and the 15 points for SDdecrease linearly as SDincreases from 1.0 mmol/L (18 mg/dL) to ≥6 mmol/L (≥108 mg/dL).] Accordingly, this relatively simple metric involves three coefficients (50%, 35%, and 15% as weights) and six constraints for %TIR, %TBR, and SD to the ranges of 0% to 100%, 15% to 0%, and 6 to <1.0 mmol/L (108 to <18 mg/dL), respectively.38 Another expert panel might have selected a different set of these six parameters. Some might have preferred to evaluate the undesirable influence of glycemic variability based on %CV rather than SD39: SD is correlated with mean glucose and implicitly places greater influence on elevated glucose levels, whereas %CV is correlated with risk of hypoglycemia26–32 and implicitly assigns greater influence to hypoglycemia. Even without an explicit term regarding variability, COGI would be expected to be sensitive to the effects of glycemic variability because increasing variability is likely to increase both %TBR and %TAR, while decreasing %TIR, and vice versa.
Based on these considerations regarding COGI, we postulated that using only two metrics, one responsive to efficacy (e.g., %TIR, Mean Glucose, HbA1c, and %TAR, among others)1,3,22,48,49,52 and another responsive to risk of hypoglycemia (%TBR, LBGI, Hypoglycemia Index, and GRADEhypoglycemia) would be sufficient.1,3,22–24,33–35,49,52 Simultaneous consideration of efficacy (%TIR, Mean Glucose, and/or HbA1c) together with a metric for hypoglycemia (e.g., %TBR) combines the two dominant components of the COGI, each pertaining to a major clinical consideration (cf. Table 1).
This author had previously proposed that a combination of just two metrics, one using HbA1c as an indirect measure of mean glucose and the other reflecting incidence of hypoglycemic events, could be used to compare the quality of glycemic control for different forms of therapy, health care personnel, clinical practices, clinics, or institutions.1,3,22,48,52 Vigersky also proposed a scoring system based on the combination of HbA1c with the risk of hypoglycemia (also using incidence of SH requiring assistance from others).23,49 With the current widespread availability of CGM and the ability to measure %TBR using any desired threshold (including, but not limited to <54, 63, or <70 mg/dL), it is likely that the metric %TBR would usually be preferable to use of incidence of SH,1,23,41–43 provided that sufficient CGM data were available both in terms of quantity (duration) and accuracy.45,46 The sensitivity when using %TBR can be considerably greater than when using incidence of severe hypoglycemia because of the much higher frequency of observations and corresponding better accuracy measuring event rates. %TBR is not a single metric, in view of the fact that the threshold(s), usually set at 70 or 54 mg/dL, can be adjusted to optimize sensitivity and specificity. Several investigators have systematically compared performance of %TBR using thresholds of 50, 54, 60, and 70 mg/dL.24,37,45,46 When the threshold is set at 70 mg/dL (%TBR<70mg/dL), the correlation with other CGM metrics of hypoglycemia is highest.24,37,45,46 In contrast, setting the threshold for hypoglycemia at lower values, for example, 54 mg/dL, improves the ability to identify differences between individuals as reflected in the Discriminant Ratio (DR).45 This raises the question, “which threshold would be best?” The higher the threshold, the greater the number of events, and hence there is a smaller measurement error. The lower the threshold, the greater the specificity in terms of identifying potentially clinically important events and differences between people, forms of therapies or other interventions, and groups. The measurement error (precision) of glucose sensors also varies systematically with glucose level.50 Accordingly, one might wish to use some kind of average or integrated response reflective of the range from 50 to 70 mg/dL. Similar concerns arise when setting the limits applicable to %TAR (>180, 180–250, >250 mg/dL) and likewise for %TIR where there are multiple plausible alternatives for both upper and lower limits.45 Fortunately, the DR for %TIR and %TAR are rather insensitive to the choice of limits for the target range, and the consensus range of 70 to 180 mg/dL appears to be optimal in terms of DR.45
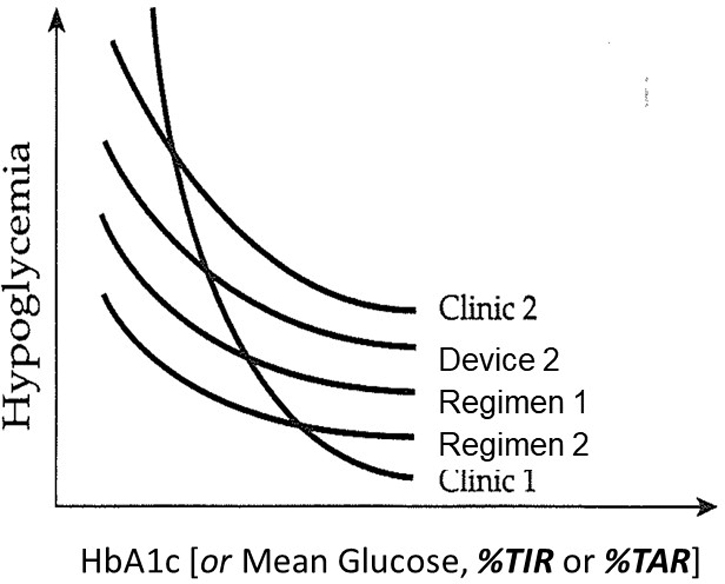
Two-Dimensional Graphical Analyses of Efficacy and Safety
Figure 1 shows a schematic drawing of the general relationship between HbA1, Mean Glucose, %TAR, or %TIR (horizontal axis) and risk of hypoglycemia (vertical axis).1 For any specified patient population, mode of treatment, and type of health care professional, clinic, or institution, one can expect a smooth curvilinear relationship.1,39,49–51%TAR is strongly positively correlated with HbA1c and Mean Glucose and highly negatively correlated with %TIR.3,22,36,37,48,52 Accordingly, either%TIR or %TAR can be used as the independent variable to be displayed on the horizontal axis in lieu of HbA1c or Mean Glucose. The graphical display (e.g., Fig. 1) and the corresponding regression analysis can be used to evaluate whether the relationships for two forms of therapy or other kinds of interventions are equivalent, corresponding to a single smooth relationship.1,41,42,48,52
Inverse relationship between risk of hypoglycemia (vertical axis) and glucose level measured by HbA1c, Mean Glucose, %TIR, or %TAR (horizontal axis), as consistently observed1,22,41,42 and as predicted theoretically1,39,48 (schematic representation, adapted from Rodbard et al.1). In principle, a characteristic curve shape is observed for different institutions or clinics, health care professionals (individuals or categories), treatment regimens, defined populations of subjects, and an individual subject. Rather than using two sequential hypothesis tests to examine the difference between two curves in either the horizontal or vertical direction, one should test the hypothesis that the data from both curves were generated from a single underlying curve: thus, the use of a single curve would result in significant loss of goodness-of-fit compared to use of two separate curves. %TAR, %Time Above Range; %TIR, %Time In Range. (Adapted from Ref. 1)
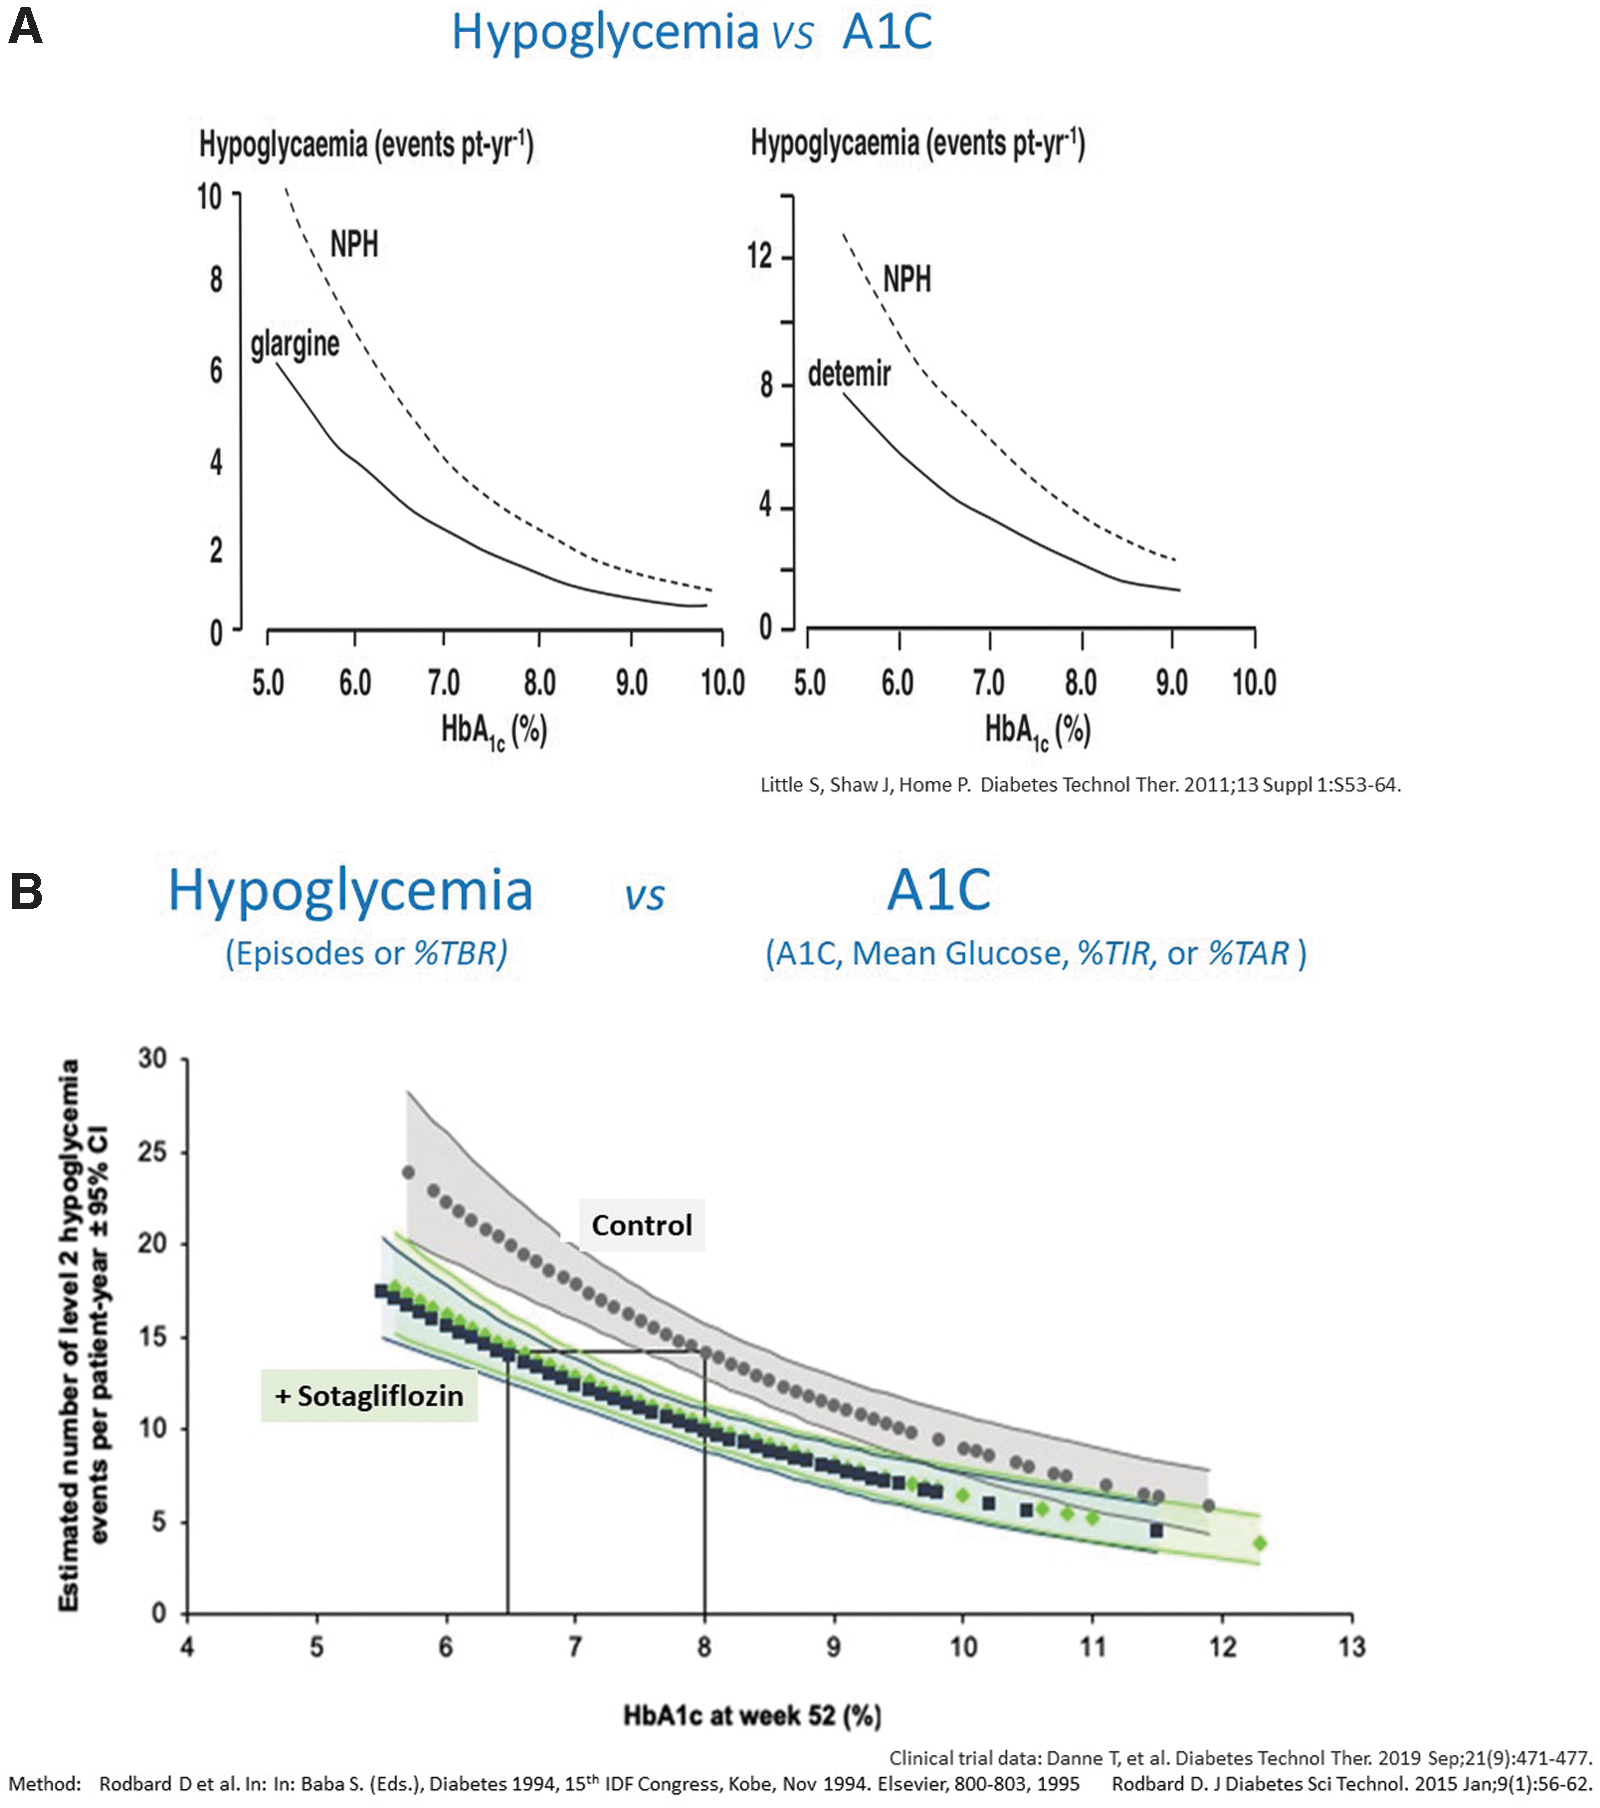
The graphical approach shown in Figure 1 has been used to examine the curvilinear relationships between incidence of severe hypoglycemia and HbA1c to compare the properties of three insulin formulations, viz., Neutral Protamine Hagedorn (NPH), glargine U-100, and detemir insulin.41 Graphical analysis (cf. left and right panels of Fig. 2A) clearly showed that insulin glargine U-100 and insulin determir were superior to NPH: the curves for glargine and detemir were markedly shifted to the left and/or shifted downwards relative to the curves for NPH insulin.41 A similar approach was used to examine the effects of addition of the SGLT1,2 inhibitor sotagliflozin to multiple daily injections (MDI) of insulin in people with type 1 diabetes (reproduced in Fig. 2B).42 The treatment group receiving sotagliflozin plus insulin showed a curvilinear relationship between risk of SH and HbA1c that was shifted to the left and/or downward of the curve for subjects in the control group who were receiving MDI of insulin alone. For any specified level of HbA1c, the group of subjects receiving sotagliflozin experienced a lower risk of hypoglycemia (cf. vertical line shown at 8% HbA1c). Similarly, for any specified incidence of hypoglycemia (horizontal line), subjects in the sotagliflozin treatment group were able to achieve a lower HbA1c than those in the control group.42
Simultaneous analysis of the relationship between Efficacy and Safety. (A) Hypoglycemia Risk versus Glucose Level (A1C) comparing NPH insulin with insulin glargine (U-100) (left panel) and insulin detemir (right panel).41 Glargine U-100 and detemir were superior to NPH. Vertical axis: hypoglycemia risk expressed in terms of events per patient year; horizontal axis: %HbA1c. (Reproduced from Ref. 41) (B) Hypoglycemia Risk versus Glucose Level (HbA1c) curves showing effect of sotagliflozin therapy combined with multiple daily injections in people with type 1 diabetes. (Reproduced from Ref. 42) Vertical axis: Incidence of “level 2” hypoglycemia episodes (glucose <54 mg/dL) per patient year; horizontal axis: HbA1c at end of trial. For any given level of HbA1c, there is a substantially lower risk of level 2 hypoglycemia for subjects receiving sotagliflozin than for controls (cf., vertical line when HbA1c is 8.0%). For any specified risk of hypoglycemia, one can achieve a lower level of HbA1c (cf. horizontal line shown between HbA1c of 8% and 6.4%) when the group considered a whole. The 95% confidence limits for the curves are shown, calculated using a negative binomial regression.42,43
Both Little et al.41 and Danne et al.42 employed “negative binomial regression”43 to test identity or nonidentity of the two curvilinear relationships. The 95% confidence intervals for the regression lines are shown in Figure 2B, indicating no overlap between the two curves over nearly the entirety of their range (Fig. 2B).42 [Comment: If risk of hypoglycemia (e.g., %TBR) were displayed on a logarithmic scale, the relationships with HbA1c, Mean Glucose, or %TIR may become approximately linear. (Douglas Muchmore MD, unpublished data, personal communication.)]
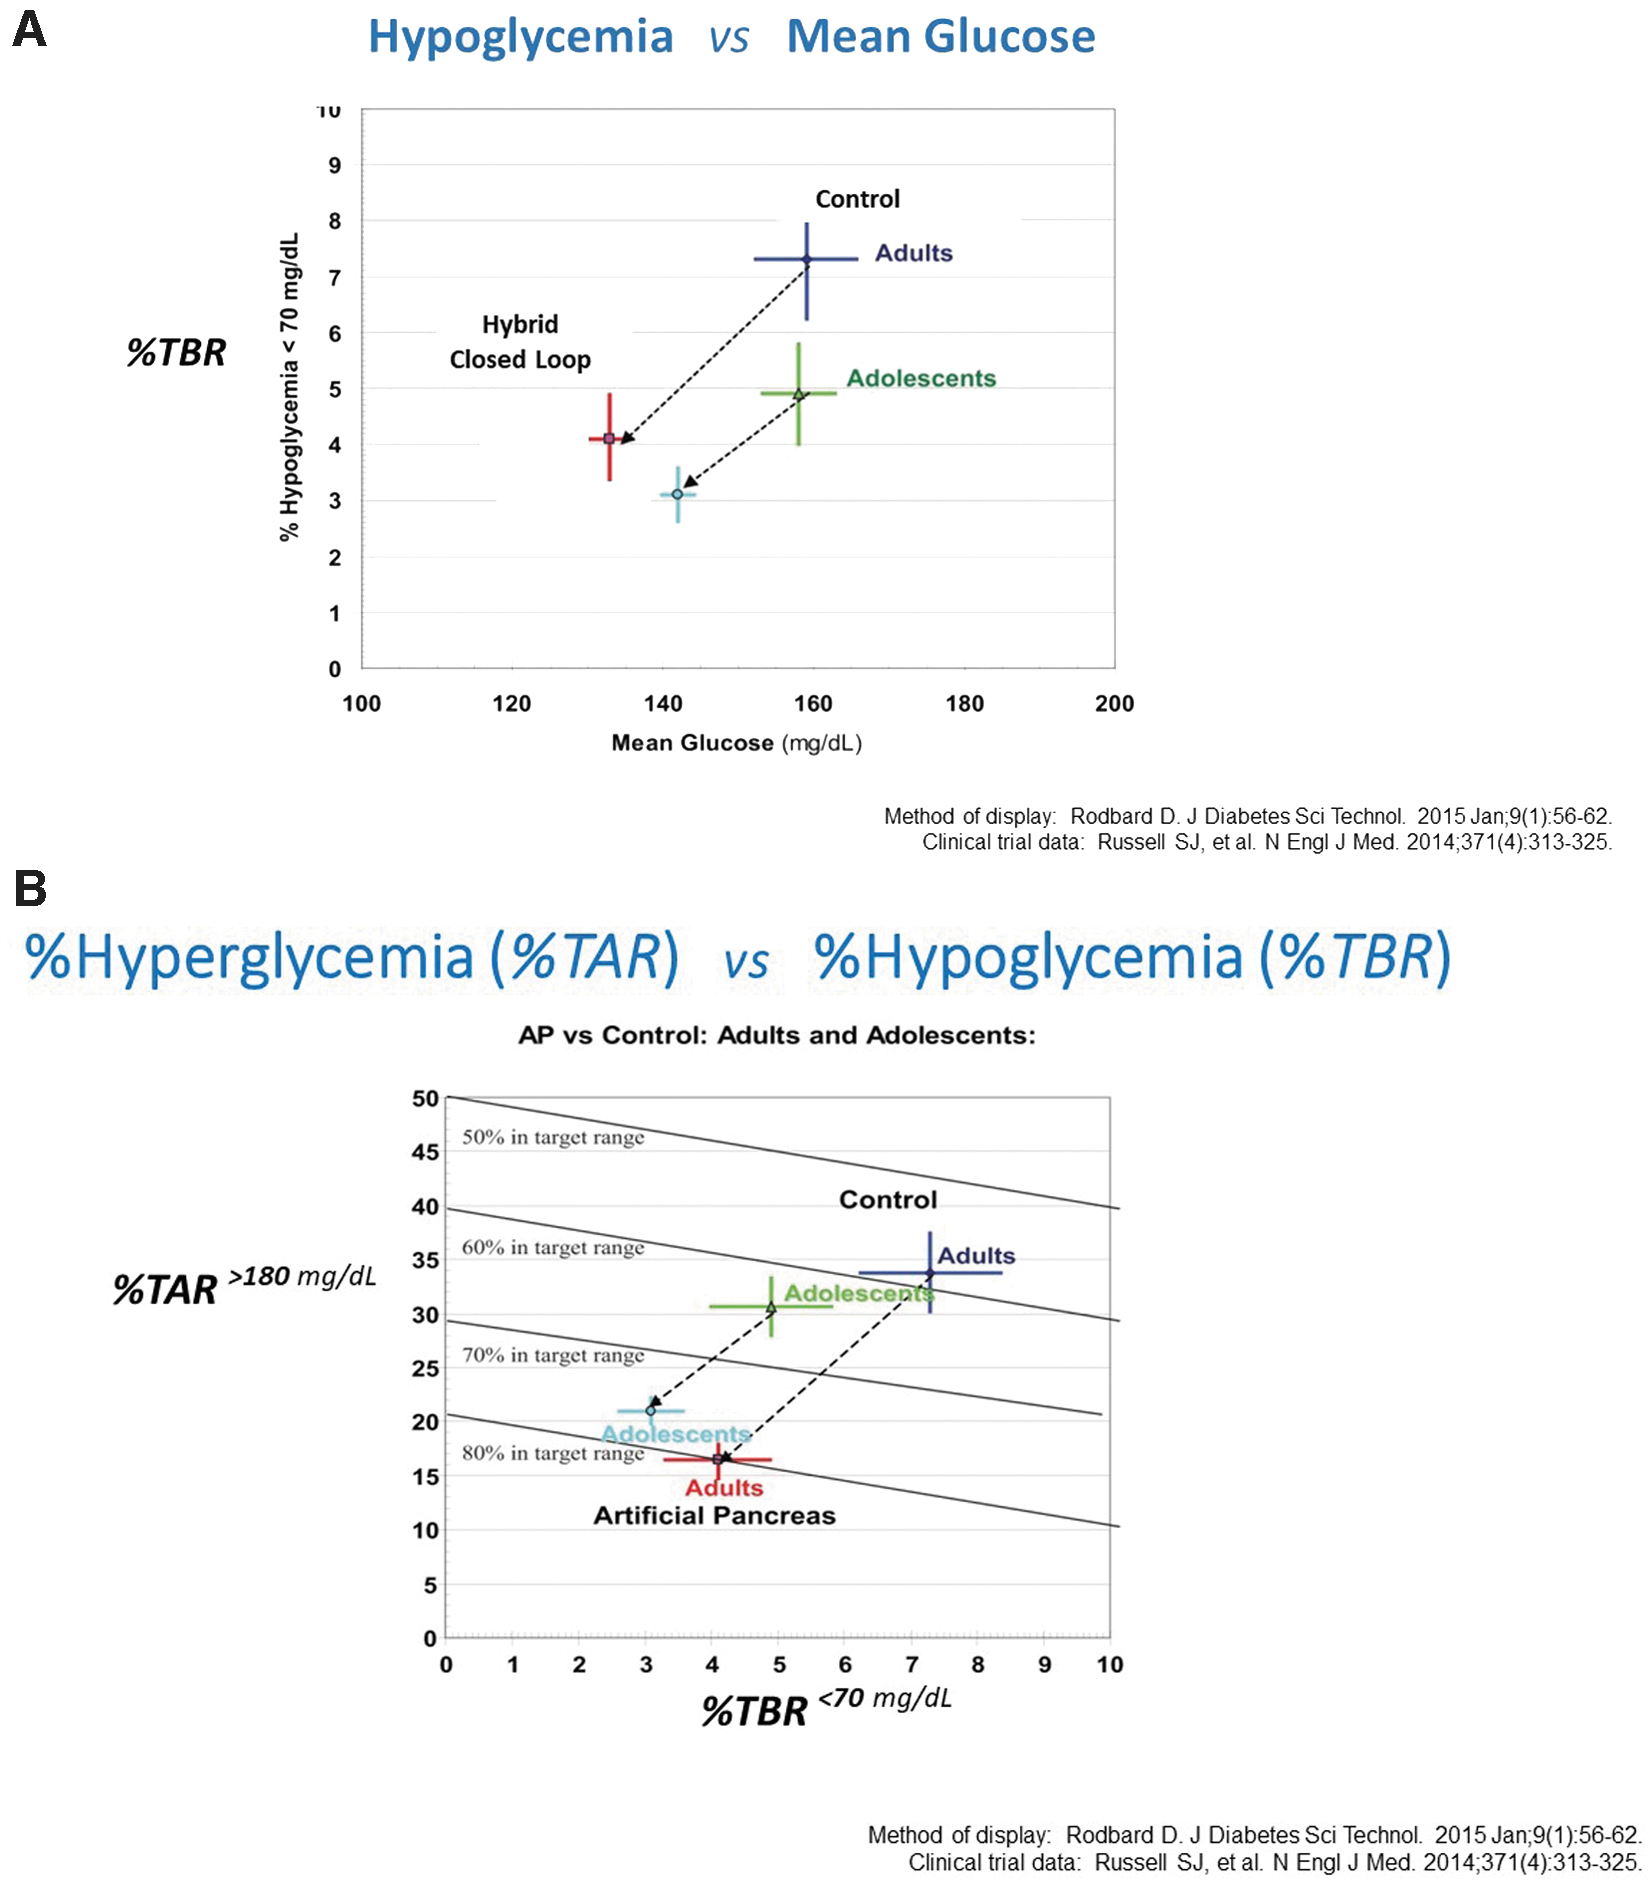
There are several alternative graphical and statistical methods to examine CGM data when %TBR and either %TIR or %TAR are available.22Figure 3A shows the relationships between %TIR and %TBR using data from a study that examined two groups of subjects—adults and adolescents—before and after introducing automated insulin delivery with a hybrid closed loop system (data replotted from table 2 of Russell et al.44). There were dramatic, approximately twofold reductions in %TBR accompanied by major changes in Mean Glucose observed in both the adult and adolescent groups. Error bars shown in Figure 3A show the standard errors of changes in %TBR and Mean Glucose as recalculated by the present author. One can evaluate the statistical significance of those changes using conventional statistical methods.
Alternative method to evaluate effect of change of modality of therapy, from sensor-augmented pump (control, baseline) to automated insulin delivery (hybrid closed loop control). The transition from sensor-augmented insulin pump to hybrid closed loop or artificial pancreas was accompanied by a marked decrease in mean glucose and by a concomitant reduction in risk of hypoglycemia (%TBR) in adult and adolescent subjects with type 1 diabetes. Clinical data from table 2 of Russell et al.44 using graphical methods of analysis described in Ref. 22: (A) Analysis of Response to an intervention (Hybrid Closed Loop) utilizing %Time Below Range (70 mg/dL) as the metric for hypoglycemia (vertical axis) and Mean Glucose as the metric for average glycemia (horizontal axis). (B) Alternative method for display of data in (A). Vertical axis: %TAR>180mg/dL, which is highly positively correlated with HbA1c and Mean Glucose and highly negatively correlated with %TIR70–180mg/dL.36,40 Horizontal axis: %TBR<70mg/dL. The %TIR70–180mg/dL can be calculated for any position on this grid: diagonal lines are shown for %TIR values in increments of 10%. The scale for %TBR is expanded by a factor of five relative to the scale for %TAR. Data source: table 2 of Russell et al.44https://www.ncbi.nlm.nih.gov/pmc/articles/PMC4183762/table/T2/ (Accessed June 17, 2021). %TBR, Time Below Range. Figures 3A, 3B adapted from Ref. 22.
As an alternative to a display of %TBR versus HbA1c (Fig. 3A), one can show %TBR versus %TAR (Fig. 3B) with %TBR displayed on the horizontal axis. Since %TAR is highly correlated with HbA1c and with Mean Glucose,36,40 the vertical axis here presents the information regarding HbA1c or Mean Glucose that had been shown on the horizontal axes in the previous figures. When HbA1c or %TAR are considered simultaneously with the risk of hypoglycemia (%TBR in this case), there is a highly statistically significant change whether interpreted graphically (Fig. 3B) or using formal statistical hypothesis testing.
Discussion
The proposal to use just two metrics representing mean glucose (“efficacy”) and risk of hypoglycemia (“safety”) has several implications.
Application to evaluation of clinical trial results
Simultaneous analysis of any one of the following variables reflecting the overall level of glycemia (Mean Glucose, laboratory measured HbA1c, calculated HbA1c13–16%TIR, %TAR) on the one hand versus risk of hypoglycemia (SH events per 100 patient years, or in terms of %TBR using <70, <54 mg/dL, or other desired threshold), can be used to evaluate the effectiveness of an intervention (Figs. 1–3). In effect, one is analyzing efficacy simultaneously with safety in terms of risk of hypoglycemia. One may elect to use alternative metrics to quantify the risks of hypoglycemia, for example, Low (Blood) Glucose Index (LBGI or LGI), Hypoglycemia Index, and GRADEHYPOGLYCEMIA.8–12,22–24 Multiple options are available for evaluating safety and efficacy simultaneously. Regulatory agencies should consider several of these approaches rather than just a single prescribed format, with the provision that studies must have been properly designed, executed, and validated in accord with standard and accepted principles of statistical experimental design and data analysis.
Application to changes in efficacy and safety
Clinical investigators often wish to evaluate the change following interventions in HbA1c (or the changes in alternative metrics reflecting efficacy, e.g., change in %TIR and change in %TAR) versus change in hypoglycemia (%TBR, LBGI, and other metrics).
Option to omit a metric describing glycemic variability (e.g., SD or %CV)
The proposed approach may make it possible to avoid the need to explicitly include a metric to describe glycemic variability such as SD of glucose as used in COGI, thereby providing a modest degree of simplification. Use of a direct metric describing hypoglycemia (e.g., %TBR and LBGI) is superior to the use of an indirect metric such as %CV, which is only weakly correlated with %TIR.26–32,39
Options for combinations or averages of metrics within the categories of efficacy and safety
One might consider use of a combination of several of the metrics for efficacy, with possible weighting, and a combination of the metrics for hypoglycemia (also with weighting). For example, one might use a combination of level 1 hypoglycemia, %TBR54 to <70mg/dL, and level 2 hypoglycemia, %TBR<54mg/dL, for example, with arbitrary weights of 1 and 3, respectively. Alternatively, one could use weighting for multiple intervals of the threshold for hypoglycemia covering the range from 54 to 70 mg/dL (approximating the effects obtained using “risk indices”1–4,7–12), in view of the pros and cons of different levels in terms of frequency, accuracy of the glucose sensor50, the DR,45 and degree of correlation with other metrics. Unfortunately, such an approach would require increased complexity.
Possible creation of a new scoring system based on two measures, efficacy and safety
Would it be helpful to create a new index based only on %TIR and %TBR or other options for metrics of efficacy and of safety? Alternatively, one could analyze the two dimensions separately using graphical and regression analyses, for example, as shown in Figures 1–3. Vigersky et al. also considered the possibility of creating methods to combine the values observed for HbA1c and risk of hypoglycemia,23,49 and the possible combination of these two metrics with a metric such as change in weight.
There are also merits to interpreting each metric separately as noted by Vigersky et al. in their proposal of the Comprehensive Glucose Pentagon (CGP).21
Should one combine the scores from a measure of efficacy and another one of safety into a single metric? One might attempt to combine the values for %TIR and %TBR in a manner similar to what is done in the COGI simply by ignoring any contribution attributable to SD and increasing the weights for contributions from %TIR and %TBR. One could assign arbitrary weights of 59% for %TIR and 41% for %TBR, so that the ratio of their weights remains nearly identical to the ratio used in COGI, that is, 50 and 35 percentage points, respectively. Since the allowable range for %TIR covers 100 percentage points and the allowable range for %TBR as utilized in COGI covers a range of only 15 percentage points, this suggests that a “1 percentage-point change in %TBR” would correspond to approximately a 4.6 percentage-point change for %TIR where the value of 4.6 is calculated as the ratio of the weights for %TBR and %TIR (35% and 50%, respectively) multiplied by the ratio of their active ranges for their numerical values in terms of percentage-points (100% and 15%, respectively). (Fig. 3B uses a scale for %TBR that is fivefold expanded relative to the scale for %TBR.) Different weighting factors would be needed: (1) if metrics are changed (e.g., if using HbA1c or %TAR rather than %TIR as the metric for efficacy or if using LGI, Hypoglycemia Index, or “frequency of severe hypoglycemic events per 100 patient years” as the metric for safety); (2) if the parameters within the metric are changed (e.g., if using %TBR using a threshold of 54 instead of 70 mg/dL); and (3) if the classification system and categories of hypoglycemic episodes47 were to change. It is also possible to combine scores from metrics that use entirely different numerical scales by use of z-scores (results expressed in terms of standard deviation units away from the mean)17 or by expressing results in terms of percentiles for a reference population.51
Flexibility in choice of response variable
This approach retains a high degree of flexibility and thus some corresponding ambiguity. We are suggesting the possibility of almost completely interchangeable use of four or more metrics for efficacy and, separately, of available metrics for hypoglycemia based on time below range (%TBR) or based on the low blood glucose indices (LBGI or LGI)33–35 and related metrics such as Hypoglycemia Index or %GRADEhypoglycemia.2–4,8–12,24,45,46 One must also define the glucose thresholds defining the target, hypoglycemic, and hyperglycemic ranges.45 One can also impose requirements for minimal duration of an event, or use area-under-the-curve, Hypoglycemia Impact, or Hyperglycemia Impact.21,24,37,45
Standardization versus customizability
The proposed approach offers great flexibility in terms of definition of available combinations of the two metrics. This can be advantageous—for example, in some studies, one or another of the parameters might not be available or may be subject to unacceptable measurement errors, while suitable replacements may be available. Analyses of the type provided by Moscardó et al.45 and Herrero et al.46 should be helpful in selecting both a response variable and duration of measurement and amount of data collected per subject. However, this would make it more difficult to standardize on a single metric or approach. In turn, this could complicate the development of a statistical analysis plan for a clinical trial. Some investigators might attempt to test several possible or plausible endpoints with the hope of achieving “statistical significance” for at least one of them. It is imperative that each investigator and investigation define the primary and secondary response variables a priori and make corrections for multiple comparisons, to avoid biases in the effective significance levels.
A recent report consistent with the ability to use only two “essential metrics” for evaluation of quality of glycemic control
Kovatchev recently reported use of a principal component analysis of metrics to evaluate quality of glycemic control52 (cf. Glucose Monitoring and AID Highlights in section 3 of Ref. 52). He reported that just two metrics, %TIR and LBGI, were sufficient to explain essentially 100% of variability in the six CGM metrics being considered (Mean Glucose, %TIR, LBGI, High (Blood) Glucose Index [HBGI], SD, and %CV). This is fully consistent with and supportive of use of these two metrics (or their highly correlated proxies) for evaluation of quality of glycemic control.
Selection of options for metrics and their parameters
Moscardó et al.45 have reported that the glucose thresholds defining hypoglycemia, target range, and hyperglycemia can be modified substantially and still maintain a high level of performance in terms of their ability to discriminate between different people—and implicitly—between groups of subjects receiving different types of interventions and treatments. Using the criterion of the DR (i.e., variability in a metric between subjects compared with the repeatability of metrics within subjects), they evaluated the reliability of various metrics. They demonstrated that there was wide latitude in choice of limits for the target range (%TIR), and similarly for %TBR and %TAR.
Use of alternatives to %TBR as metrics for hypoglycemia such as LGI or Hypoglycemia Index rather than %TBR as a metric for hypoglycemia
LGI (or LBGI) is highly correlated with %TBR and other metrics for hypoglycemia.3,6,22,33–35,45,51 Likewise, HGI (or HBGI) is highly correlated with %TAR, Mean Glucose, and other metrics for hyperglycemia.3 Moscardó et al. observed that LBGI showed a higher DR than other metrics for hypoglycemia, and HBGI showed a higher DR for hyperglycemia than %TAR.45 Accordingly, researchers should seriously consider use of LBGI as the preferred metric for hypoglycemia and HBGI as the preferred metric for hyperglycemia. Rodbard22 utilized graphical displays of %TAR versus %TBR as well as HBGI (HGI) versus LBGI (LGI). Accordingly, when one examines %TAR versus %TBR (Fig. 3B), one might equally well be using HBGI versus LBGI.22 If one were to elect to use LBGI and HBGI as the preferred metrics for hypoglycemia and hyperglycemia, then it would be very reasonable to use BGRI (Glucose Risk Index [GRI]) as a scoring system to evaluate overall quality of glycemic control.4,9,33–35
Extent of CGM data required to achieve accuracy of estimates for %TIR, %TBR, and other metrics
The minimal requirement for duration of CGM data collection for the various metrics (Mean Glucose, %TIR, %TBR, %TAR, HBGI, LBGI, and %CV) remains to be established.46 As duration of CGM data collection increases, uncertainty (standard errors) for parameters decreases nearly in proportion to the reciprocal of square root of the duration of the CGM recording and the number of glucose observations, that is, in proportion to 1/SQRT(N) where N is the number of glucose observations: cf. Supplementary Materials accompanying Ref. 46. The relative uncertainties due to measurement errors in %TBR are almost always dramatically larger than those for either %TAR or %TIR in view of the very much smaller number of glucose values and percentage of time in the hypoglycemic range.46 Similarly, the relative uncertainties in %TBR using a threshold of <54 mg/dL are much larger than when using a glucose threshold of <70 mg/dL. Herrero et al.46 describe a systematic method to estimate the uncertainties in various metrics. The number of subjects required in a clinical trial will also depend on the experimental design and variability between subjects, since the between-subject variability in parameters such as %TBR and LBGI is almost always larger than the measurement error within subjects.
Potential need to consider additional aspects of safety
We have discussed hypoglycemia as though it were nearly synonymous with “safety.” There are multiple other aspects of safety, for example, in the usual array of factors identified as adverse reactions. However, hypoglycemia is usually the rate-limiting factor when one is advancing the intensity of antihyperglycemic therapy: it is the most life threatening, most costly to the individual and to society both in terms of direct and indirect costs. Accordingly, we feel justified in regarding hypoglycemia as synonymous with safety for this discussion. In principle, one could utilize a multifactorial approach to cost-benefit analysis taking, attempting to consider additional aspects of both safety and efficacy; e.g., weight gain or loss,23 and risk of diabetic ketoacidosis (DKA)42.
When are two metrics needed?
There are many situations where two metrics are not needed. If one is testing a hypothesis regarding only efficacy without regard to hypoglycemia, then only one metric may be required. Conversely, when evaluating hypoglycemia alone without regard to mean glucose (and its correlates), one metric may again suffice. When testing the joint hypothesis, one is obliged to test both dimensions simultaneously, to assess whether the observed change in risk of hypoglycemia can or cannot be simply explained as the result of changes in Mean Glucose, HbA1c, %TIR, %TAR, or other variables correlated with them. Even when there is no statistically significant change in either response variable when tested individually, there may be a statistically significant change in response to an intervention when both response variables are examined simultaneously: the level of statistical significance (“the P value”) may change, perhaps markedly, with important clinical and regulatory implications.
Conclusion
Comparison of two or more forms of therapy can be performed using only two parameters, one reflecting mean glucose level (e.g., calculated or laboratory HbA1c values, mean or median glucose, %TIR, or %TAR) and another representing hypoglycemia (%TBR, LBGI, Hypoglycemia Index, GRADEhypoglycemia, or incidence of defined hypoglycemic episodes). %TAR can be regarded as the complement to %TIR based on both empirical data3,36 and theoretical considerations.39 If desired, efficacy and safety can be combined into a single numerical score to indicate overall quality of glycemic control.
Previous Presentations
These studies have been presented, in part, as indicated below:
Rodbard D. Computer, networking, and information systems to facilitate delivery of health care to patients with diabetes. 15th International Diabetes Federation Congress, Kobe, 6–11 November 1994.
Rodbard D. Improved sensitivity for detection of differences between alternative therapeutic modalities using simultaneous analysis of risk of hypoglycemia and measures of glycemia. Diabetes Technology Society, National Annual Meeting, 2010. Abstract A144.
Rodbard D. Composite measures of glycemic control. Presented at 9th International Conference on Advanced Technologies & Treatments for Diabetes Milan, Italy, February 3–6, 2016. Abstract 032. <https://www.liebertpub.com/doi/pdfplus/10.1089/dia.2016.2525 (Accessed June 17, 2021).
Rodbard D. Metrics for evaluation of quality of glycemic control. Presented at 20th Annual Diabetes Technology Society Meeting, 2020, Rockville, MD, USA, 2020: Diabetes Technology Society Annual Meeting, November 13, 2020. Session 1. https://ve.attendify.com/index/rpfvdi/6kmchds/schedule/A0gD7k8HDueSdGKw2T/A0pLmz3TC8NIq5YXJY (Accessed May 21, 2021).
Footnotes
Author Disclosure Statement
No competing financial interests exist.
Funding Information
No funding was received for this article.
References
1.
RodbardD, BergerM, PernickN: Computer, networking, and information systems to facilitate delivery of health care to patients with diabetes. In: Baba S, Kaneko T, eds. Diabetes 1994, Proceedings of the 15th International Diabetes Federation Congress, Kobe, November 6–11, 1994. Elsevier, Amsterdam, 1995, pp. 800–803.
2.
NguyenM, HanJ, SpanakisEK, et al.: A review of continuous glucose monitoring-based composite metrics for glycemic control. Diabetes Technol Ther, 2020; 22:613–622.
3.
RodbardD: Metrics to evaluate quality of glycemic control: comparison of time in target, hypoglycemic, and hyperglycemic ranges with “risk indices”. Diabetes Technol Ther, 2018; 20:325–334.
4.
KovatchevB: Metrics for glycaemic control—from HbA1c to continuous glucose monitoring. Nat Rev Endocrinol, 2017; 13:425–436.
5.
CerielloA, MonnierL, OwensD: Glycaemic variability in diabetes: clinical and therapeutic implications. Lancet Diabetes Endocrinol, 2019; 7:221–230.
6.
RodbardD: Glucose variability: a review of clinical applications and research developments. Diabetes Technol Ther, 2018; 20(S2):S25–S215.
7.
SchlichtkrullJ, MunckO, JersildM: The M-value, an index of blood-sugar control in diabetics. Acta Med Scand, 1965; 177:95–102.
8.
RodbardD: Interpretation of continuous glucose monitoring data: glycemic variability and quality of glycemic control. Diabetes Technol Ther, 2009; 11Suppl 1:S55–S67.
HillNR, HindmarshPC, StevensRJ, et al.: A method for assessing quality of control from glucose profiles. Diabet Med, 2007; 24:753–758.
11.
HillNR, ThompsonB, BruceJ, et al.: Glycaemic risk assessment in children and young people with Type 1 diabetes mellitus. Diabet Med, 2009; 26:740–743.
12.
HillNR, OliverNS, ChoudharyP, et al.: Normal reference range for mean tissue glucose and glycemic variability derived from continuous glucose monitoring for subjects without diabetes in different ethnic groups. Diabetes Technol Ther, 2011; 13:921–928.
13.
BergenstalRM, BeckRW, CloseKL, et al.: Glucose management indicator (GMI): a new term for estimating A1C from continuous glucose monitoring. Diabetes Care, 2018; 41:2275–2280.
14.
ChrzanowskiJ, MichalakA, ŁosiewiczA, et al.: Improved estimation of glycated hemoglobin with continuous glucose monitoring and past glycated hemoglobin data. Diabetes Technol Ther 2020. [Epub ahead of print]; DOI: 10.1089/dia.2020.0433. PMID: 33112161.
15.
FabrisC, HeinemannL, BeckR, et al.: Estimation of hemoglobin A1c from continuous glucose monitoring data in individuals with type 1 diabetes: is time in range all we need?. Diabetes Technol Ther, 2020; 22:501–508.
16.
XuY, GrimsmannJM, KargesB, et al.: Personal glycation factors and calculated HbA1c for diabetes management: Real-world data from the DPV registry. Diabetes Technol Ther 2021. [Epub ahead of print]; DOI: 10.1089/dia.2020.0553. PMID: 33395370.
17.
AugsteinP, HeinkeP, VogtL, et al.: Q-Score: development of a new metric for continuous glucose monitoring that enables stratification of antihyperglycaemic therapies. BMC Endocr Disord, 2015; 15:22.
18.
HirschIB, BaloAK, SayerK, et al.: A simple composite metric for the assessment of glycemic status from continuous glucose monitoring data: Implications for clinical practice and the artificial pancreas. Diabetes Technol Ther, 2017; 19(S3):S38–S48.
19.
PeyserTA, BaloAK, BuckinghamBA, et al.: Glycemic variability percentage: a novel method for assessing glycemic variability from continuous glucose monitor data. Diabetes Technol Ther, 2018; 20:6–16.
20.
ThomasA, SchönauerM, AchermannF, et al.: The “glucose pentagon”: assessing glycemic control of patients with diabetes mellitus by a model integrating different parameters from glucose profiles. Diabetes Technol Ther, 2009; 11:399–409.
21.
VigerskyRA, ShinJ, JiangB, et al.: The comprehensive glucose pentagon: a glucose-centric composite metric for assessing glycemic control in persons with diabetes. J Diabetes Sci Technol, 2018; 12:114–123.
22.
RodbardD: Evaluating quality of glycemic control: graphical displays of hypo- and hyperglycemia, time in target range, and mean glucose. J Diabetes Sci Technol, 2015; 9:56–62.
23.
VigerskyRA: Escaping the hemoglobin A1c-centric world in evaluating diabetes mellitus interventions. J Diabetes Sci Technol, 2015; 9:1148–1151.
24.
BeckRW, KollmanC, XingD, et al.: Outcome measures for outpatient hypoglycemia prevention studies. J Diabetes Sci Technol, 2011; 5:999–1004.
25.
Hirsch IB: Glycemic variability: it's not just about A1C anymore! Diabetes Technol Ther 2005;7:780–783.
26.
RodbardD: Clinical interpretation of indices of quality of glycemic control and glycemic variability. Postgrad Med, 2011; 123:107–118.
27.
MonnierL, ColetteC, WojtusciszynA, et al.: Toward defining the threshold between low and high glucose variability in diabetes. Diabetes Care, 2017; 40:832–838.
28.
MonnierL, WojtusciszynA, MolinariN, et al.: Respective contributions of glycemic variability and mean daily glucose as predictors of hypoglycemia in type 1 diabetes: are they equivalent?. Diabetes Care, 2020; 43:821–827.
29.
Rama ChandranS, TayWL, LyeWK, et al.: Beyond HbA1c: comparing glycemic variability and glycemic indices in predicting hypoglycemia in type 1 and type 2 diabetes. Diabetes Technol Ther, 2018; 20:353–362.
30.
TorimotoK, OkadaY, HajimeM, et al.: Risk factors of hypoglycemia in patients with type 2 diabetes mellitus: a study based on continuous glucose monitoring. Diabetes Technol Ther, 2018; 20:603–612.
31.
GómezAM, HenaoDC, Imitola MaderoA, et al.: Defining high glycemic variability in type 1 diabetes: comparison of multiple indexes to identify patients at risk of hypoglycemia. Diabetes Technol Ther, 2019; 21:430–439.
32.
MoY, MaX, LuJ, et al.: Defining the target value of the coefficient of variation by continuous glucose monitoring in Chinese people with diabetes. J Diabetes Investig, 2021; 12:1025–1034.
33.
FabrisC, PatekSD, BretonMD: Are risk indices derived from CGM interchangeable with SMBG-based indices?. J Diabetes Sci Technol, 2015; 10:50–59.
34.
KovatchevBP, CoxDJ, Gonder-FrederickLA, et al.: Assessment of risk for severe hypoglycemia among adults with IDDM: validation of the low blood glucose index. Diabetes Care, 1998; 21:1870–1875.
35.
KovatchevBP, CoxDJ, Gonder-FrederickL, ClarkeWL: Methods for quantifying self-monitoring blood glucose profiles exemplified by an examination of blood glucose patterns in patients with type 1 and type 2 diabetes. Diabetes Technol Ther, 2002; 4:295–303.
36.
BeckRW, BergenstalRM, ChengP, et al.: The relationships between time in range, hyperglycemia metrics, and HbA1c. J Diabetes Sci Technol, 2019; 13:614–626.
37.
El-LaboudiAH, GodslandIF, JohnstonDG, OliverNS: Measures of glycemic variability in type 1 diabetes and the effect of real-time continuous glucose monitoring. Diabetes Technol Ther, 2016; 18:806–812.
38.
LeelarathnaL, ThabitH, WilinskaME, et al.: Evaluating glucose control with a novel composite continuous glucose monitoring index. J Diabetes Sci Technol, 2020; 14:277–283.
39.
RodbardD: Glucose time in range, time above range, and time below range depend on mean or median glucose or hba1c, glucose coefficient of variation, and shape of the glucose distribution. Diabetes Technol Ther, 2020; 22:492–500.
40.
VigerskyRA, McMahonC: The relationship of hemoglobin A1C to time-in-range in patients with diabetes. Diabetes Technol Ther, 2019; 21:81–85.
DanneT, PettusJ, GiaccariA, et al.: Sotagliflozin added to optimized insulin therapy leads to lower rates of clinically relevant hypoglycemic events at any HbA1c at 52 weeks in adults with type 1 diabetes. Diabetes Technol Ther, 2019; 21:471–477.
RussellSJ, El-KhatibFH, SinhaM, et al.: Outpatient glycemic control with a bionic pancreas in type 1 diabetes. N Engl J Med, 2014; 371:313–325. (Table 2).
45.
MoscardóV, HerreroP, ReddyM, et al.: Assessment of glucose control metrics by discriminant ratio. Diabetes Technol Ther, 2020; 22:719–726.
46.
HerreroP, AlaliteiA, ReddyM, et al.: Robust determination of the optimal continuous glucose monitoring length of intervention to evaluate long-term glycaemic control. Diabetes Technol Ther, 2021; 23:314–319.
47.
American Diabetes Association Workgroup on Hypoglycemia: Defining and reporting hypoglycemia in diabetes. Diabetes Care, 2005; 28:1245–1249.
48.
RodbardD: Composite measures of glycemic control. Abstract 32. Presented in part at 9th Annual International Conference on Advanced Technologies and Treatments for Diabetes Milan, Italy, February 3–6, 2016. Diabetes Technol Ther 2016; 18(S1) https://www.doi.org/10.1089/dia.2016.2525 (Accessed June17, 2021).
49.
VigerskyRA: Escaping the A1c-centric role of assessing glycemic control in diabetes. Abstract 033. Diabetes Technol Ther 2016; 18(S1) https://www.doi.org/10.1089/dia.2016.2525 (Accessed June17, 2021).
50.
RodbardD: Characterizing accuracy and precision of glucose sensors and meters. J Diabetes Sci Technol, 2014; 8:980–985.
51.
BrossIDJ: How to use Ridit analysis. Biometrics, 1958; 14:18–38.
52.
CLOSE CONCERNS Knowledgebase. Closer Look. Diabetes Technology Meeting November 12–, 2020. Day # 2. Highlights. Glucose Monitoring and AID Highlights. https://www.closeconcerns.com/knowledgebase/r/2259380d?utm_source=Closer+Look+Subscribers+2018&utm_campaign=1e9b3519d8-2020-11-13_DTM_2020_Day_%232%3A_FDA_gives_u11_13_2020&utm_medium=email&utm_term=0_c55d924bf1-1e9b3519d8-409220093#Dr._David_Rodbard_and_Dr._Boris_Kovatchev_Argue_Glycemic_Control_Boils_Down_to_Two_Components:_Measure_of_Central_Tendency_and_Hypoglycemia_Exposure_Dr._Lutz_Heinemann_Argues_that_We_Still_Need_Both_Time_in_Range_and_A1c (Accessed June17, 2021).