
Abstract
Objective:
To compare the clinical profile of long-term survivors and nonsurvivors with type 1 diabetes (T1D) in India.
Research Design and Methods:
This is a retrospective study of 76 individuals with T1D who had survived for at least 40 years (“survivors”) and 51 individuals with T1D who had died with shorter duration of diabetes (“non-survivors”), from diabetes clinics in different cities of India. Prevalence of complications in both groups and causes of death of the nonsurvivors were analyzed. Retinopathy was diagnosed by retinal photography; chronic kidney disease (CKD) by urinary albumin excretion (micro-or macroalbuminuria) and estimated glomerular filtration rate; peripheral vascular disease (PVD) by doppler measurement of ankle-brachial pressure index; coronary artery disease (CAD) based on history of myocardial infarction or coronary revascularization, and neuropathy by biothesiometry.
Results:
Mean glycated hemoglobin (8.4% ± 1.5% vs. 10.7% ± 2.2%, P < 0.001), serum low-density lipoprotein cholesterol (91 ± 29 mg/dL vs. 107 ± 22 mg/dL, P = 0.004), and systolic blood pressure (135 ± 16 mmHg vs. 153 ± 37 mmHg, P = 0.003) were lower, and high-density lipoprotein cholesterol (51 ± 11 mg/dL vs. 43 ± 15 mg/dL, P = 0.002) higher, among survivors compared to nonsurvivors. Diabetic retinopathy, CKD, neuropathy, PVD, and CAD were more frequent among nonsurvivors. CAD [25.5%] and renal failure [23.5%] were the most frequent causes of death.
Conclusions:
In this first report of long-term survivors with T1D from India, we report that survivors had better glycemic and blood pressure control, more favorable lipid profiles and lower prevalence of complications compared to nonsurvivors. However, there could be other protective factors as well, which merit further studies.
Introduction
Type 1 diabetes (T1D) is one of the most common endocrine diseases in children. It is an autoimmune disease which occurs due to interaction of genetic, environmental and immunological factors. 1 Individuals with T1D have increased morbidity and excess premature mortality compared to those without diabetes, and their life expectancy is reduced by an estimated 15–20 years. 2 –4 Highest levels of mortality are seen among individuals with T1D who develop hypertension, persistent proteinuria, and declining renal function. 5 –7 Long-term survival with T1D is, however, possible and 40% of European individuals with T1D are reported to survive for >40 years 8 with life expectancy now extending almost up to 70 years. 9
The Golden Years Cohort provides a description of those who survived with T1D for at least 50 years. 10 Survivors in that cohort had higher high-density lipoprotein (HDL) cholesterol levels and a possible genetic predisposition contributing to long-term survival. The Joslin 50-year Medalist Study of T1D showed that nearly 40% of individuals with T1D of >50 years duration remained free of diabetes-related complications. Studies with over 20–30 years of follow-up have identified several risk factors, including worse glycemic control, longer duration of diabetes, hypertension, and hyperlipidemia, to be associated with increased risk of development of vascular complications in individuals with T1D. 11 The Diabetes Control and Complications Trial (DCCT) 12 and the Epidemiology of Diabetes Interventions and Complications (EDIC) 13 trial have conclusively shown the effect of tight glycemic control on reduction of long-term complications in T1D.
India is home to >95,000 children with T1D, reported to be the highest in the world, according to the 9th Edition of the IDF Diabetes Atlas. 14 Most reports on long-term survival of individuals with T1D are from the United States and Europe, and there are few studies on this from developing countries (and none from India). Such studies are important because the life expectancy in developing countries is in general, 10–15 years lower than that in developed countries. 3 In India, it is currently 67 years in males and 69 years in females. 15 In this report, we assess the clinical and biochemical profile and diabetes-related complications in a group of long-term survivors with T1D and compare them with a group of nonsurvivors with T1D. We also describe the causes of death among the nonsurvivors with T1D.
Methods and Participants
Individuals with T1D who had survived with diabetes for at least 40 years (referred to as “survivors”) were identified from the electronic medical records of Dr. Mohan's Diabetes Specialities Centre, at Chennai in southern India. We also obtained data on 51 T1D who had died of various causes with duration of diabetes <40 years (referred to as “non-survivors”). In addition, we contacted senior diabetologists and endocrinologists across India, inviting them to participate in the study by providing data on long-term (>40 years) survivors with T1D at their respective centers. All those who agreed to participate were sent a questionnaire, which captured the clinical and biochemical data on individuals with T1D from their practice. Only those individuals with T1D who provided informed consent to the use of their anonymized medical data were included in the study.
Data collection
Medical records of both survivors and nonsurvivors were reviewed. Demographic details, such as age at last visit, age at diagnosis and duration of diabetes among the survivors, and the age and duration of diabetes at the time of death among nonsurvivors, were noted along with family history of diabetes, history of hypertension, and its treatment details. For both survivors and nonsurvivors, the mean of all the glycated hemoglobin (HbA1c) values available during the year was calculated and then the mean of other variables, where data were available, was averaged. Among survivors and nonsurvivors, two HbA1c readings were available in 92.1% and 90.1%, three blood pressure readings in 64.5% and 88.2%, and one lipid profile reading in a year in 79.0% and 74.5% of individuals, respectively. For nonsurvivors, the cause of death was ascertained by examining medical and hospital records and death certificates, and wherever possible, a verbal autopsy was done.
During annual visits to the treating centers, individuals with T1D underwent the following assessments: height and weight were recorded and body mass index (BMI) was calculated as the ratio of the weight in kilograms to the square of height in meters. Blood pressure was measured using standardized techniques. 16
Biochemical assessment was done at first visit and during follow-up visits as per standardized protocols. 17,18 Plasma glucose was estimated by the hexokinase method, serum cholesterol by cholesterol oxidase–peroxidase–amidopyrine method, triglycerides by glycerol phosphate oxidase–peroxidase–amidopyrine method, HDL cholesterol by direct method-Polyethylene glycol-pretreated enzymes, and low-density lipoprotein (LDL) cholesterol was calculated using the Friedewald equation. 19 Blood urea was estimated by the glutamate dehydrogenase (GLDH) UV kinetic method and serum creatinine by Jaffe kinetic method. All analyses were performed on Beckman Coulter AU2700 (Fullerton, CA) biochemistry analyzer. HbA1c was estimated by high-performance liquid chromatography using the Variant machine (Bio-Rad, Hercules, CA). Fasting and stimulated (postbreakfast) C-peptide levels were estimated by the electrochemiluminescence method on an Elecsys2010 machine (Hitachi) at the time of first registration at the center. To obtain the stimulated C peptide value, we provided a standard breakfast and took a postprandial blood sample at 90 min. This method has been published earlier and has been used in several earlier publications as a measure of stimulated C-peptide as it helps to distinguish T1D from type 2 diabetes. 20,21 Institutional Ethics Committee (IEC) approval was obtained for the study from the IEC of the Madras Diabetes Research Foundation.
Definitions
T1D was defined based on abrupt onset of osmotic symptoms like polyuria or polydipsia, unexplained weight loss, diabetic ketoacidosis (DKA), absolute dependence on insulin for control of hyperglycemia right from the time of diagnosis and/or absent insulin reserve as shown by fasting C peptide <0.3 pmol/mL and stimulated C peptide <0.6 pmol/mL. 22
Hypertension was defined as a self-reported history of physician-diagnosed hypertension or if the participants were on medications for hypertension or had a systolic blood pressure of ≥140 mmHg and/or diastolic blood pressure of ≥90 mmHg. 23
Dyslipidemia was diagnosed as follows: hypercholesterolemia, if total cholesterol was ≥5.18 mmol/L (200 mg/dL), hypertriglyceridemia, if triglyceride levels were ≥1.69 mmol/L (150 mg/dL) or if the individual was on lipid lowering medications. High LDL cholesterol was diagnosed if LDL cholesterol was ≥2.6 mmol/L (100 mg/dL) and low HDL cholesterol was diagnosed if the value was <1.0 mmol/L (40 mg/dL) in males and <1.3 mmol/L (50 mg/dL) in females. 24
Assessments of diabetes complications, including retinopathy, microalbuminuria, macroalbuminuria, neuropathy, coronary artery disease (CAD), and peripheral vascular disease (PVD) were performed annually wherever possible as described below.
Retinopathy
All participants underwent a comprehensive ocular examination that included visual acuity measurement, intraocular pressure measurement, slit-lamp examination of the anterior segment, and fundus examination after dilatation using direct and indirect ophthalmoscopy performed by retina specialists. Digital retinal (fundus) color photography was performed using a mydriatic conventional desktop fundus camera (FF 450 Plus camera; Carl Zeiss, Jena, Switzerland) after mydriasis. The modified Early Treatment Diabetic Retinopathy Study (ETDRS) grading system was used for grading of diabetic retinopathy (DR) by retina specialists. 25
Nephropathy
Urinary albumin concentration was measured in a fasting urine sample using an immunoturbidometric assay (Hitachi 902 autoanalyzer; Roche Diagnostics). Microalbuminuria was diagnosed if the albumin excretion was between 30 and 299 μg/mg of creatinine. Macroalbuminuria was diagnosed if albumin excretion was >300 μg/mg of creatinine. 26
The Chronic Kidney Disease Epidemiology Collaboration formula was used for calculation of estimated glomerular filtration rate (eGFR), which was expressed as mL/min/1.73 m2. CKD was defined as (1) eGFR <60 mL/min/1.73 m2 and/or (2) albuminuria 30 μg/mg of creatinine or above. Renal failure was defined as eGFR <30 mL/min/1.73 m2. 27
Neuropathy
Neuropathy was assessed using a biothesiometer. The vibration perception threshold (VPT) was measured at the great toe in a standardized manner by a single observer and neuropathy was diagnosed if the mean VPT was ≥20 V. 28
Peripheral vascular disease
PVD was diagnosed by measurement of ankle-brachial pressure index (ABPI) using a Doppler probe. Blood pressure recordings were made of the brachial pulses in the upper limb. Similar recordings were made of the dorsalis pedis and posterior tibial pulses in the lower limb by inflating the cuff proximal to the ankle, and the mean of these two readings was taken as the ankle pressure. ABPI <0.9 was considered diagnostic of PVD. 29
Coronary artery disease
CAD was diagnosed based on a documented history of myocardial infarction or history of revascularization (stenting, or coronary bypass graft). 30
Statistical analysis
Descriptive analysis was used for continuous variables and categorical variables. Continuous variables were expressed as mean with SD and categorical variables as proportions. Chi squared test was used for categorical variables and Student's t-test used to compare continuous variables. Multiple logistic regression analyses were performed using survivors and nonsurvivors as dependent variables and HbA1c, systolic blood pressure, total serum cholesterol, serum triglycerides, and LDL cholesterol as independent variables. Kaplan–Meier curves were plotted for cumulative survival in relationship to the duration of diabetes among the nonsurvivor group. P < 0.05 was considered as statistically significant. All statistical analyses were conducted using the Statistical Package for the Social Sciences (SPSS, Inc., Windows V 24.0, Chicago).
Results
A total of 127 participants with T1D were included in the study, which comprised 76 survivors of over 40 years duration and 51 nonsurvivors. Of the 76 survivors, 59 were from Dr. Mohan's Diabetes Specialities Centre, which was the coordinating center in Chennai and 17 from other participating centers (5 from the Madras Medical College, Chennai; 5 from Ahmedabad, 3 from Delhi, 2 from Kolkata, and 1 each from Mumbai and Nagpur). All nonsurvivors were from the coordinating center. Among the 76 T1D survivors, 58 individuals had survived 40–49 years with diabetes, 12 individuals 50–59 years, and 6 individuals ≥60 years with diabetes.
Table 1 shows the clinical and biochemical characteristics of the two groups of participants. The mean age at diagnosis of T1D of the survivors and nonsurvivors were 15 ± 9 and 24 ± 14 years, respectively (P = 0.003). The mean age of the survivors was 61 ± 9 years, whereas the mean age at the time of death of the nonsurvivors was 39 ± 20 years (P < 0.001). The mean duration of diabetes of survivors was 46 ± 6 years, and that of the nonsurvivors, at the time of death, was 16 ± 11 years (P < 0.001). Survivors were significantly taller (mean height, survivors vs. nonsurvivors: 162 ± 11 cm vs. 148 ± 23 cm, P < 0.001). The mean body weight of the survivors at the last clinic visit was higher compared to nonsurvivors (62 ± 12 kg vs. 43 ± 18 kg; P < 0.001) and BMI was also significantly higher (24 ± 4.8 kg m2 vs. 19 ± 5 kg m2, P < 0.001).
Clinical and Biochemical Characteristics of Type 1 Diabetes Survivors and Nonsurvivors
Data shown as mean ± SD.
HDL, high-density lipoprotein; LDL, low-density lipoprotein; T1DM, type 1 diabetes.
The mean HbA1c (8.4% ± 1.5% vs. 10.7% ± 2.2%, P < 0.001), serum LDL-cholesterol (91 ± 29 mg/dL vs. 107 ± 22 mg/dL, P = 0.004) and systolic blood pressure (135 ± 16 mmHg vs. 153 ± 37 mmHg, P = 0.003) were lower, and HDL cholesterol (51 ± 11 mg/dL vs. 43 ± 15 mg/dL, P = 0.002) higher, among survivors compared to nonsurvivors. There was no difference in the fasting and stimulated C-peptide levels between the two groups. DKA was more common among the nonsurvivors compared to the survivors: (DKA 37.2% vs. 14.5% [P = 0.041]). Hypoglycemic episodes were more common among survivors (39.5%) compared to nonsurvivors (27.5%), but this did not reach statistical significance (P = 0.163).
Table 1 also shows the details of the drug treatment in the two groups. Use of antihypertensive drugs (35.5% vs. 25.5%), statins (28% vs. 7.8%), and mean total daily insulin dose (45 ± 23 U vs. 37 ± 21 U) were higher among the survivors. There was no difference in the frequency of use of renin-angiotensin-aldosterone system (RAAS) blockers between the groups.
The distribution of survivors and nonsurvivors according to quartiles of HbA1c is presented in Figure 1. The percentage of nonsurvivors in the higher quartiles of HbA1c was significantly higher compared to survivors (P < 0.001). The LDL cholesterol distributions are presented in Figure 2, which shows that more of the nonsurvivors were in the higher quartiles of LDL cholesterol (P = 0.003). Figure 3 shows that the prevalence of nonsurvivors was higher in the highest quartile of systolic blood pressure (>151 mmHg) (P = 0.027).
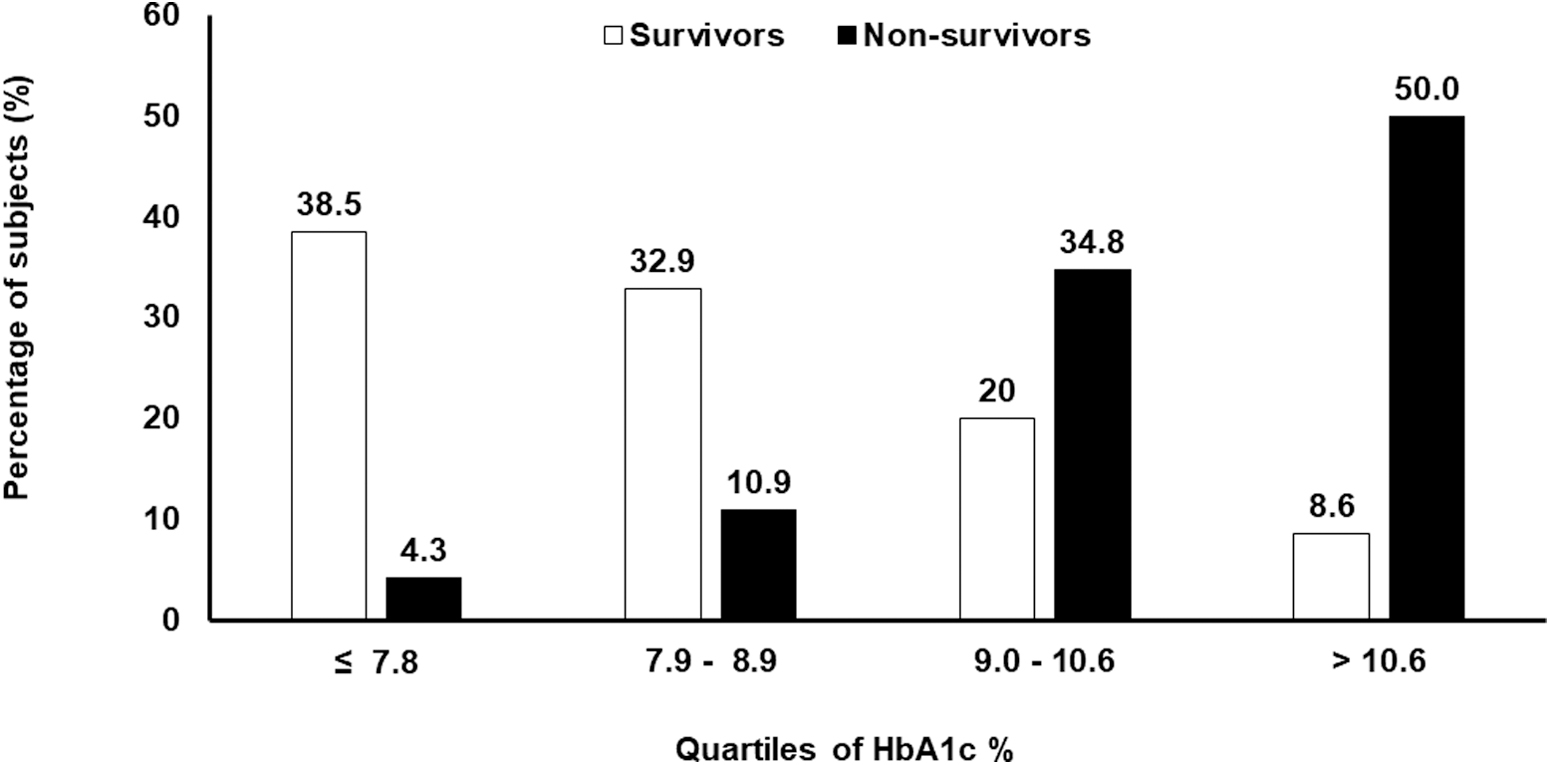
Distribution of T1D survivors and nonsurvivors according to quartiles of HbA1c. HbA1c, glycated hemoglobin; T1D, type 1 diabetes.
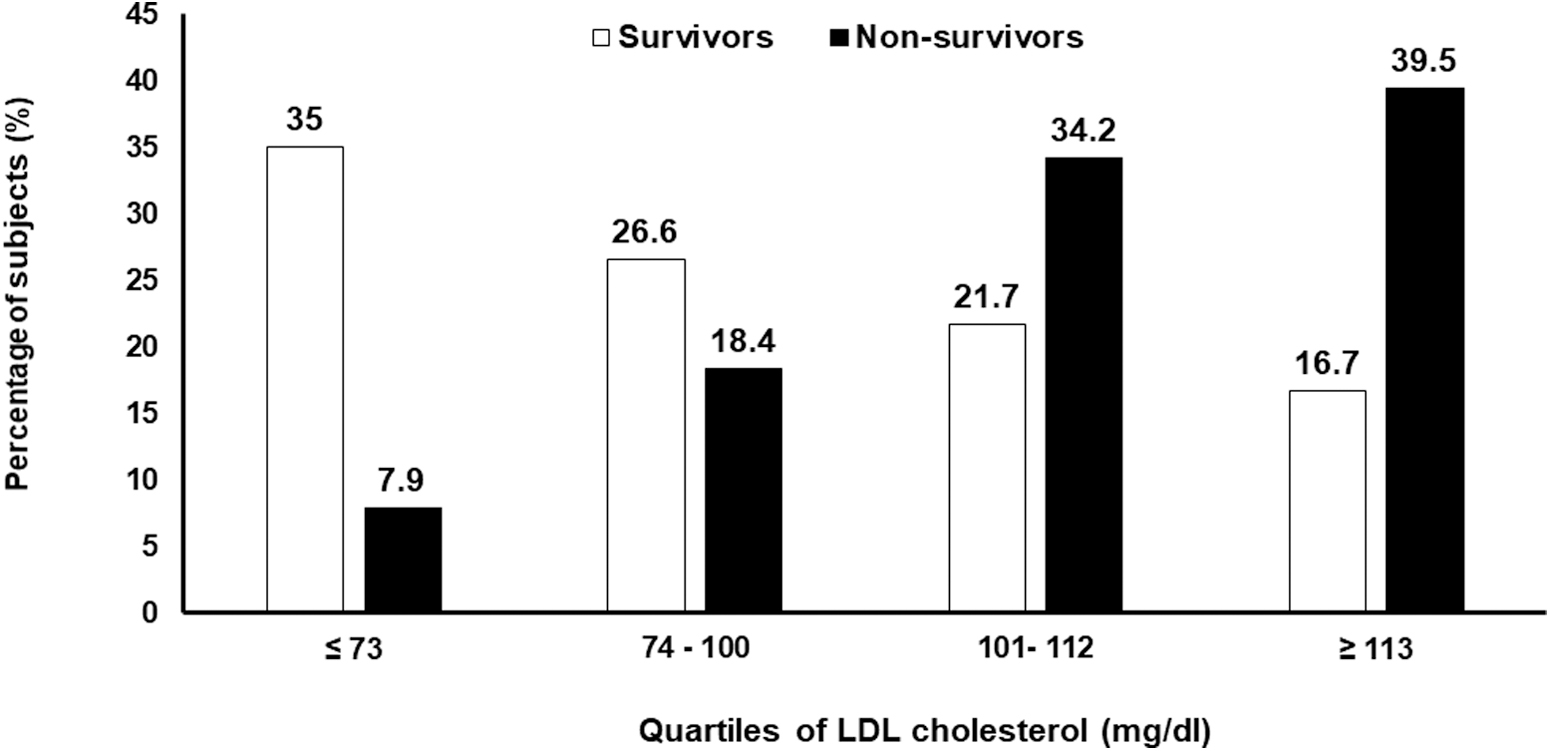
Distribution of T1D survivors and nonsurvivors according to quartiles of LDL cholesterol. LDL, low-density lipoprotein.
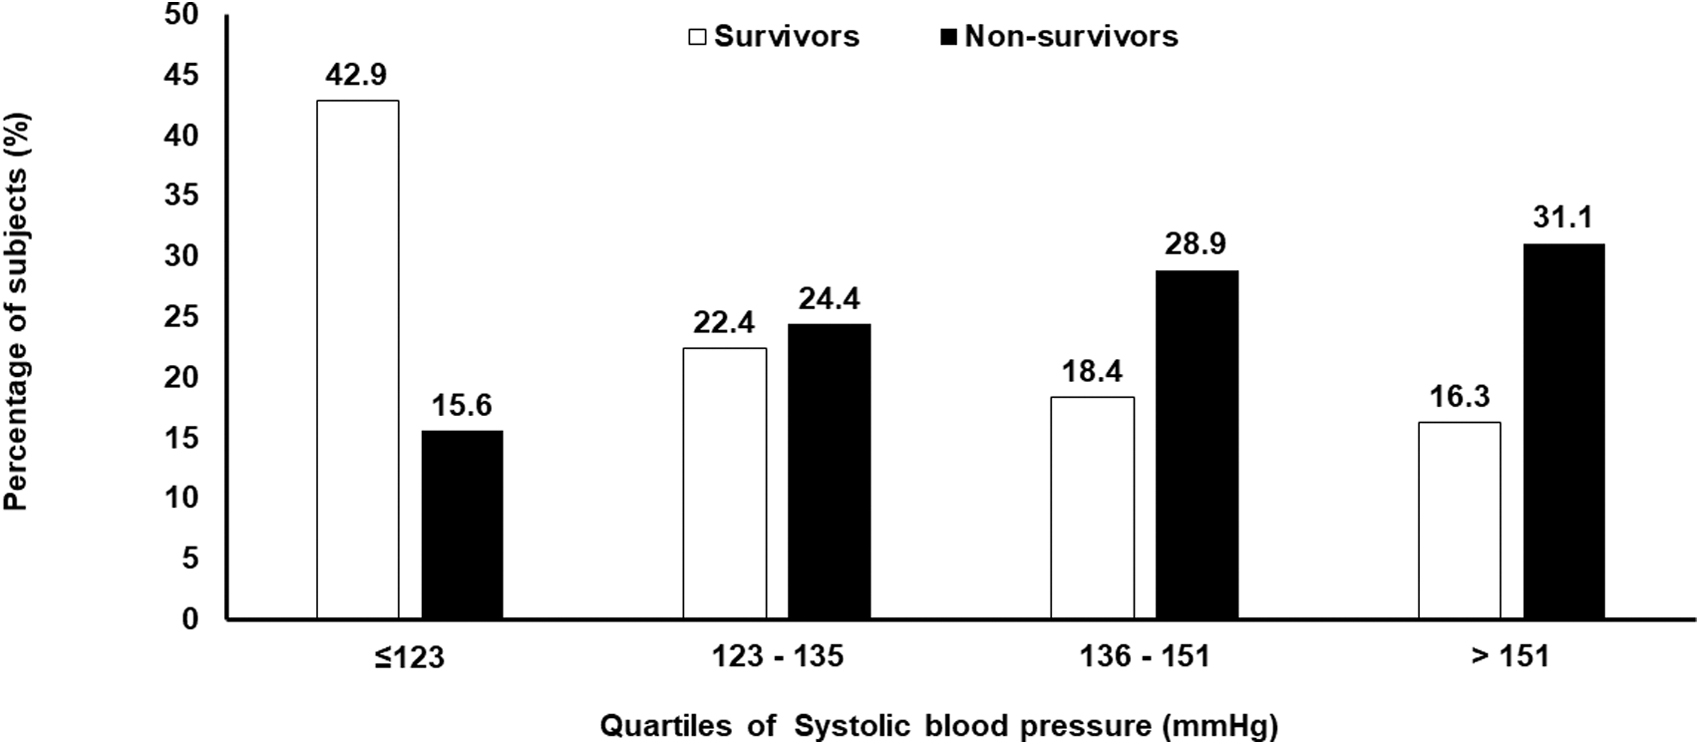
Distribution of T1D survivors and nonsurvivors according to quartiles of systolic blood pressure.
Table 2 shows the prevalence of complications among the survivors and nonsurvivors. Retinopathy screening could be done in 67 out of 76 survivors, of whom 44 had retinopathy (65.7%) (36 with nonproliferative diabetic retinopathy [NPDR] and 8 with proliferative diabetic retinopathy [PDR]). However, 23 individuals (34.3%) remained free of retinopathy. Among the nonsurvivors, retinopathy screening was done in 44 out of 51. Among these, 32 (72.7%) had retinopathy, of whom 21 (65.6%) had NPDR and 11 (34.4%) had PDR.
Prevalence of Complications Among Type 1 Diabetes Survivors and Nonsurvivors
eGFR, estimated glomerular filtration rate.
The prevalence of micro and macroalbuminuria (23.1% vs. 45.7% and 3.8% vs. 8.6%, respectively), CKD (36.4% vs. 58.8%), and renal failure (6.5% vs. 0%) were higher among nonsurvivors compared with survivors. Neuropathy was seen in 27.1% of survivors and in 37.5% of nonsurvivors (P = 0.306). The prevalence of PVD among survivors and among nonsurvivors was 10.2% and 42.9%, respectively (P = 0.001). CAD was present in 33.3% of survivors and 40.6% of nonsurvivors (P = 0.430).
Table 3 presents the logistic regression of various clinical and biochemical factors among survivors with nonsurvivors taken as the reference. Compared to nonsurvivors, survivors had lower odds ratio (OR) of HbA1c (OR, confidence interval [CI] 0.587; 0.399–0.864, P = 0.007), systolic blood pressure (OR, 0.958; CI, 0.928–0.989; P = 0.008), LDL cholesterol (OR, 0.981; CI, 0.966–0.996; P = 0.012), and serum triglycerides (OR, 0.966; CI, 0.940–0.992; P = 0.012).
Logistic Regression for Type 1 Long-Term Survivors Compared to Nonsurvivors
The most frequent causes of death among the nonsurvivors were CAD [25.5%], renal failure [23.5%], diabetes-related causes (DKA or hypoglycemia) [11.8%], cerebrovascular disease [7.8%], chronic obstructive lung disease [5.9%], cancer [3.9%], and chronic liver disease [2%] (Supplementary Table S1).
Figure 4 shows the cumulative survival of the nonsurvivors with respect to duration of diabetes. More than 35% of nonsurvivors had died within 10 years of diagnosis, and this proportion increased to 72.5% by 20 years, 84.3% by 30 years, and 100% by 40 years.
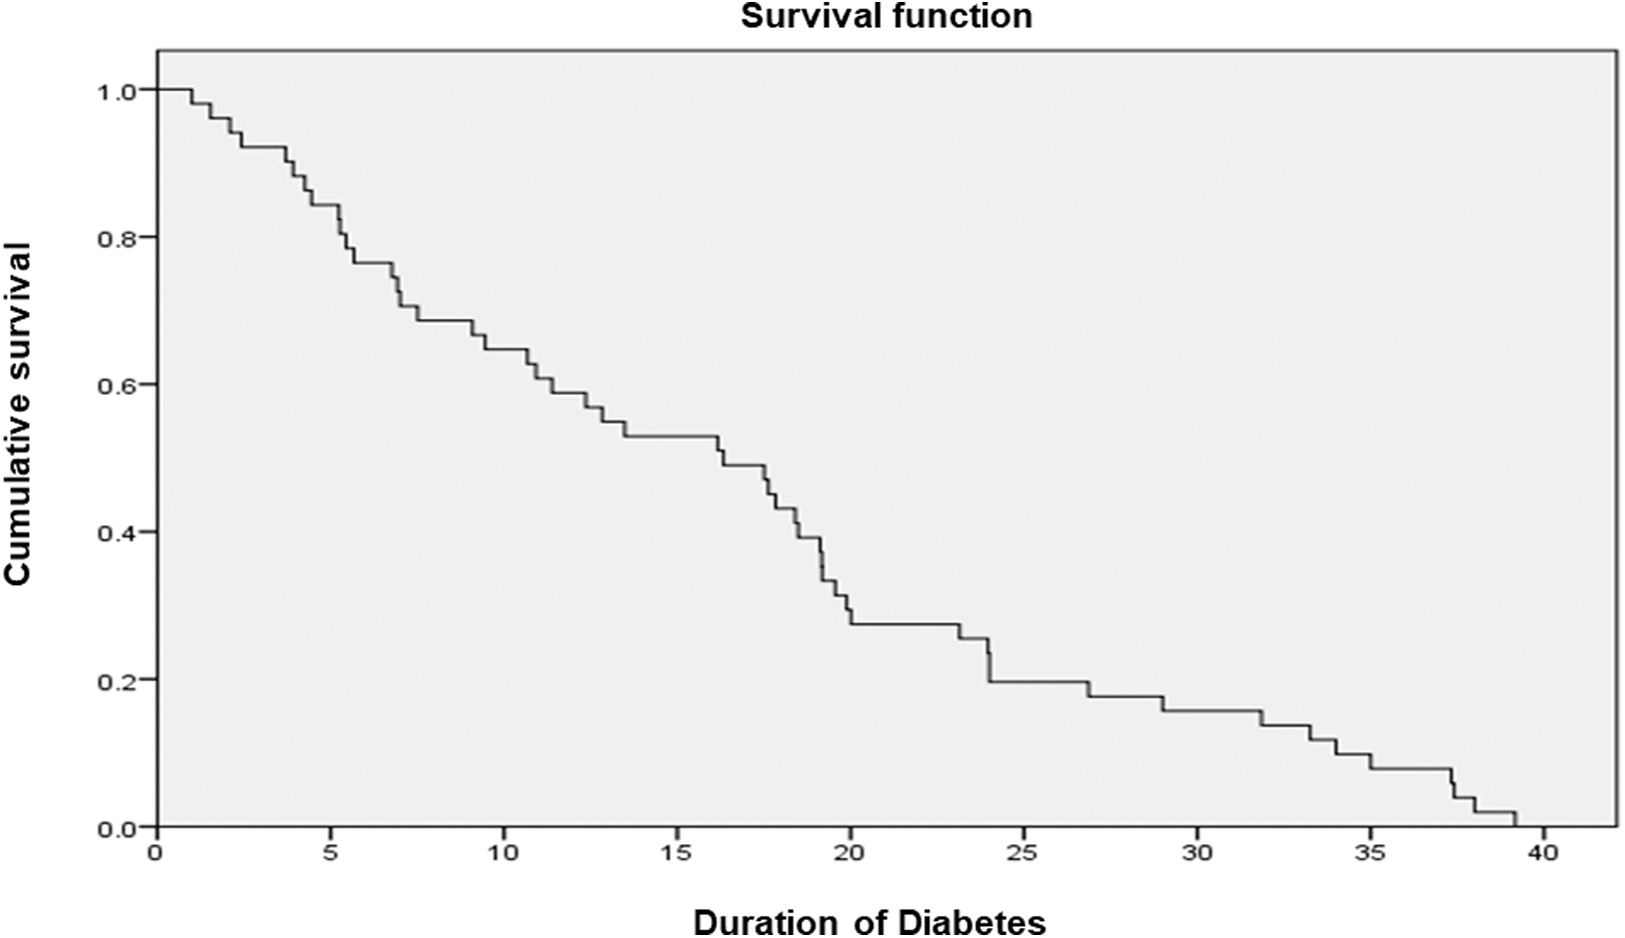
Survival curves of the T1D nonsurvivors.
Discussion
To the best of our knowledge, this is the first study from India or from any developing country to report on the long-term survivors of T1D, comparing them with a group of nonsurvivors. The study shows that the long-term T1D survivors had better control of glycemia (HbA1c), blood pressure, and LDL cholesterol levels and had higher HDL cholesterol levels. Moreover, they also had better nutrition as shown by the greater heights, body weights, and BMI.
Before the discovery of insulin, individuals with T1D had a lifespan of <3 years after diagnosis and most died within a few weeks to months of diagnosis. 31 After the discovery of insulin, survival rates of T1D increased progressively; however, even in developed countries, individuals with T1D continue to have excess premature mortality compared to those without. 32 –36 Most of the excess mortality due to T1D can be attributed to acute (hypoglycemia, DKA) or chronic complications of diabetes. In particular, end-stage renal disease (ESRD) during the middle years of life and CVD during the later years are the leading causes of death in T1D in developed countries. There is now some evidence to suggest that the proportion of death due to ESRD is declining, and that due to CVD is increasing, among T1D in developed countries. 37 The reduction in adverse renal outcomes in T1D has been attributed to more frequent use of drugs acting on the RAAS, while the increase in CVD deaths is thought to be on account of the rising prevalence of obesity and metabolic syndrome among youth in western countries. However, there is no data to our knowledge on similar trends from the developing countries, including India.
Our results suggest that CAD and renal failure represent the leading causes of death among the Indian population with T1D, as in the west. Both these are long-term vascular complications of diabetes and can be largely prevented or delayed by strict control of risk factors. 12,13 It is therefore not surprising that survivors in our study had better control of hyperglycemia, hypertension, and serum lipid levels compared to nonsurvivors. Similar findings have been reported from the Joslin Golden Years Cohort. 10
There is enough evidence to show that tight control of diabetes can also prevent or delay the appearance of complications of T1D. 12 This is particularly true for DR, an often disabling, although not lethal complication of diabetes. Retinopathy is a ubiquitous finding in long-term diabetes, and therefore it is significant that more than a third of our survivors remained free of retinopathy despite long duration of diabetes; this can, in large part be attributed to achievement of tight control of risk factors in these individuals. Other studies of T1D have also noted that retinopathy was found less frequently than anticipated among long-term survivors. 11,37
As CVD and renal disease account for most of the premature deaths in T1D, it is important to focus on risk factors other than hyperglycemia that might impact the development and progression of these complications. The presence of these, and other thus far unrecognized risk factors, could account for the relatively high prevalence of CVD in our study, as well as in other studies on T1D. 11,37 Chief among these risk factors is microalbuminuria, originally identified as an early marker of diabetic kidney disease, but now recognized as a marker of generalized endothelial dysfunction and a cardiovascular risk factor. 38 Absence of microalbuminuria has been associated with long-term survival in T1D, with >70% of participants in the Joslin 50-year Medalist study being free of microalbuminuria. 11 Other surveys have reported that 50% to 60% of long-term survivors with T1D were normoalbuminuric. 36,39 In our study also, 73.1% of the survivors were normoalbuminuric.
Both among survivors and nonsurvivors, there were more males, which reflects the gender bias among patients attending our clinic. 16,17,40 Long-term survivors in our study group tended to be significantly taller and to weigh more than nonsurvivors (although the prevalence of obesity was low). This could reflect the poor control of hyperglycemia among nonsurvivors, as uncontrolled diabetes is well known to adversely affect growth among children and adolescents and thus, their overall health. Conversely, it is possible that better nutrition, possibly due to better insulinization, protected some of the survivors. In contrast, in western countries, high prevalence of obesity has been postulated as a risk factor for cardiometabolic complications in T1D and could underlie the increasing contribution of CVD to premature mortality in T1D in these countries. As the obesity pandemic spreads worldwide, we can expect an increasing number of individuals with T1D in India and developing countries also to be overweight or obese, and this will increase the risk of developing CVD over their lifespan, especially since other causes of premature mortality are being eliminated or controlled. It has been suggested that maintaining body weight between 85% and 105% of ideal is associated with improved long-term survival in T1D. 41 Regularity of follow-up was better among the survivors at least two to three visits per year, compared to nonsurvivors (one to two visits per year). We have earlier shown that regularity of follow-up helps to reduce the incidence of complications of diabetes over a 9-year period of follow-up among our T2D patients. 42
It is of course entirely possible that long-term survivors with T1D might possess genetic or unique biochemical traits, which protect them from microvascular and macrovascular complications, irrespective of their level of control of glycemia and other risk factors. Indeed, many of the long-term T1D survivors in our study as well as other studies, were not prescribed intensive insulin therapy (currently recognized as standard of care) for the first 10 or more years after diagnosis, (some of them reportedly only took one or two insulin injections for the initial 10–15 years) despite which they seem to be protected from complications. A recent article by Perkins et al. 43 reports on the putative mechanisms by which some individuals with T1D may be protected from long-term complications and thus are able to survive longer. The mechanisms outlined by the authors for resistance to complications include the following: relative preservation of beta cell function; activation of glycolytic enzymes like pyruvate kinase M2; modification of AGE mechanisms, modifications of RAAS activation, retinol-binding proteins, and DNA damage checkpoint proteins. It is likely that as our knowledge of these mechanisms improves, we would be able to offer novel therapeutic options directed at these pathways, to enable more individuals with T1D to survive longer. More studies are needed on the genomic and other “omics” aspects of this unique survivor cohort as this could throw more light on reasons for better survival of some individuals with T1D.
The strength of the study is that it is the first report from India and South Asia, on long-term survival of individuals with T1D. There are no such studies to our knowledge from developing countries such as India. This study shows that 18 individuals with T1D survived >50 years with diabetes. These results are particularly relevant as India has the highest number of children with T1D in the world, according to the 9th edition of the IDF Diabetes Atlas. 14 The inclusion of a control group of “non-survivors” and availability of data from different diabetes practices across the country add value to the study.
In India, most people pay “out of pocket” for insulin and other supplies. In many T1D in south-east Asia, their socioeconomic status does not permit them to have the optimum insulin therapy and/or related blood glucose monitoring. 44 In the year of the centenary of insulin discovery, all efforts must be made for equitable distribution of insulin and supplies to everyone with T1D through governmental policy and the efforts of nongovernmental and civil society organizations.
One of the limitations of the study is its retrospective nature, which could have led to gaps in data collection and missing data. Since we have collected whatever data was available from the participating centers through a questionnaire, standardization of assessment for complications could not be ascertained from other centers (in the 17 T1D survivors). However, all the six centers are well recognized diabetes clinics, which follow standardized protocols. As this is a primary data obtained from the outpatient diabetes clinics, there could be some bias with respect to the nature of survivors attending these clinics. However, it is unlikely that this would have significantly affected the results and conclusions drawn. Future studies using registry data as is being collected by the Indian Council of Medical Research (ICMR) young diabetes registry could provide valuable data. 45
In summary, we present the first report of long-term survivors with T1D from India and compare their clinical and biochemical characteristics in a group of nonsurvivors. Our results show that with reasonable control of glucose, blood pressure and lipids, long-term survival of T1D, with low risk of chronic complications is possible, even in developing countries with limited resources. More studies are needed to elucidate the apparent “resistance to complications” noted in a significant proportion of individuals with long-term T1D.
Footnotes
Authors' Contributions
V.M. conceived the study and was involved in execution of the work, wrote large parts of the article and revised all drafts of the article. C.S.S.R. wrote the first and subsequent drafts of the article and was involved in the data collection and execution of the work. R.U. provided writing support and ideas to improve the article. R.M.A. provided scientific inputs and revised the drafts of the article. A.A., P. K. G., P. R, S.D., C.K., and N.G.S. gave valuable comments and suggestions for writing the article. B.S., S.M., S.C., D.P., S.P., and S.G. provided data, S.J.R. helped to collect data. G.U. did all the statistical analysis of the data and U.V. provided statistical inputs wherever necessary. V.M. and C.S.S.R. are the guarantors of this work and, as such, had full access to all the data in the study and take responsibility for the integrity of the data and the accuracy of the data analysis. All authors read the final draft of the article and contributed to it.
Acknowledgments
The authors thank the staff of Dr. Mohan's Diabetes Specialities Centre, Chennai and the clinical epidemiology team of the Madras Diabetes Research Foundation for their help. We thank Mr. Harsh Kohli of New Delhi who helped us connected to some survivors with T1D. We thank all the participants who took part in the study.
Author Disclosure Statement
No competing financial interests exist.
Funding Information
No funding was received for this article.
Supplementary Material
Supplementary Table S1
References
Supplementary Material
Please find the following supplemental material available below.
For Open Access articles published under a Creative Commons License, all supplemental material carries the same license as the article it is associated with.
For non-Open Access articles published, all supplemental material carries a non-exclusive license, and permission requests for re-use of supplemental material or any part of supplemental material shall be sent directly to the copyright owner as specified in the copyright notice associated with the article.