
Abstract
Objective:
To evaluate the effect of hybrid-closed loop Control-IQ technology (Control-IQ) in randomized controlled trials (RCTs) in subgroups based on baseline characteristics such as race/ethnicity, socioeconomic status (SES), prestudy insulin delivery modality (pump or multiple daily injections), and baseline glycemic control.
Methods:
Data were pooled and analyzed from 3 RCTs comparing Control-IQ to a Control group using continuous glucose monitoring in 369 participants with type 1 diabetes (T1D) from age 2 to 72 years old.
Results:
Time in range 70–180 mg/dL (TIR) in the Control-IQ group (n = 256) increased from 57% ± 17% at baseline to 70% ± 11% during follow-up, and in the Control group (n = 113) was 56% ± 15% and 57% ± 14%, respectively (adjusted treatment group difference = 11.5%, 95% confidence interval +9.7% to +13.2%, P < 0.001), an increase of 2.8 h/day on average. Significant reductions in mean glucose, hyperglycemia metrics, hypoglycemic metrics, and HbA1c were also observed. A statistically similar beneficial treatment effect on time in range 70–180 mg/dL was observed across the full age range irrespective of race-ethnicity, household income, prestudy continuous glucose monitor use, or prestudy insulin delivery method. Participants with the highest baseline HbA1c levels showed the greatest improvements in TIR and HbA1c.
Conclusion:
This pooled analysis of Control-IQ RCTs demonstrates the beneficial effect of Control-IQ in T1D across a broad spectrum of participant characteristics, including racial-ethnic minority, lower SES, lack of prestudy insulin pump experience, and high HbA1c levels. The greatest benefit was observed in participants with the worst baseline glycemic control in whom the auto-bolus feature of the Control-IQ algorithm appears to have substantial impact. Since no subgroups were identified that did not benefit from Control-IQ, hybrid-closed loop technology should be strongly considered for all youth and adults with T1D.
Clinical Trials Registry:
Introduction
Three hybrid closed-loop (HCL) systems are currently commercially available in the United States for individuals with type 1 diabetes (T1D). The Medtronic 670 G system and the Insulet Omnipod 5 system received approval from the Food and Drug Administration based on the results of single-arm trials. 1 –6 The Tandem t:slim X2 insulin pump with Control-IQ technology (Control-IQ) is the only HCL system that received approval based on results of randomized controlled trials (RCTs): one trial in 14- to 72-year olds (DCLP3) 7 and one trial in 6- to 13-year olds (DCLP5). 8 A third trial has been completed in 2- to 5-year olds (PEDAP). 9
These three Control-IQ trials, all published in the New England Journal of Medicine, 7 –9 demonstrated a consistent benefit of Control-IQ on increasing time in the target range of 70–180 mg/dL (TIR), as measured with continuous glucose monitoring (CGM), by 2.6 to 3 h/day compared with a control group. Since the same HCL system was used in these three trials (other than minor changes for PEDAP to lower the total daily insulin requirement and body weight requirements), the Control group in each trial used real-time CGM, and the trials were conducted in largely the same clinical centers, it is appropriate to combine the datasets from the three trials, for a pooled analysis of a cohort ranging in age from 2 to 72 years old.
This combined dataset provides greater precision than present in each trial singularly to evaluate the Control-IQ treatment effect in subgroups based on baseline characteristics such as race/ethnicity, socioeconomic status (SES), prestudy insulin delivery modality (pump or multiple daily injections [MDI]), and baseline glycemic control. Herein, we report the results.
Methods
Details of the three study protocols have been reported elsewhere and the protocols are available on-line accompanying the published articles. The protocols were approved by a central Institutional Review Board and written informed consent (or parental consent for participants <18 years and assent for youth 7–17 years old) was obtained from all participants. The same data and safety monitoring board organized by the National Institutes of Diabetes and Digestive and Kidney Diseases provided oversight for each trial.
The DCLP3 trial randomized 168 adolescents and adults 14 to 72 years old at seven sites, the DCLP5 trial randomized 101 children 6 to <14 years old at four sites, and the PEDAP trial randomized 102 children 2 to <6 years old at three of these four sites (see site listing in the Acknowledgments section). Supplementary Table S1 summarizes the key characteristics of each trial. In all three trials, participants had a clinical diagnosis of T1D and no restriction on HbA1c level. A run-in phase preceded randomization in all three trials. In DCLP3 and DCLP5, pump naive or study CGM naive participants were trained and used the study pump and CGM for 2 to 8 weeks whereas in PEDAP, real-time study CGM was initiated in CGM naive participants for 2 to 6 weeks but MDI users did not initiate pump use before the RCT.
Participants were randomly assigned (2:1 or 3:1) to the Control-IQ group or the Control group. The Control group in all three trials used a real-time Dexcom G6 CGM throughout the trial. Insulin delivery in the Control group was with an insulin pump without automation in DCLP3, an insulin pump which could have a predictive low-glucose suspend (PLGS) or low-glucose suspend (LGS) feature in DCLP5, and either MDI or a pump with or without PLGS or LGS in PEDAP. The primary outcome in each trial was TIR assessed over the duration of the trial, which was 26 weeks in DCLP3, 16 weeks in DCLP5, and 13 weeks in PEDAP. At baseline and at the end of each trial HbA1c was measured by a central laboratory at the University of Minnesota Advanced Research and Diagnostic Laboratory.
Statistical methods
The combined cohort included 371 participants. Two participants assigned to the Control-IQ group in the PEDAP trial did not initiate use of Control-IQ and were not included in the analyses.
Baseline CGM metrics were calculated for each participant using 2 weeks of data before randomization. Follow-up CGM metrics were calculated by pooling all data collected between randomization and the primary outcome visit defined above for each trial. CGM metrics were calculated over 24 h and for the daytime (6am to <12am) and nighttime (12am to <6am) periods.
CGM metrics and HbA1c were compared between the Control-IQ and Control groups using repeated measures regression models. In each model, baseline and follow-up values of the outcome were included as the dependent variable and an unstructured covariance matrix was used to estimate the correlation between periods (baseline and follow-up). The model included fixed effects for period and the treatment effect at follow-up. To account for the fact that the data were pooled from three studies, the fixed effect for period and the covariance matrix were estimated separately by study. This approach is a “one-stage” meta-analysis. Confidence intervals (CIs) for the binary outcomes were calculated using parametric bootstrap. Modification of the treatment effect by baseline variables was assessed by adding an interaction term to the models.
The following insulin pump metrics were calculated for participants in the Control-IQ group based on all available pump data collected between randomization and the primary outcome visit for each trial: average number of auto-boluses per day, average number of user-initiated boluses per day (with and without carbohydrate announcement), and the percentage of total daily boluses that were automated. The association between each metric and baseline characteristics was assessed using univariate and multivariate linear regression models. In addition, the total daily insulin dose and the amount of insulin received in automated and user-initiated boluses were computed for each subgroup.
Two-sided P-values and 95% CIs were adjusted to control the false-discovery rate using the Benjamini-Hochberg procedure adapted using the two-stage test. 10 Analyses were performed with SAS software, version 9.4 (SAS Institute).
Results
The combined cohort for analysis included 369 participants, with 256 assigned to the Control-IQ group and 113 to the Control group. Age ranged from 2 to 72 years. Twenty-two percent were from a racial or ethnic minoritized group. Before the study, MDI was used for insulin delivery by 24% and an insulin pump by 76%. Baseline HbA1c ranged from 5.2% to 11.5% and baseline TIR ranged from 3% to 94% (Table 1). The trials were completed by 368 (99.7%) of the 369 participants.
Participant Characteristics at Baseline
CGM, continuous glucose monitoring; MDI, multiple daily injections; SD, standard deviation; T1D, type 1 diabetes.
In the Control-IQ group, the median percentage of time the system was in closed-loop mode was 93% (90%–95%) and CGM data for analysis were available for a median of 97% (95%–98%) of the time during the trial.
In the Control group, an insulin pump was used by 103 (91%) of the 113 participants (26 with PLGS feature) and MDI by 10 (9%), all in the 2 to <6 years old age group. CGM data were available for a median of 96% (91%–98%) of the trial time.
TIR and other CGM outcome measures reflecting hyperglycemia
TIR in the Control-IQ group was 57% ± 17% at baseline and increased to 70% ± 11% during follow-up, and in the Control group was 56% ± 15% and 57% ± 14%, respectively (Table 2). The adjusted treatment group difference was +11.5% (95% CI 9.7% to 13.2%, P < 0.001), representing 2.8 h/day greater TIR in the Control-IQ group than the Control group. Substantial reductions in mean glucose and CGM hyperglycemia metrics were seen with Control-IQ compared with the Control group.
Glycemic Outcomes Overall and by Time of Day
Data are mean ± SD, median (IQR), or n (%).
Baseline CGM metrics were calculated using 2 weeks of data before randomization and follow-up CGM metrics were calculated using all data collected between randomization and the primary outcome visit (26 weeks for DCLP3, 16 weeks for DCLP5, and 13 weeks for PEDAP). At least 168 h of data were required to calculate CGM metrics over 24 h. At least 126 and 42 h of data were required to calculate CGM metrics for daytime and nighttime, respectively.
Confidence intervals and P-values for the treatment group difference at follow-up were calculated from a repeated measures regression model with baseline and follow-up as the dependent variable. An unstructured covariance matrix was used to estimate the correlation between baseline and follow-up. The fixed effect for period and the covariance matrix were estimated separately by study. P-values and confidence intervals have been adjusted to control the false discovery rate.
A CGM-measured hyperglycemic event is defined as ≥90 cumulative minutes with a CGM sensor value >300 mg/dL within a 120 min period. The event ends when there is ≥15 consecutive minutes with a CGM sensor value ≤180 mg/dL, at which point the participant becomes eligible for another hyperglycemic event.
A CGM-measured hypoglycemic event is defined as ≥15 consecutive minutes with a CGM sensor value <54 mg/dL. The event ends when there is ≥15 consecutive minutes with a CGM sensor value ≥70 mg/dL, at which point the participant becomes eligible for another hypoglycemic event.
IQR, interquartile range.
These benefits of Control-IQ were observed during both daytime (6am–11:59pm) and nighttime (12am–5:59am), although as expected improvement in TIR was greater overnight than during the day (Table 2). For participants 2 to <6 years old, overnight results were comparable for the period of 8pm–6:59am (Supplementary Table S2). As seen in Figure 1, mean glucose was lower with Control-IQ than control throughout the 24 h of the day, with the greatest difference being between 4am and 8am.
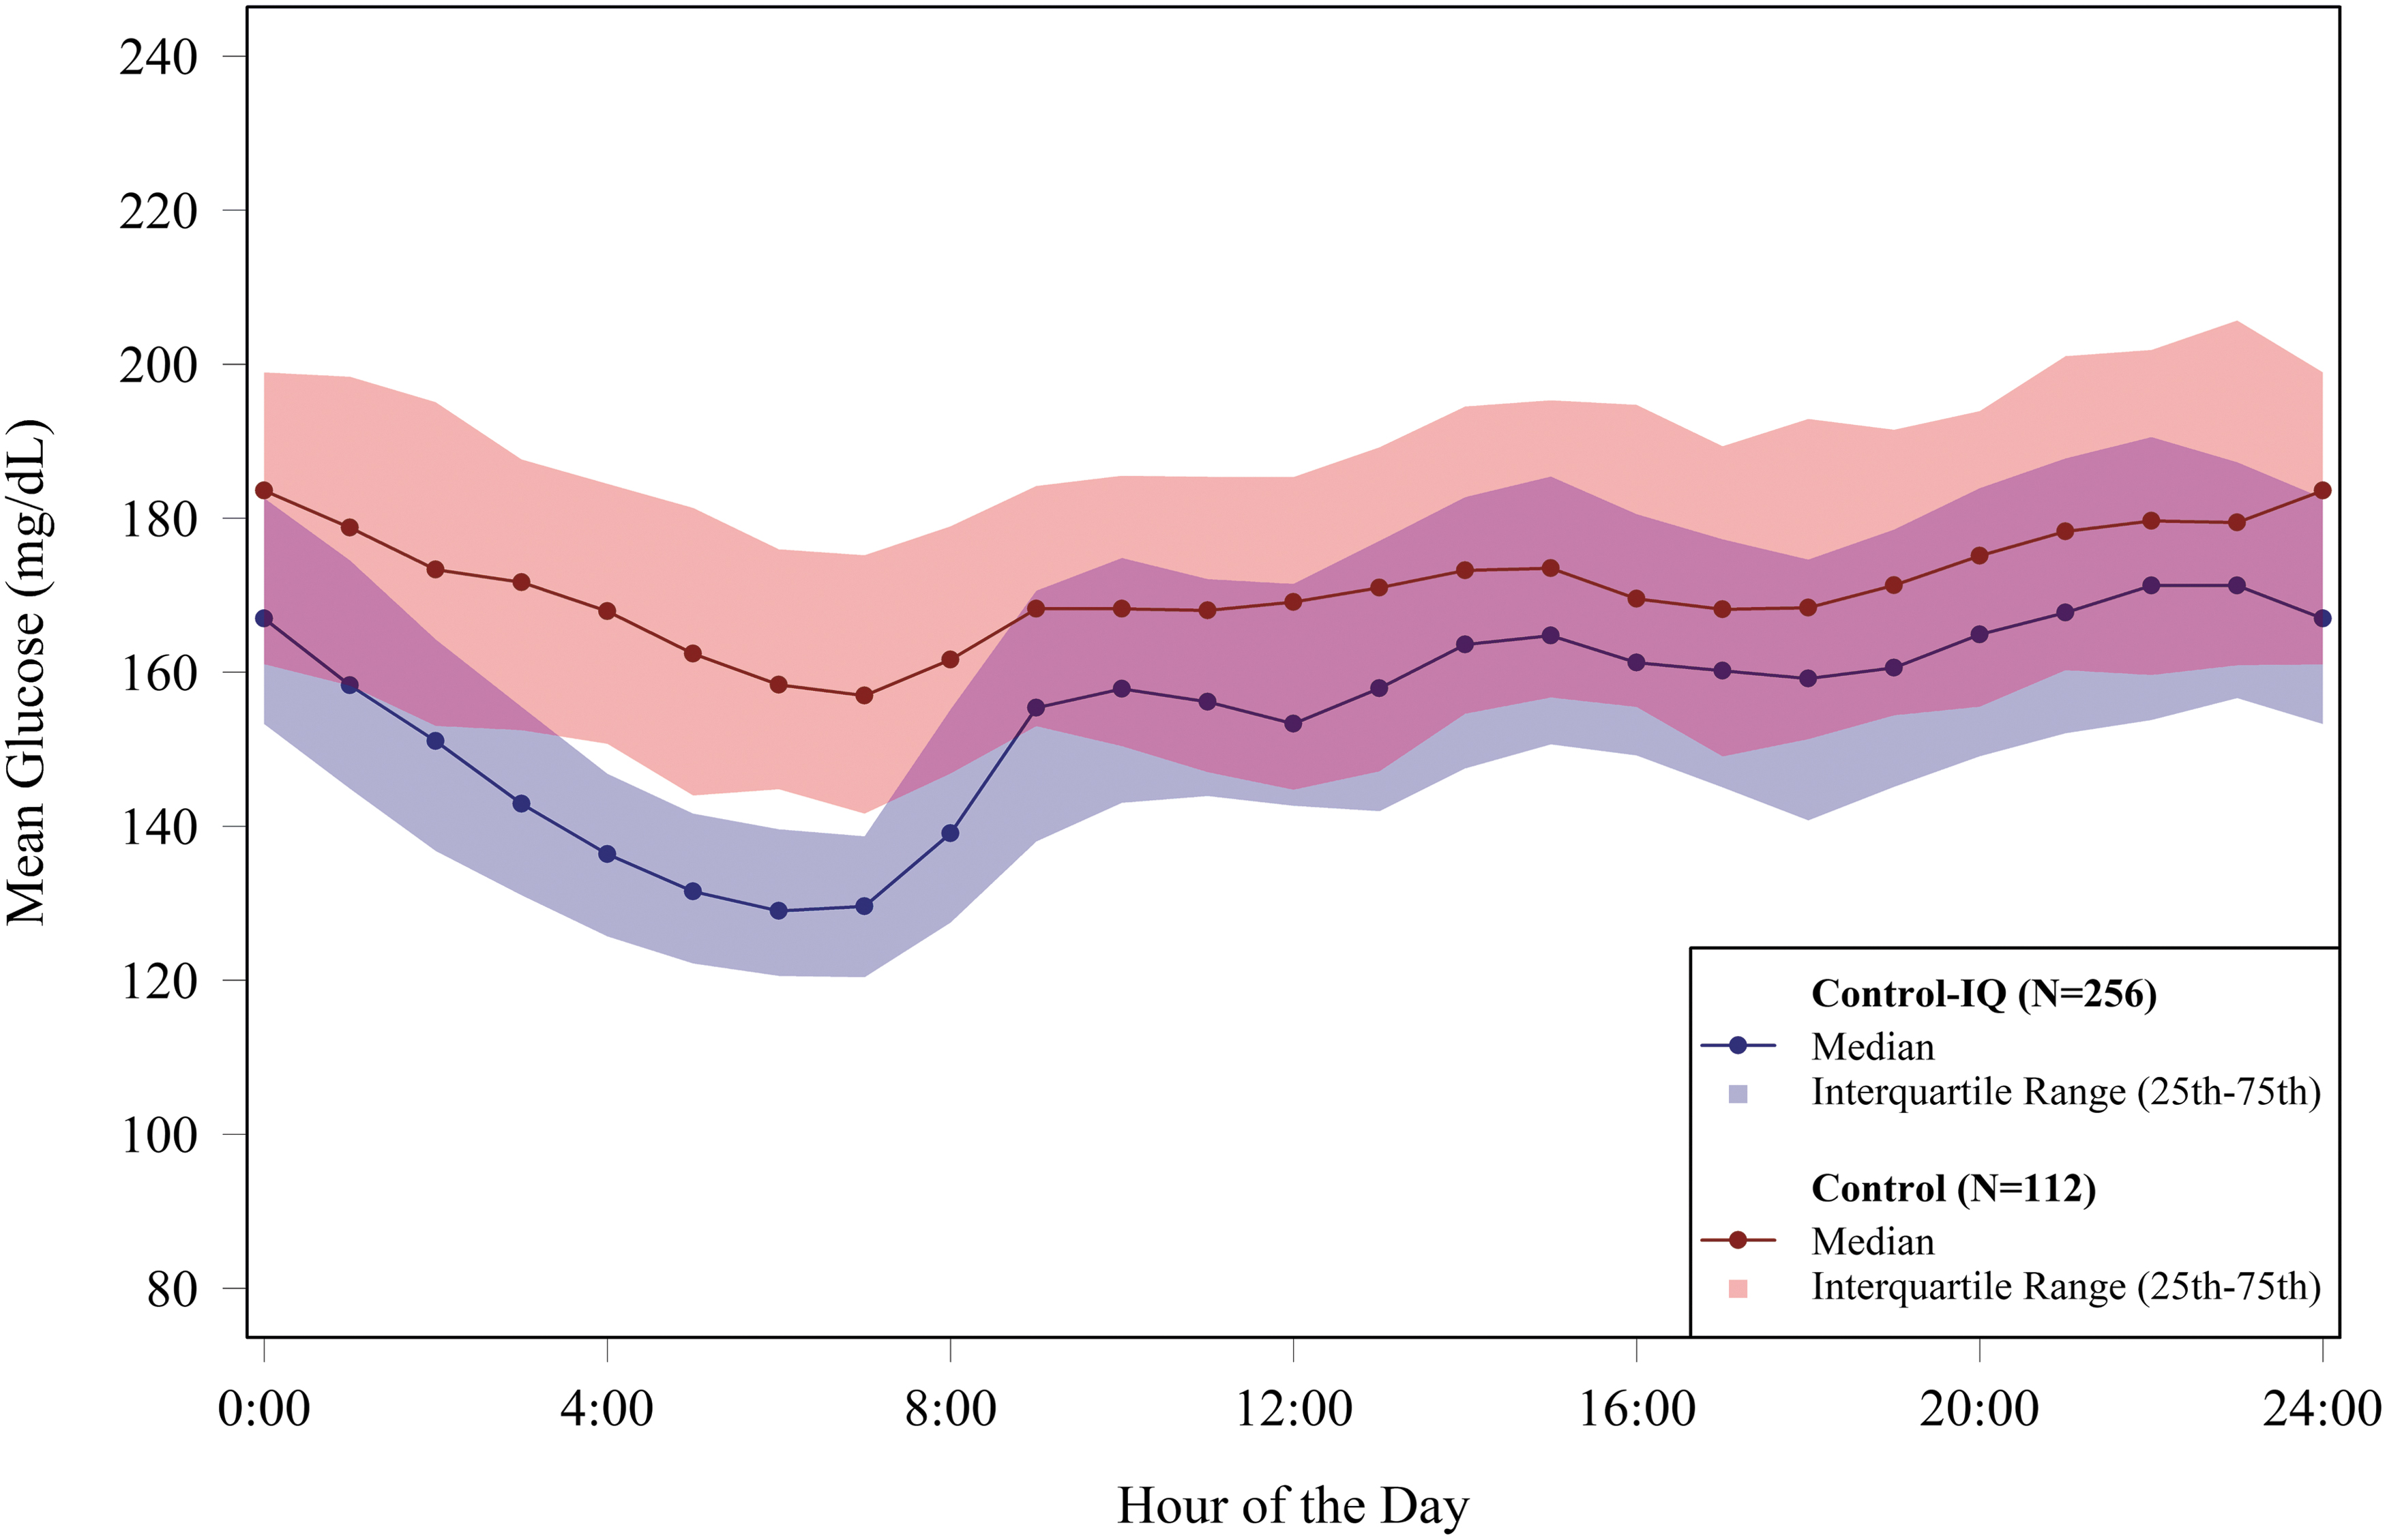
Mean glucose levels by time of day during follow up. The figure shows an envelope plot of the glucose level as measured by CGM over follow-up, according to the time of day. Solid circles denote the hourly median values and the shaded regions are defined by the 25th and 75th percentiles, with the Control-IQ group represented by blue symbols and blue shading and the Control group represented by red symbols and red shading. CGM, continuous glucose monitoring.
A statistically similar beneficial treatment effect on TIR was observed across the full age range, for both White non-Hispanic participants and participants representing a racial or ethnic minoritized group, for both higher and lower household income, for both prestudy CGM users and not users, and for both prestudy pump and MDI users (Fig. 2, P-values for interaction between the characteristic and treatment group on TIR outcome not significant). While a beneficial effect on TIR was observed irrespective of the level of baseline glycemic control, a statistically significant interaction (P < 0.001) was seen with the greatest benefit being observed in participants with the worst baseline control (higher HbA1c and lower TIR).

Time in range 70–180 mg/dL outcome: Forest plot of treatment effect in subgroups based on baseline characteristics. The treatment effect on time in range 70–180 mg/dL is shown numerically and depicted in the figure where the dot represents the point estimate for the treatment group difference and the lines represent the extent of the 95% confidence interval. The vertical dotted line represents a treatment group difference of zero. Point estimates to the right of the vertical line indicate a higher time in range in the Control-IQ group compared with the Control group. It can be seen that time in range was higher in the Control-IQ group than the Control group in all subgroups. The interaction P-value is indicative of whether this beneficial treatment effect in all subgroups varied according to the baseline characteristic.
From a longitudinal perspective, the improvement in TIR in the Control-IQ group occurred during the first week of Control-IQ use and was sustained over the 13 weeks of follow-up common to all three protocols. In fact, the improvement was observed after only 1 day of Control-IQ use. These findings were consistent across participant age, race/ethnicity, annual household income, prestudy insulin delivery method (MDI or pump), and baseline HbA1c (Fig. 3).

Mean time in range 70–180 mg/dL by day and by week in the Control-IQ group according to baseline characteristics. For each baseline characteristic, mean time in range 70–180 mg/dL is shown by week of Control-IQ use on the left and by day for the first week of Control-IQ use on the right.
Effect on hypoglycemia outcomes
The amount of hypoglycemia was low at baseline, but nevertheless, reduction in time <70 mg/dL and time <54 mg/dL were observed with Control-IQ compared with the Control group (Table 2). The adjusted treatment group difference was −0.7% (95% CI −0.9% to −0.4%, P < 0.001) for time <70 mg/dL and −0.10% (95% CI −0.18% to −0.03%, P = 0.006) for time <54 mg/dL. The beneficial effect of Control-IQ on hypoglycemia was present during both daytime and nighttime (Table 2).
As can be seen in Figure 4, the point estimates comparing the treatment groups for time <70 mg/dL favored Control-IQ in all subgroups based on participant age, race/ethnicity, annual household income, prestudy CGM users and not users, prestudy insulin delivery method (MDI or pump), baseline HbA1c, baseline TIR, and baseline time <70 mg/dL, for which the greatest treatment effect was observed for participants with baseline time <70 mg/dL that was ≥4.0%. While a beneficial effect was evident for children, adolescents, young adults, and older adults, it appeared greater for adults (P-value for interaction = 0.05). The effect also appeared to be greater for participants who had baseline HbA1c <7.0% (P-value for interaction = 0.005).

Time <70 mg/dL outcome: Forest plot of treatment effect in subgroups based on baseline characteristics. The treatment effect on time <70 mg/dL is shown numerically and depicted in the figure where the dot represents the point estimate for the treatment group difference and the lines represent the extent of the 95% confidence interval. The vertical dotted line represents a treatment group difference of zero. Point estimates to the left of the vertical line indicate a lower time <70 mg/dL the Control-IQ group compared with the Control group. It can be seen that time <70 mg/dL was lower in the Control-IQ group than the Control group in all subgroups. The interaction P-value is indicative of whether this beneficial treatment effect in all subgroups varied according to the baseline characteristic.
A severe hypoglycemia event occurred in 2 (1%) participants in the Control-IQ group and 1 (1%) participant in the Control group (incidence rate 2.1 events per 100 person-years vs. 2.3 events per 100 person-years).
Effect on HbA1c
HbA1c in the Control-IQ group was 7.5% ± 1.0% at baseline and decreased to 7.0% ± 0.8% at the end of the RCT, and in the Control group was 7.6% ± 0.9% and 7.5% ± 0.9%, respectively (Table 2). The adjusted treatment group difference was −0.38% (95% CI −0.51% to −0.26%, P < 0.001).
A statistically similar beneficial treatment effect on HbA1c was observed across the full age range, for both White non-Hispanic participants and participants representing a racial or ethnic minoritized group, prestudy CGM users and not users, and both prestudy pump and MDI users (Fig. 5). A treatment benefit was present for both higher and lower annual family income, but there was a suggestion of a greater treatment effect in participants with annual family income < $75,000 compared with ≥ $75,000 (P-value for interaction 0.05). Participants with baseline HbA1c <7.0% or baseline TIR ≥70% did not show improvement in HbA1c with Control-IQ compared with control, whereas there was a gradation of greater improvement in HbA1c, the higher the baseline HbA1c or lower the TIR (P-value for interaction <0.001).

HbA1c outcome: Forest plot of treatment effect in subgroups based on baseline characteristics. The treatment effect on HbA1c is shown numerically and depicted in the figure where the dot represents the point estimate for the treatment group difference and the lines represent the extent of the 95% confidence interval. The vertical dotted line represents a treatment group difference of zero. Point estimates to the left of the vertical line indicate a lower HbA1c in the Control-IQ group compared with the Control group. It can be seen that HbA1c was lower in the Control-IQ group than the Control group in all subgroups, except for baseline HbA1c <7.0% and TIR ≥ 70%, where there was no apparent difference. The interaction P-value is indicative of whether this beneficial treatment effect in all subgroups varied according to the baseline characteristic.
Manual and auto boluses according to baseline characteristics
The number of user-initiated boluses using Control-IQ averaged 6.6 ± 2.4 per day and varied according to age, prestudy insulin delivery, and baseline HbA1c; being lower in the age group 14 to 24 years, in MDI users, and in those with elevated HbA1c (Table 3 and Supplementary Table S3). The number of auto-boluses averaged 4.1 ± 1.8 per day and varied substantially with baseline HbA1c, ranging from 2.8 ± 1.2 in participants with baseline HbA1c <7.0% to 5.5 ± 1.8 in those with baseline HbA1c ≥8.5%, with the percentage of total daily boluses that were automated varying from 26% ± 12% to 52% ± 13%, respectively.
Number of Boluses per Day During Follow-Up in the Control-IQ Group According to Baseline Characteristics
Unadjusted P-values were calculated from separate univariate linear regression models for each baseline characteristic. Adjusted P-values were calculated from a multivariate linear regression model with all baseline characteristics included as covariates. Since the relationship between age and the number of boluses appeared non-linear, age was considered a categorical covariate in these models. Baseline HbA1c was considered continuous. P-values and confidence intervals have been adjusted to control the false discovery rate.
Results for lower baseline TIR paralleled the results for higher baseline HbA1c. The mean percent of automated bolus insulin received was 16% ± 11% and showed a similar variation with baseline HbA1c, ranging from 9% ± 5% in participants with baseline HbA1c <7% to 24% ± 14% in participants with baseline HbA1c ≥8.5% (Supplementary Table S4). The ratio of carbohydrate per one unit of insulin varied by age being highest in participants <6 years old and lowest in those 14 to <25 years old. In all subgroups, there was little change in the ratio from the time of initiation of Control-IQ to the completion of the trial (Supplementary Table S5).
Discussion
This analysis combining datasets from three RCTs found a reduction in both hyperglycemia and hypoglycemia in 2- to 72-year olds with T1D using Control-IQ across a broad range of participant characteristics, resulting in an increase in TIR of 2.8 h/day on average and a reduction in HbA1c. The comparator was a control group, in which all participants used CGM and 91% used an insulin pump, some with PLGS. A consistent beneficial treatment effect was observed across the full age range, in racial and ethnicity groups, across the spectrum of SES, and in both pump and MDI users.
The treatment effect was robust in racial-ethnic minoritized groups and in those with lower SES as well as in prestudy MDI users. It also was robust in participants with markedly elevated HbA1c levels before the study. In fact, those with the highest HbA1c levels had the greatest reduction in HbA1c and increase in TIR when using Control-IQ.
Improvement in TIR occurred during the first day of Control-IQ use, and mean TIR reached its peak quickly and remained stable through 3 months. This rapid improvement in 1 day was remarkable and was observed in all subgroups, even in those who were MDI users before the study.
The amount of time below range (i.e., hypoglycemia) present at baseline was low. Nevertheless, a significant reduction in time <70 mg/dL and time <54 mg/dL was observed, a finding that was consistent across participant characteristics. The rate of severe hypoglycemia events was exceedingly low (∼2 per 100 person-years) and similar with Control-IQ and control. The substantially higher percentage of Control-IQ users compared with controls meeting the consensus targets 11 of time 70–180 mg/dL >70% and time <70 mg/dL <4% (45% vs. 13%) is particularly noteworthy, especially for overnight (73% vs. 19%).
Studies analyzing Control-IQ data obtained through real-world use have reported glycemic improvements similar to the improvements in these RCTs. Breton and Kovatchev 12 analyzed data from 9451 Control-IQ users 6 to 91 years old with diabetes (∼95% T1D), reporting that TIR increased from 64% at baseline to 74% using Control-IQ over 12 months in those with at least 75% CGM usage after switching from a PLGS pump (Basal-IQ technology) to Control-IQ. Time in hypoglycemia was low at baseline using Basal-IQ and remained similarly low with Control-IQ. Time in automation was 94%. Kovatchev et al 13 analyzed 3 months of real-life Control-IQ data for 19,454 individuals with T1D ranging in age from 1 to 92 years that was preceded by 1 month of use of PLGS (Basal-IQ technology).
Compared with PLGS, TIR improved from 58.4% to 70.5% with Control-IQ. The mean glucose management indicator 14 decreased from 7.5% to 7.1%, and time <70 mg/dL decreased from 1.7% to 1.5%. Improvement was observed within the first day of Control-IQ use, similar to our finding in the pooled RCTs, and was present across the age range and the range of baseline glycemic control. A small clinic-based study reported similar improvement in TIR. 15
Among Control-IQ users, fewer user-initiated boluses (meal and correction) were associated with age 14 to 24 years, prestudy MDI use, and high baseline HbA1c. For participants aged 14 to 24 years and those with baseline HbA1c ≥8.0%, on average 50% or more of the total number of daily boluses were automated. These findings are consistent with the real-world data reported by Kovatchev et al. 13 Despite performing fewer user-initiated boluses, participants with high baseline HbA1c levels showed the largest improvement in HbA1c compared with the Control group; in participants with baseline HbA1c ≥8.5%, the treatment group difference in outcome HbA1c was −0.88%. This suggests that auto-bolusing as a feature in Control-IQ's algorithm has considerable impact on improving HbA1c levels in those with high HbA1c before initiating Control-IQ in whom high HbA1c levels likely reflect missed meal boluses and lack of correction boluses. 16,17
Strengths of this analysis include the large sample size of Control-IQ users in an RCT, which included a comparator group using real-time CGM on a daily basis. The three protocols were all quite similar with respect to data collection and study procedures and all were coordinated and monitored by the same organization. Importantly, all three used the same CGM sensor, which made the pooling of CGM data across protocols possible.
Although the time point of the primary outcome differed among the studies, an impact on the results would not be expected since each study had a concurrent randomized control group, the statistical models accounted for the fact that the data were pooled from three studies, and the benefit of Control-IQ on glycemic control has been shown to occur quickly without a drop off with increasing duration of use. A limitation of the meta-analysis on the generalizability of the results is that the cohort had less socioeconomic and race-ethnicity diversity than the general population of adults and youth with T1D although the data indicate that participants of lower SES or minority race-ethnicity had just as much glycemic improvement as those with higher SES or non-Hispanic White race-ethnicity.
In summary, this pooled analysis of Control-IQ RCTs demonstrates the beneficial effect of Control-IQ in T1D begins immediately across a broad spectrum of participant characteristics, including racial-ethnic minoritized group, lower SES, lack of prestudy insulin pump experience, and high HbA1c levels. No subgroups were identified that did not benefit from Control-IQ. The greatest benefit was observed in participants with the worst baseline glycemic control in whom the auto-bolus feature of the Control-IQ algorithm appears to have substantial impact. Real-world data are strongly supportive of the RCT findings. Therefore, HCL technology should be strongly considered for all youth and adults with T1D.
Footnotes
Acknowledgments
The following diabetes centers participated in the trials
| DCLP3 | DCLP5 | PEDAP | |
|---|---|---|---|
| Barbara Davis Center for Diabetes, University of Colorado | X | X | X |
| Stanford University | X | X | X |
| University of Virginia | X | X | X |
| Icahn School of Medicine at Mount Sinai | X | ||
| Joslin Diabetes Center | X | ||
| Mayo Clinic, Rochester | X | ||
| Sansum Diabetes Research Institute | X | ||
| Yale University | X |
Authors' Contributions
R.W.B. and L.G.K. wrote/edited the article. L.G.K. performed statistical analysis. M.D.B., S.A.B., R.P.W., B.A.B., C.K., and B.K. reviewed, edited, and contributed to discussion.
Author Disclosure Statement
Roy W. Beck reports no personal financial disclosures but reports that his institution has received funding on his behalf as follows: grant funding and study supplies from Tandem Diabetes Care, Beta Bionics, and Dexcom; grant funding from Bigfoot Biomedical; study supplies from Medtronic, Ascencia, and Roche; consulting fees and study supplies from Eli Lilly and Novo Nordisk; and consulting fees from Insulet, Zucara, Hagar, and Vertex. Lauren G. Kanapka reports no personal financial disclosures. MDB reports speaker activities for Arecor, and Tandem Diabetes Care. Marc D. Breton reports consultant activities for Dexcom and Roche. Marc D. Breton further reports inventorship of intellectual property in the field of diabetes technologies owned and managed by his employer, the University of Virginia, with active, royalty bearing licenses.
Finally, Marc D. Breton reports that the Center for Diabetes Technology at UVA has received grant funding and material support for research from Arecor, Dexcom, Tandem, Novo Nordisk, and Insulet. Sue A. Brown reports no personal financial disclosures and reports receiving grant and study supply support to the University of Virginia from Dexcom, Insulet, Roche, Tandem Diabetes Care and Tolerion, R. Paul Wadwa reports speaker activities for Dexcom and advisory board for Eli Lilly & Co., conference travel support from Dexcom and Eli Lilly & Co. and grant and study supply support from Dexcom, Elil Lilly & Co. and Tandem Diabetes Care. Bruce A. Buckingham has received institutional research support from Tandem Diabetes Care, Insulet, Medtronic, and Bionic Pancreas, and has been on advisory boards for Medtronic, Novo Nordisk, and Lilly. Craig Kollman reports no personal financial disclosures.
Boris Kovatchev reports receiving grant support, paid to the University of Virginia, from Dexcom and Novo Nordisk, study materials provided to the University of Virginia, from Dexcom and Tandem Diabetes Care, and holding patents on optimization of glycemic control and design of closed-loop algorithms, licensed to Dexcom, Johnson & Johnson, Novo Nordisk, and Sanofi, for which royalties are received through the University of Virginia.
Funding Information
Tandem Diabetes Care provided funding to support the conduct of the article's statistical analyses. NIH/NIDDK grants UC4 108483 and U01DK127551 provided the funding to conduct the trials.
Supplementary Material
Supplementary Table S1
Supplementary Table S2
Supplementary Table S3
Supplementary Table S4
Supplementary Table S5
References
Supplementary Material
Please find the following supplemental material available below.
For Open Access articles published under a Creative Commons License, all supplemental material carries the same license as the article it is associated with.
For non-Open Access articles published, all supplemental material carries a non-exclusive license, and permission requests for re-use of supplemental material or any part of supplemental material shall be sent directly to the copyright owner as specified in the copyright notice associated with the article.