




Abstract
Background:
Randomized trials of continuous glucose monitoring (CGM) often estimate treatment effects using standard intent-to-treat (ITT) analyses. We explored how adjusting for CGM-measured wear time could complement existing analyses by estimating the effect of receiving and using CGM 100% of the time.
Methods:
We analyzed data from two 6-month CGM trials spanning diverse ages, the Wireless Innovation for Seniors with Diabetes Mellitus (WISDM) and CGM Intervention in Teens and Young Adults with Type 1 Diabetes (CITY) Studies. To adjust the ITT estimates for CGM use, as measured by wear time, we used an instrumental variable (IV) approach with the treatment assignment as an instrument. Outcomes included (1) time in range ([TIR] 70–180 mg/dL), time below range ([TBR] ≤70 mg/dL), and time above range ([TAR] ≥250 mg/dL). We estimated outcomes based on CGM use in the last 28 days of the trial and the full trial.
Findings:
In the WISDM study, the wear time rates over the 28-day window and full trial period were 93.1% (standard deviation [SD]: 20.4) and 94.5% (SD: 11.9), respectively. In the CITY study, the wear time rates over the 28-day window and full trial period were 82.2% (SD: 26.5) and 83.1% (SD: 21.5), respectively. IV-based estimates for the effect of CGM on TIR, TBR, and TAR suggested greater improvements in glycemic management than the ITT counterparts. The magnitude of the differences was proportional to the level of wear time observed in the trials.
Interpretation:
In trials of CGM use, the effect of variable wear time is non-negligible. By providing adherence-adjusted estimates, the IV approach may have additional utility for individual clinical decision-making.
Introduction
Continuous glucose monitoring (CGM) systems are now a standard component of type 1 diabetes care and management. 1 CGM provides useful information for real-time decision-making relevant to type 1 diabetes management, as well as summary statistics for both patients and professionals. Randomized clinical trials (RCTs) have shown that CGM use can improve hemoglobin A1c (HbA1c), reduce the frequency of hypoglycemia, and increase the amount of time individuals spend with their glucose levels in healthy range. 1
To date, RCTs of CGM have estimated intent-to-treat (ITT) effects of CGM use. ITT analyses categorize the data of participants based on their randomization assignment, regardless of the extent to which the intervention was received. 2 The ITT approach provides insight as to the effect of being assigned to an intervention, rather than the effect of receiving the intervention. This helps preserve randomization and prevent confounding of results by postrandomization factors, such as adherence, that may not be balanced between study arms. ITT is useful to estimate the average effect of offering an intervention to a clinical population, knowing that not everyone will adhere to it perfectly.
However, because they do not account for nonadherence, ITT estimates may not be useful guides for individual-level decision-making, especially for someone who intends to adhere to treatment. Further, in the context of interventions, in which adherence is variable and/or low, presenting only an ITT effect estimate may make it difficult to distinguish between the effect of the intervention versus the role that nonadherence plays in diluting potential intervention benefits. One way to address these issues is with as-treated (AT) analyses, which attempt to account for the issue of nonadherence by analyzing participants according to the treatment received. However, AT analysis introduces a risk of bias from postrandomization imbalance in factors that are correlated with adherence, which undermines the value of randomization. 2 –5
A third alternative is principled per-protocol analyses that seek to estimate the effect of an intervention if all participants had adhered to the study protocol to which they were randomly assigned. One such approach uses instrumental variables (IVs). In the right context, these types of analyses do not require measurement of postrandomization confounding factors and can produce valid estimates of per-protocol effects. IV analyses have been applied extensively in economics and social sciences, 6 –8 and have an established history of being used to account for nonadherence in the context of randomized trials. 2 Using this approach requires identifying an IV, which is one that is correlated with the treatment received but not with the outcome variable (except through the treatment). In the context of an RCT, an IV analysis can provide complementary insights into treatment effects when combined with ITT. 9 –15
Using IV for per-protocol analyses of this type requires a measure of adherence, which for CGM, may be the total wear time, or the percentage of time that an individual had an active sensor in place transmitting glucose readings, over a previous time period. Although objective wear time cannot be interpreted as time that a patient both wears and uses CGM information for diabetes management decisions, it does provide an indicator of the degree to which an individual is “adhering” to technologic glucose monitoring (vs. self-monitoring via finger sticks); CGM therefore represents a unique therapy in that the intervention itself also passively measures adherence, providing a quantitative measure that is objective, continuous, and dynamic.
In this study, our hypothesis was that the benefits of CGM use seen in clinical trials were, to some extent, diluted by nonadherence. Thus, we sought to determine whether an IV analysis of CGM studies would reveal larger benefits to CGM use than ITT analyses. We applied the IV approach to per-protocol analysis to two pivotal CGM trials, spanning participants of diverse ages, 16 and evaluated the results of each.
Materials and Methods
Data sources
As applications of wear time adjustment, we analyzed data from two completed RCTs completed by 2019 with deidentified datasets publicly available through the Jaeb Center for Health Research. 17
Wireless Innovation for Seniors with Diabetes Mellitus study
The Wireless Innovation for Seniors with Diabetes Mellitus (WISDM) study 18 included 203 individuals with type 1 diabetes who were at least 60 years old at recruitment with HbA1c levels of 10% or lower. The objective of the trial was to assess whether CGM usage could reduce hypoglycemia and improve other health-related quality-of-life measures for older adults with type 1 diabetes. The trial was a 6-month group RCT that compared a treatment group using CGM with a control group that comprised usual care without CGM (i.e., self-monitoring of blood glucose [SMBG]), with a 6-month extension study, in which participants assigned to the SMBG arm crossed over to using CGM. 19 To ascertain the same outcomes from both the treatment and control groups, the SMBG group wore blinded CGM sensors during a screening period that produced data that were only available to the research team and not the participants.
CGM Intervention in Teens and Young Adults with Type 1 Diabetes study
The CGM Intervention in Teens and Young Adults with Type 1 Diabetes (CITY) study 20 included 153 participants with type 1 diabetes who were aged 14–24 years. 20 The objective of the trial was to assess the effect of CGM usage on glycemic control in youth and young adults with type 1 diabetes. 20 Similar to the aforementioned WISDM study, participants in the CITY study were randomized to either use CGM or usual care (i.e., SMBG) with manual blood glucose monitoring (without CGM), and participants in the SMBG group in the CITY study wore blinded CGM during screening periods so that the same outcomes could be ascertained both at baseline and follow-up for both the intervention and control group.
Measures
Outcomes
The common designs and data collection protocols for the WISDM and CITY studies allow for analysis of the same outcomes in both datasets. We focus on three primary glycemic outcomes based on their clinical relevance: (1) time in range ([TIR] defined as 70–180 mg/dL), (2) time below range ([TBR] time below 70 mg/dL), and 3) time above range ([TAR] time above 250 mg/dL. The time frame over which these outcomes are calculated is the same as in the originally published studies; more detail regarding the calculation of the outcomes can be found in the original study groups' articles. 18,20
Covariates
We control for sex, race/ethnicity, age of diagnosis, insulin modality (pump vs. manual daily injections), and health insurance status.
Statistical analysis
Estimation methods
We use two different estimation methods, linear mixed-effects models and first-difference estimation, for several reasons. We follow the authors of the WISDM and CITY studies in using linear mixed-effects models for longitudinal analysis, as this approach allows for analyzing nested, nonindependent data. We additionally use first-difference models to enhance robustness, as analyzing the same data using different methodological approaches that have different assumptions provides checks against robustness. In addition, first-difference models may offer more easily understandable demonstration of the wear time adjustment approach than the linear mixed-effects model owing to the lack of random intercept components. We present the linear mixed-effects models as our primary specifications as those were used in the original analyses for both trials and provide the results of the first-difference models in the Supplementary Material.
ITT analyses
Our primary exposure of interest in the ITT analyses is randomization assignment. Like the originally published ITT analyses of the WISDM and CITY studies, we use longitudinal mixed-effects models to analyze the trial data for both studies. 18,20 We include individual-level random effects to account for repeated observations within individuals. There are methodological differences in our approach relative to the originally published ITT estimates for each of the two trials, so we do not expect our estimates to be identical. Specifically, while the original CITY ITT analysis uses direct likelihood 21 for missing data, we do not impute. Similarly, we include a random effect at the individual-level, not site-level, and do not use the rank-based transformations that were used in the original CITY ITT analysis. We use both estimation methods, linear mixed models and first-difference models, 22 for the ITT analyses.
Per-protocol IV estimates
We conduct per-protocol analyses using IV estimation. IVs are an estimation method that have long been popular in the economics and econometrics literature and have been applied in many health-related contexts. 2,11,23 –26 An IV is a variable that influences the primary exposure of interest but does not otherwise affect the outcome. 2 For this study, randomization to a particular treatment group serves as the IV, and it is known to be a valid IV given the study design (i.e., treatment assignment is known not be associated with any prognostic factors given randomization). In this study, we conduct linear IV estimation in two stages. The first stage is a linear regression model that estimates adherence as a function of treatment group assignment.
The second stage is an outcome regression model that regresses the outcome of interest on the predicted value of the exposure from the first-stage model. 7,23 This approach is often referred to as two-stage least squares. We would like to note that in the presence of skewed adherence, the econometrics literature still finds a linear first-stage model estimated via OLS more appropriate than nonlinear models with restricted parameter space for 2-stage IV modeling even in the presence of out-of-range predictions. 27,28 This approach, using IV methods to adjust for nonadherence, goes by several names, including compliance-adjusted intent-to-treat (CA ITT) analysis and complier average causal effects estimation (CACE). 2,29,30
The measure of adherence is unblinded CGM wear time, operationalized as the percentage of days during the study period that have recorded CGM readings. We assess two wear time variables to reflect different durations of time, including the last month of the trial (e.g., 28-day window before the 6-month follow-up visit for participants in the treatment group) and the full trial (e.g., the percentage of days from the start date to the 6-month follow-up date). However, the Dexcom devices used in the trials had a maximum storage capacity of 28–30 days of readings. To be conservative in our estimates of adherence, we only used the 28 days before each of the patient visits, at which the device's data were downloaded. These are the adherence calculations that are reported by the original study groups for the WISDM and CITY trials.
We refer to these as the final-month and full-trial adherence windows, respectively. The rationale for assessing both time frames was to account for the possibility that adherence to CGM is, partially, a function of familiarity and that there is a learning curve with CGM technology that could lead to lower adherence during the learning period and higher adherence once fully familiar with the technology. The final-month measure of adherence reflects the last month of the trial and thus follows a 5-month period of CGM intervention, minimizing the effects of learning and adjusting to CGM.
The measure of adherence is unblinded CGM wear time, the value is equal to zero for individuals in the control group during both the pre- and postintervention periods, as well as the individuals in the treatment group during the preintervention period. In essence, the ITT analyses are estimating the effect of being asked to wear CGM versus not being asked to, while the IV per-protocol analyses estimate the effect of wearing CGM versus not wearing it.
In addition to the aforementioned analyses, we also model these outcomes using artificially lowered adherence rates in the treatment groups of these two trials to demonstrate the relationship between trial protocol adherence and magnitude of difference between ITT and per-protocol estimates. In these models, we lowered observed adherence by 20 percentage points. Results for these models can be found in the Supplementary Material (Fig. S4a and S4b). To formally test whether the differences in our IV estimates are different than the ITT estimates, we used nonparametric bootstrapping with 1000 replications, examining the difference between the ITT estimate and the IV estimate. We used percentile-based inference with a null hypothesis of no difference between the estimates, and a type 1 error rate of α = 0.05.
All analyses were conducted in R (version 4.1.0) 31 using the plm package, 32 which automatically adjusts standard errors to reflect the nature of the two-stage modeling approach. We set our significance level a-priori at P < 0.05. Upon review by the UNC Office of Human Research Ethics, this study (study number 22-2270) was determined to be exempt from further review according to the regulatory category cited under 45 CFR 46.104.
Results
CGM wear time
A summary of the adherence to CGM, as measured by wear time, in both trials over each pre-specified time period can be found in Table 1. In the WISDM study, the wear time rate was 93.1% (standard deviation [SD]: 20.4) over the final-month window. The wear time rate was 94.5% (SD: 11.9) over the full-trial window. In the CITY study, the wear time rate was 82.2% (SD: 26.5) over the final-month window. The wear time rate was 83.1% (SD: 21.5) over the full-trial window. The distributions of wear times over each time interval are presented in Figure 1. The F-statistic for the first stage of our IV models in the WISDM study was 6296 and was 1171 in the CITY study models, indicating that our instrument (trial randomization group) strongly predicts the exposure of interest (wear time of unblinded CGM).

Wear time of CGM in the treatment group of the CITY and WISDM studies. CGM, continuous glucose monitoring; CITY, CGM Intervention in Teens and Young Adults with Type 1 Diabetes; WISDM, Wireless Innovation for Seniors with Diabetes Mellitus.
Summaries of the Wireless Innovation for Seniors with Diabetes Mellitus and Continuous Glucose Monitoring Intervention in Teens and Young Adults with Type 1 Diabetes Studies
CITY, CGM Intervention in Teens and Young Adults with Type 1 Diabetes; WISDM, Wireless Innovation for Seniors with Diabetes Mellitus; CGM, continuous glucose monitoring; HbA1c, hemoglobin A1c; SD, standard deviation.
The WISDM study
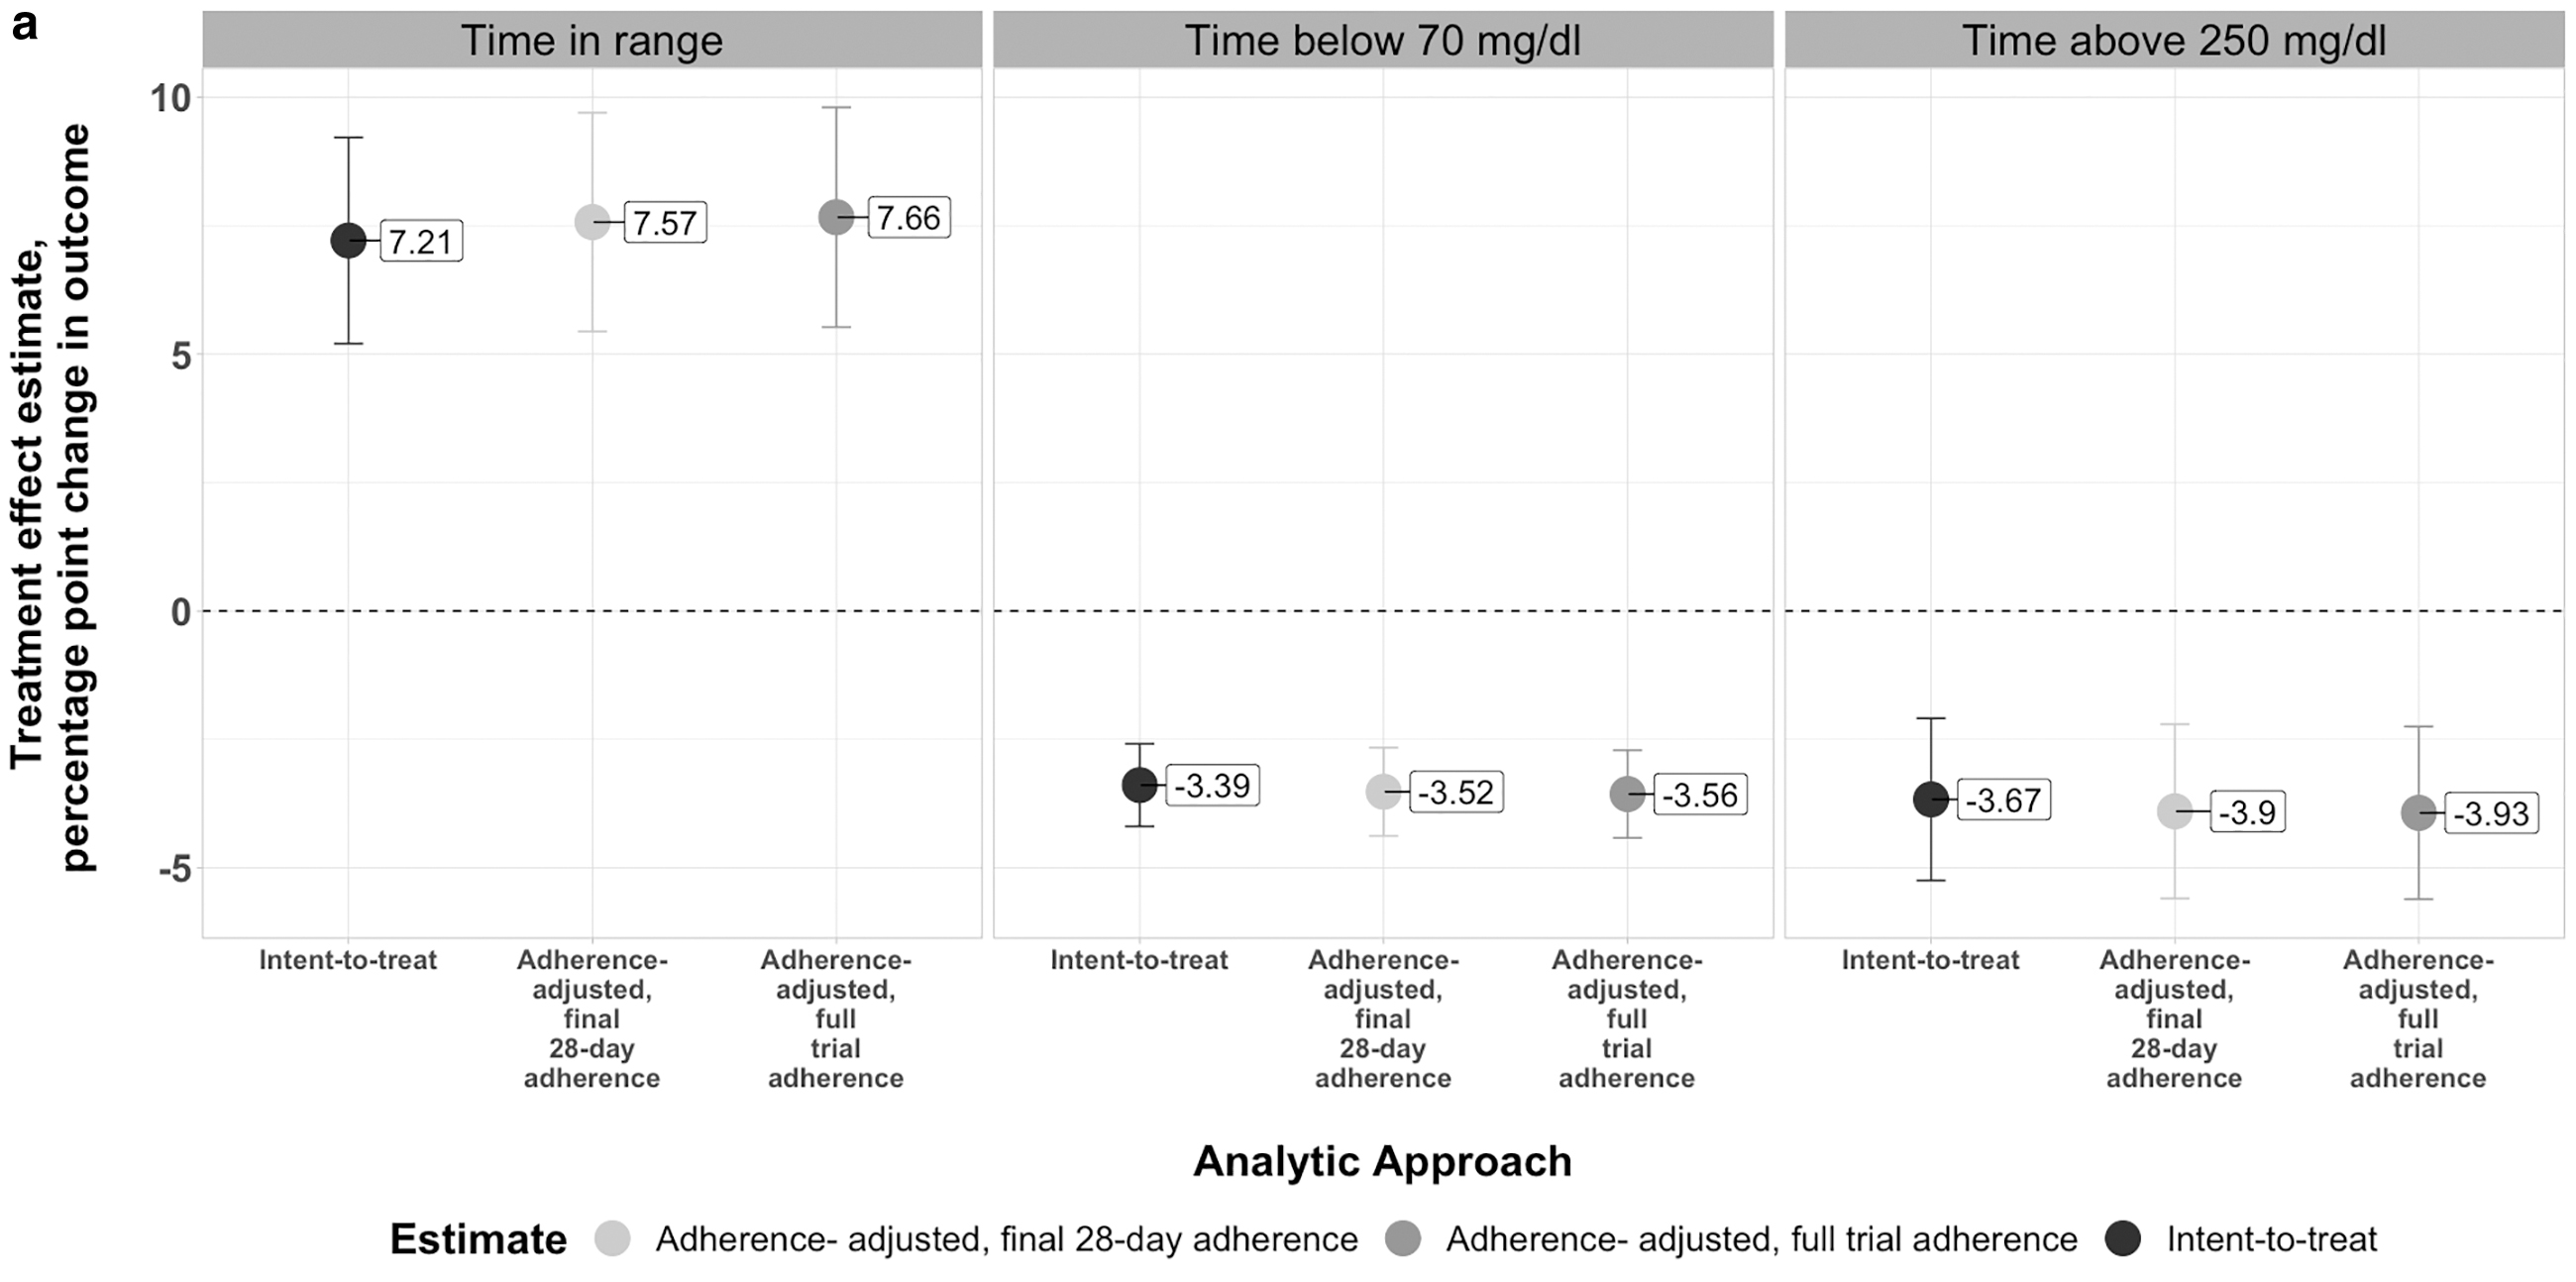
The results of the WISDM study analyses are presented in Table 2 and visualized in Figure 2a. In our ITT analyses of the WISDM study using linear mixed models, we estimate the effects of being randomly assigned to the CGM group (relative to the SMBG group) to be 7.21 (95% CI: 5.20–9.22) percentage point increase in TIR, 3.39 (95% CI: −4.19 to −2.59) percentage point decrease in TBR, and a 3.67 (95% CI: −5.25 to −2.09) percentage point decrease in TAR.

Results from Modeling Wireless Innovation for Seniors with Diabetes Mellitus and Continuous Glucose Monitoring Intervention in Teens and Young Adults with Type 1 Diabetes Studies
Figures for treatment effects are expressed in percentage point differences between the treatment (CGM) and control groups.
CI, confidence interval; ITT, intent-to-treat; IV, instrumental variable (adherence-adjusted estimates); RCT, randomized clinical trial.
In our wear time-adjusted analyses that used our IVs approach using final-month wear time in linear mixed-effects models, we estimate the effects of CGM usage (relative to SMBG) to be 7.57 (95% CI: 5.44–9.70) percentage point increase in TIR, 3.52 (95% CI: −4.38 to −2.66) percentage point decrease in TBR, and a 3.90 (95% CI: −5.60 to −2.20) percentage point decrease in TAR.
In our wear time-adjusted analyses that used our IVs approach with the full-trial window wear time in linear mixed-effects models, we estimate the effects of CGM usage (relative to SMBG) to be 7.66 (95% CI: 5.53–9.80) percentage point increase in TIR, 3.56 (95% CI: −4.42 to −2.71) percentage point decrease in TBR, and a 3.93 (95% CI: −5.61 to −2.25) percentage point decrease in TAR. The results of our first difference models across all analytical approaches for the WISDM study are similar and can be found in the Supplementary Material. Our bootstrapped test statistic indicates that the difference between the IV and ITT estimates are statistically significant across each of the three outcomes; more information about this is in the Supplementary Material.
The CITY study
The results of the CITY study analyses are presented in Table 2 and visualized in Figure 2b. In our ITT analyses of the CITY study using linear mixed models, we estimate the effects of being randomly assigned to the CGM group (relative to the SMBG group) to be 5.01 (95% CI: 2.30–7.73) percentage point increase TIR, 1.56 (95% CI: −2.55 to −0.57) percentage point decrease in TBR, and a 5.49 (95% CI: −8.55 to −2.43) percentage point decrease in TAR.
In our wear time-adjusted analyses that used our IVs approach with final-month wear time in linear mixed-effects models, we estimate the effects of CGM usage (relative to SMBG) to be 6.66 (95% CI: 3.21–10.11) percentage point increase in TIR, 1.88 (95% CI: −3.15 to −0.60) percentage point decrease in TBR, and a 6.68 (95% CI: −10.57 to −2.79) percentage point decrease in TAR.
In our wear time-adjusted analyses that used our IVs approach with the full-trial window wear time in linear mixed-effects models, we estimate the effects of CGM usage (relative to SMBG) to be 6.19 (95% CI: 2.95–9.42) percentage point increase in TIR, 1.73 (95% CI: −2.92 to −0.54) percentage point decrease in TBR, and a 6.54 (95% CI: −10.18 to −2.90) percentage point decrease in TAR. The results of our first difference models across all analytical approaches for the CITY study are similar and can be found in the Supplementary Material. Our bootstrapped test statistic indicates that the difference between the IV and ITT estimates are statistically significant for TIR and TAR; more information about this is in the Supplementary Material.
Discussion
The results from this study demonstrate that estimates from wear time-adjusted estimate differ from ITT estimates of the intervention effect in randomized trials of CGM use, where the magnitude of the difference is proportional to the level of wear time observed in the trials. To our knowledge, this is the first application of an IV approach to adjust for wear time of CGM, providing insight into the effects of variable wear time on estimated effects.
IV per protocol analyses should be seen as complementary, rather than competing with ITT analyses. ITT analyses provide useful estimates of the effect an intervention may have averaged over a clinical population, acknowledging that nonadherence is likely to occur. Further, ITT estimates are relevant for policy-related decisions. 2 However, ITT analyses do not answer the question: “what level of benefit or harm can an individual expect from this intervention if they adhere to it?” 2 Herein, we show that wear time-adjusted estimates may actually be demonstrably different than ITT estimates.
In the WISDM study, CGM wear time was high throughout the trial. While slightly lower, adherence to CGM was also high in the CITY study. Even so, in the CITY Trial, adjusting for adherence over the full trial using the IV approach yielded estimates of TIR that were roughly 23% larger in magnitude than the ITT estimates and estimates of CGM's effect on TAR that were 19% larger in magnitude. In both the WISDM and CITY studies, the adherence over both the full-trial window and final-month window were approximately the same, indicating that the CGM “learning curve” may be negligible with regard to our measure of adherence, although it may appear differently for different measures of adherence.
CGM are unique in that the intervention itself innately provides measures of adherence, and the downloadability of CGM data makes it ideal for measuring adherence, as researchers can identify gaps in wear time and long stretches of continuous wear time. CGM data provide several different ways to operationalize adherence, which may each prove to be valuable in different contexts. While we operationalized adherence as percentage of possible days, the participant wore their CGM, a more granular measure could be eligible hours worn, or amount of time passed before replacing expired sensors.
Based on our study, in addition to existing literature from other medical specialties, we propose the following recommendations related to the handling of adherence and wear-time in CGM and other diabetes technology trials.
Prespecify how adherence will be measured. In CGM trials, wear time makes sense, but this could be altered for other technologies. Especially in the CGM/hybrid- or closed-loop and automated insulin delivery trial space given we have passive wear time. Importantly, these same methods can be used to adjust analyses of hybrid/closed-loop insulin pump technology for time the user spends in “automated” mode.
Prespecify primary analysis: Specifying the primary endpoint as ITT is reasonable because it can generally be estimated with very few assumptions. We propose the IV-based per-protocol approach as a complement to the ITT approach.
Report adherence for each interval for which outcomes are reported. In the context of these two studies, we include these in Table 1.
Consider secondary analyses and explicit statements about what information the secondary analyses contribute: IV offers path to per-protocol with fewer biases compared to the AT approach. Explicit statements that the IV adherence-adjustment approach is just that—adjusted for adherence. It is not necessarily reflective of real-world effectiveness of an intervention; in reality, most interventions do not have perfect adherence all the time. However, the IV adherence-adjusted estimates provide an answer to “What benefit can an individual expect, on average, if they were 100% adherent to the intervention?”—and this can inform patient- and physician-level decision-making on whether an intervention would be appropriate based on the average “best-case” effect with complete adherence.
These results may have implications for future clinical studies evaluating the effect of CGM. There is an existing literature on nonadherence to continuous glucose monitors in both real-world and clinical trial contexts, and it has both health and economic implications. Yu et al. estimate that CGM nonadherence results in over $220,000 in health care resource waste for every 100 patients with commercial insurance in the United States, which equates to almost one-quarter of health care spending on CGM. 33 They use estimates of nonadherence rates that range from 13.9% to 31.1%, which are estimates from previously published studies.
Battelino et al. found in a secondary analysis of observational data from over 10,000 patients that 77.8% of patients using CGM used it <75% of the time, indicating that almost a quarter of CGM users used their CGM <3/4 of the time. 34 They also find a strong association between CGM adherence and HbA1c reduction, further supporting the importance of understanding how adherence may affect expected benefits of CGM use. 34
There are several limitations to our analyses. It was assumed that individuals in the control arms of both studies had complete nonadherence to CGM, that is, that no participants were using CGM off protocol. There may be inherent simultaneity in measuring wear time and measuring the outcome; that is, it is possible that individuals do not wear CGM during the times they experience their worst glycemic control. This could be due to social desirability bias with respect to researchers interpreting the blood glucose data or an individual not wanting alerts or reminders of their out-of-range blood glucose levels. As such, there is no way of knowing whether the reasons for not using CGM are systematically related to the outcomes being measured.
However, we address this limitation by applying the same models to HbA1c, which is collected separate from the CGM-derived outcome measures via a blood test at a laboratory or office visit. Results are similar to those presented in our main text and can be found in our Supplementary Material. Second, while wear time does indicate how frequently an individual had their CGM operational, it does not capture the extent to which participants use CGM readings for diabetes management. However, it may be the best existing proxy for CGM utilization, and particularly for larger groups of study participants. In this vein, we acknowledge that the possibility of anytime CGM use, even short term, may confer learning and behavior change that is sustained in periods of nonuse.
For example, patients may learn that consumption of certain foods may require different insulin dosing than they realized before they used CGM and may continue applying this information even when not using CGM. Finally, the measure of adherence that we use is imperfect. We chose to use the percentage of possible days during the study period during which the individual had any CGM readings. We did so to avoid penalizing adherence for routine occurrences that are subday duration in nature that do not truly reflect nonadherence; for example, the 2 h during which the CGM would not be recording readings while a newly inserted sensor is warming up.
We used a conservative estimate of adherence; giving an individual credit for 100% adherence for a day when they only used a CGM for as little as 5 min (1 reading) likely overestimates their true adherence. Using a subday measure of adherence would decrease observed adherence (relative to our approach) and increase the differences between the ITT estimates and the IV-based per-protocol estimates.
There are also several strengths, including a novel application of the IV method to CGM trials. In addition to the methodologic contribution, our results suggest that the effect of variable wear time is non-negligible, and thus ITT estimates may not be sufficient for individual decision-making. Our approach to adherence, crediting an individual with an adherent day for having one or more CGM readings that day, means that the adherence-adjusted estimates and their differences from the ITT estimates are conservative estimates. Future studies can measure active utilization of CGM for diabetes management rather than passive wear time, perhaps by accessing recorded mobile device data that measure the frequency with which the patient accessed their CGM readings.
This includes real-world evidence and observational studies; when CGM readings are downloaded or recorded by a provider, adherence can be extracted from the downloads and used to adjust for adherence in studies based on electronic health record data or clinical registries that incorporate CGM usage. The same can be said for loop-based or automated insulin delivery systems, as time spent in “automated” or “loop” mode can be considered as a measure of adherence. This will be particularly important as automated insulin delivery systems advance in complexity and effectiveness, as individuals using the systems will likely not be using “automated” mode 100% of the time, either due to necessary lapses due to CGM unavailability in sensor warm-up periods or due to personal preferences. More research is needed on human interactions with CGM and corresponding effects on glycemic outcomes, which will contribute to improving real-world adherence to CGM to optimize multiple parameters of glycemic management.
Footnotes
Authors' Contributions
J.M.W., K.S., and S.A.B. designed the analysis. J.M.W. and K.S. prepared and analyzed the data. J.M.W., A.R.K., S.A.B., R.E.P., and K.S. all contributed to writing and revising the article. A.R.K. guided idea development and supervised the analysis. All authors approved the final version of the article. J.M.W. is the guarantor of this work and, as such, had full access to all the data in the study and takes responsibility for the integrity of the data and the accuracy of the analysis.
Author Disclosure Statement
J.M.W. reports work on a research grant funded by Dexcom outside of the submitted work. S.A.B. reports research grants from NIH, North Carolina Department of Health and Human Services, Blue Cross Blue Shield of North Carolina, and Feeding America, and personal fees from the Aspen Institute, Rockefeller Foundation, Gretchen Swanson Center for Nutrition, and Kaiser Permanente, outside of the submitted work. R.E.P. reports grants to his institution from Hanmi Pharmaceutical, Janssen, Metavention, Novo Nordisk, Poxel, and Sanofi; consulting fees to his institution from AstraZeneca, Bayer, Corcept Therapeutics, Dexcom, Gasherbrum Bio, Glytec, Hanmi Pharmaceutical, Hengrui (USA), Janssen, Merck, Mundipharma, Novo Nordisk, Pfizer, Rivus Pharmaceuticals, Sanofi, Scohia Pharma, and Sun Pharmaceutical Industries; and travel expenses from AstraZeneca, Glytec, Merck, Mundipharma, Novo Nordisk, and Pfizer. A.R.K. reports receiving a research grant from the Diabetes Research Connection and a prize from the National Academy of Medicine outside the submitted work.
Funding Information
A.R.K.'s role in this project was supported by the National Center for Advancing Translational Sciences, National Institutes of Health, through Grant KL2TR002490.
Supplementary Material
Supplementary Material
References
Supplementary Material
Please find the following supplemental material available below.
For Open Access articles published under a Creative Commons License, all supplemental material carries the same license as the article it is associated with.
For non-Open Access articles published, all supplemental material carries a non-exclusive license, and permission requests for re-use of supplemental material or any part of supplemental material shall be sent directly to the copyright owner as specified in the copyright notice associated with the article.
