




Abstract
Introduction:
The Glycemia Risk Index (GRI) and Continuous Glucose Monitoring Index (COGI) are newly defined composite metric parameters derived from continuous glucose monitoring (CGM) data. GRI is divided into five separate risk zones (from lowest to highest: A–E). In this study, the effect of the advanced hybrid closed loop (AHCL) system on GRI and COGI in children with type 1 diabetes was evaluated.
Materials and Methods:
Forty-five children who had started using the AHCL and whose baseline and sixth-month CGM data were available were analyzed in terms of achievement of CGM consensus goals and changes in GRI scores and zones. The paired t-test was used for the analyses.
Results:
The mean age and duration of diabetes of the participants were 10.95 ± 3.41 and 3.85 ± 2.67 years, respectively. The mean GRI score significantly decreased from 35.66 ± 17.46 at baseline to 22.83 ± 9.08 at 6 months (P < 0.001). Although the proportion of those in the A zone was 20% at baseline, it increased to 42% at 6 months. AHCL also improved COGI from 72.59 ± 12.44 to 82.90 ± 7.72 (P < 0.001). Time in range (TIR) increased significantly from 70.54% to 80.51% (P < 0.001) at 6 months.
Conclusion:
AHCL provides not only an improvement in TIR but also a significant improvement in both GRI and COGI at 6 months. The incorporation of GRI and COGI alongside TIR may enhance the assessment of the glycemic profile by providing a more comprehensive and in-depth analysis.
Introduction
Recently, with the developments in diabetes technologies, the use of continuous glucose monitoring (CGM) systems has become widespread, and numerous CGM-derived glycemic metrics have started to be used to evaluate glycemic control in people with diabetes alongside glycated hemoglobin (HbA1c) measurement. Thanks to these data, it has been possible to examine the effectiveness of new treatment methods more comprehensively. Currently, the most used of these new CGM-derived parameters is time in range (TIR). 1 TIR corresponds to the percentage of readings and length of time per day within the target glucose range.
According to the international TIR consensus report, the target glucose range is defined as 70–180 mg/dL, and it is recommended that the target for TIR should be at least 70%. 1 Although TIR is significantly correlated with hyperglycemia and time above range (TAR) (>180 mg/dL), it is poorly correlated with the risk of hypoglycemia and time below range (TBR) (<70 mg/dL). 2 People with diabetes have also reported that the biggest obstacle to good diabetes management is the fear of hypoglycemia. 3 Also, it remains uncertain as to whether everyone with diabetes who has a TIR >70% also has a low risk of hypoglycemia. 2
Automated insulin delivery (AID) systems were launched quite recently and are used by both children and adults with diabetes. 4 –7 The advanced hybrid closed loop (AHCL)-MiniMed™ 780G system is one such recent AID systems. It has several features, including automated correction boluses, automatic basal delivery, and safe meal bolus. Numerous studies have shown that these systems improve the glycemic profile and quality of life of people with diabetes. It has been shown in studies that the use of different AID systems increases the TIR in people with diabetes. 8 –10 However, in these studies, there is generally less emphasis on the risk of hypoglycemia or severe hypoglycemia.
The Glycemia Risk Index (GRI) is a promising and newly defined glycemic parameter showing the risk of hypoglycemia and hyperglycemia together, something which is difficult to detect using only TIR. Similar to TIR, GRI is derived from CGM data. It is defined based on scores from 330 experts on 225 CGM tracings. Their scores were calculated in a model to derive the risk score from the following CGM metrics: time in high glucose 180–250 mg/dL (Hyperglycemia level 1—High), time in very high glucose >250 mg/dL (Hyperglycemia level 2—VHigh), time in low glucose TBR 54–70 mg/dL (Hypoglycemia level 1—Low), and time in very low glucose <54 mg/dL (Hypoglycemia level 2—VLow).
GRI shows the risk of hypoglycemia and hyperglycemia as a single number between 0 and 100, with 0 being the best profile and 100 being the worst. 1,2 Continuous Glucose Monitoring Index (COGI) consists of three key components: TIR, TBR, and glucose variability (GV) (weighted by 50%, 35%, and 15%). COGI ranges from 0 to 100, whereas an increase of TIR by 1 percentage point will increase the COGI by 0.5 points. 11
This study was designed to investigate whether AHCL improves GRI and COGI, both composite parameters, in children with type 1 diabetes (T1D).
Materials and Methods
In this retrospective longitudinal study, 309 children with T1D who were on continuous subcutaneous insulin infusion (CSII) therapy were recruited between June 2016 and October 2022 in the Department of Pediatric Endocrinology and Diabetes at the Koç University Hospital, Turkey. The inclusion criteria for the study were as follows: to have had diabetes for at least 1 year, to have no additional diseases, and to have at least 70% of 14-day CGM data accessible at the baseline and the 6-month of AHCL initiation regardless of previous treatment modality. The baseline CGM data from the day of the AHCL insertion were downloaded through the Dexcom Clarity or LibreView websites for multiple daily injections (MDI) users and the Carelink System® for CSII users. The required 6 months of CGM data were also accessed through the Carelink System. Age, gender, diabetes duration, total daily insulin, and HbA1c at the baseline and at 6 months were obtained from electronic medical records.
TIR 70–180 mg/dL, TBR <70 mg/dL, TBR 54–70 mg/dL (Hypoglycemia level 1) and TBR <54 mg/dL (Hypoglycemia level 2), TAR >180 mg/dL, TAR 180–250 mg/dL (Hyperglycemia level 1) and TAR >250 mg/dL (Hyperglycemia level 2), coefficient of variation (CV) and glucose management indicator (GMI) were obtained from the CGM data at the baseline and the 6-month based on the International Consensus of CGM. 12 The baseline and 6-month hypoglycemia component and hyperglycemia component were calculated using the “Vlow + (0.8 × Low)” and “VHigh + (0.5 × High)” formulas, respectively. The baseline and 6-month GRI were calculated using the “(3.0 × HypoComponent) + (1.6 × HyperComponent)” formula. 2
The GRI scores were analyzed by separating them into five zones: zone A (0–20), zone B (21–40), zone C (41–60), zone D (61–80), and zone E (81–100). The data of children with TIR >70% and TBR >4% at the baseline were analyzed separately for changes in GRI and GRI zones. A COGI and a composite CGM metric ranging between 0 (worst glycemic profile) and 100 (best glycemic profile), were calculated based on TIR, standard deviation (SD), and TBR as previously described. 11 The protocols were conducted according to the Declaration of Helsinki principles and were approved by the Institutional Research Ethics Committee (2023.001.IRB1.001). Informed consent agreeing to participate in the study was obtained from the caregivers and the children >12 years of age.
The frequencies and percentages represented the categorical variables. For the continuous variables, mean and SD values were used if the variables had a normal distribution and median values were used if the variables did not have a normal distribution. The CGM metrics, GRI values, and distribution of GRI zones at the baseline and at 6 months were compared. The χ 2 and McNemar's tests for categorical variables, the paired t-test was used to compare within subjects at two time points and reported as change in mean and standard error of the mean (SEM). t-Scores were calculated as change in mean divided by SEM to report the improvement in each metric. The correlation between changes in the CGM metrics were tested with Spearman's correlation. A two-sided P-value <0.05 was considered statistically significant. All analyses were conducted using SPSS version 26 (IBM SPSS Statistics for Windows, Version 26.0.; IBM Corp, Armonk, NY).
Results
A total of 45 children with T1D who met the inclusion criteria were included in the analysis (Fig. 1). Of the participants, 51% (n: 23) were girls. The mean ± SD age and the mean ± SD duration of diabetes were 10.95 ± 3.41 and 3.85 ± 2.67 years, respectively. Before initiating AHCL, 56% (n: 25) of the patients were on MDI, with 16 of them using FreeStyle Libre and 9 of them using Dexcom G6. The remaining 44% (n: 20) were on MiniMed® 640G with a predictive low glucose suspend feature. The mean ± SD daily insulin dose was 0.91 ± 0.18 U/kg. Of 38 children, the mean ± SD HbA1c level was 7.10% ± 0.60% at baseline. The demographic features and the baseline characteristics are given in Table 1. The percentage of sensor usage was 93.90% ± 6.34% at the baseline. The percentage of sensor usage was 92.10% ± 4.60%, and the percentage of those on the smart guard was 95.49% ± 10.43% at 6 months of AHCL use.

Study flow diagram. AHCL, advanced hybrid closed loop; CSII, continuous subcutaneous insulin infusion; T1D, type 1 diabetes.
Baseline Characteristics of Participants (n = 45)
Hyperglycemia level 1; TAR (180–250 mg/dL), hyperglycemia level 2; TAR >250 mg/dL, hypoglycemia level 1; TBR (54–70 mg/dL), hypoglycemia level 2; TBR (<54 mg/dL), TIR (70–180 mg/dL).
Thirty-eight children were evaluated due to missing data.
CGM, continuous glucose monitoring; CV, coefficient of variation; HbA1c, glycated hemoglobin; SD, standard deviation; TAR, time above range; TBR, time below range; TIR, time in range.
The GRI was 35.66 ± 17.46 at baseline and decreased significantly to 22.83 ± 9.08 (P < 0.001) at 6 months (Table 2). Hypoglycemia and hyperglycemia components of GRI were decreased from 4.47 ± 6.57 to 2.43 ± 1.82 (P = 0.026) and from 14.29 ± 7.24 to 9.71 ± 5.08 (P < 0.001), respectively. Whereas the rates of participants in the GRI zones at baseline A, B, C, D, and E were 20%, 42%, 33%, 2%, and 2%, respectively, at 6 months the rate of those who were in zone A was 42%, those in zone B was 53% and those in zone C was 4%, there were no participants in zones D and E (Table 2 and Fig. 2). The change in zone A and zone C were significant (P = 0.031 and P = 0.002, respectively), whereas the change in zone B was not (P = 0.424). The COGI increased from 72.59 ± 12.44 at baseline to 82.90 ± 7.72 at 6 months (P < 0.001) and TIR increased from 70.54% at baseline to 80.51% at 6 months (P < 0.001).
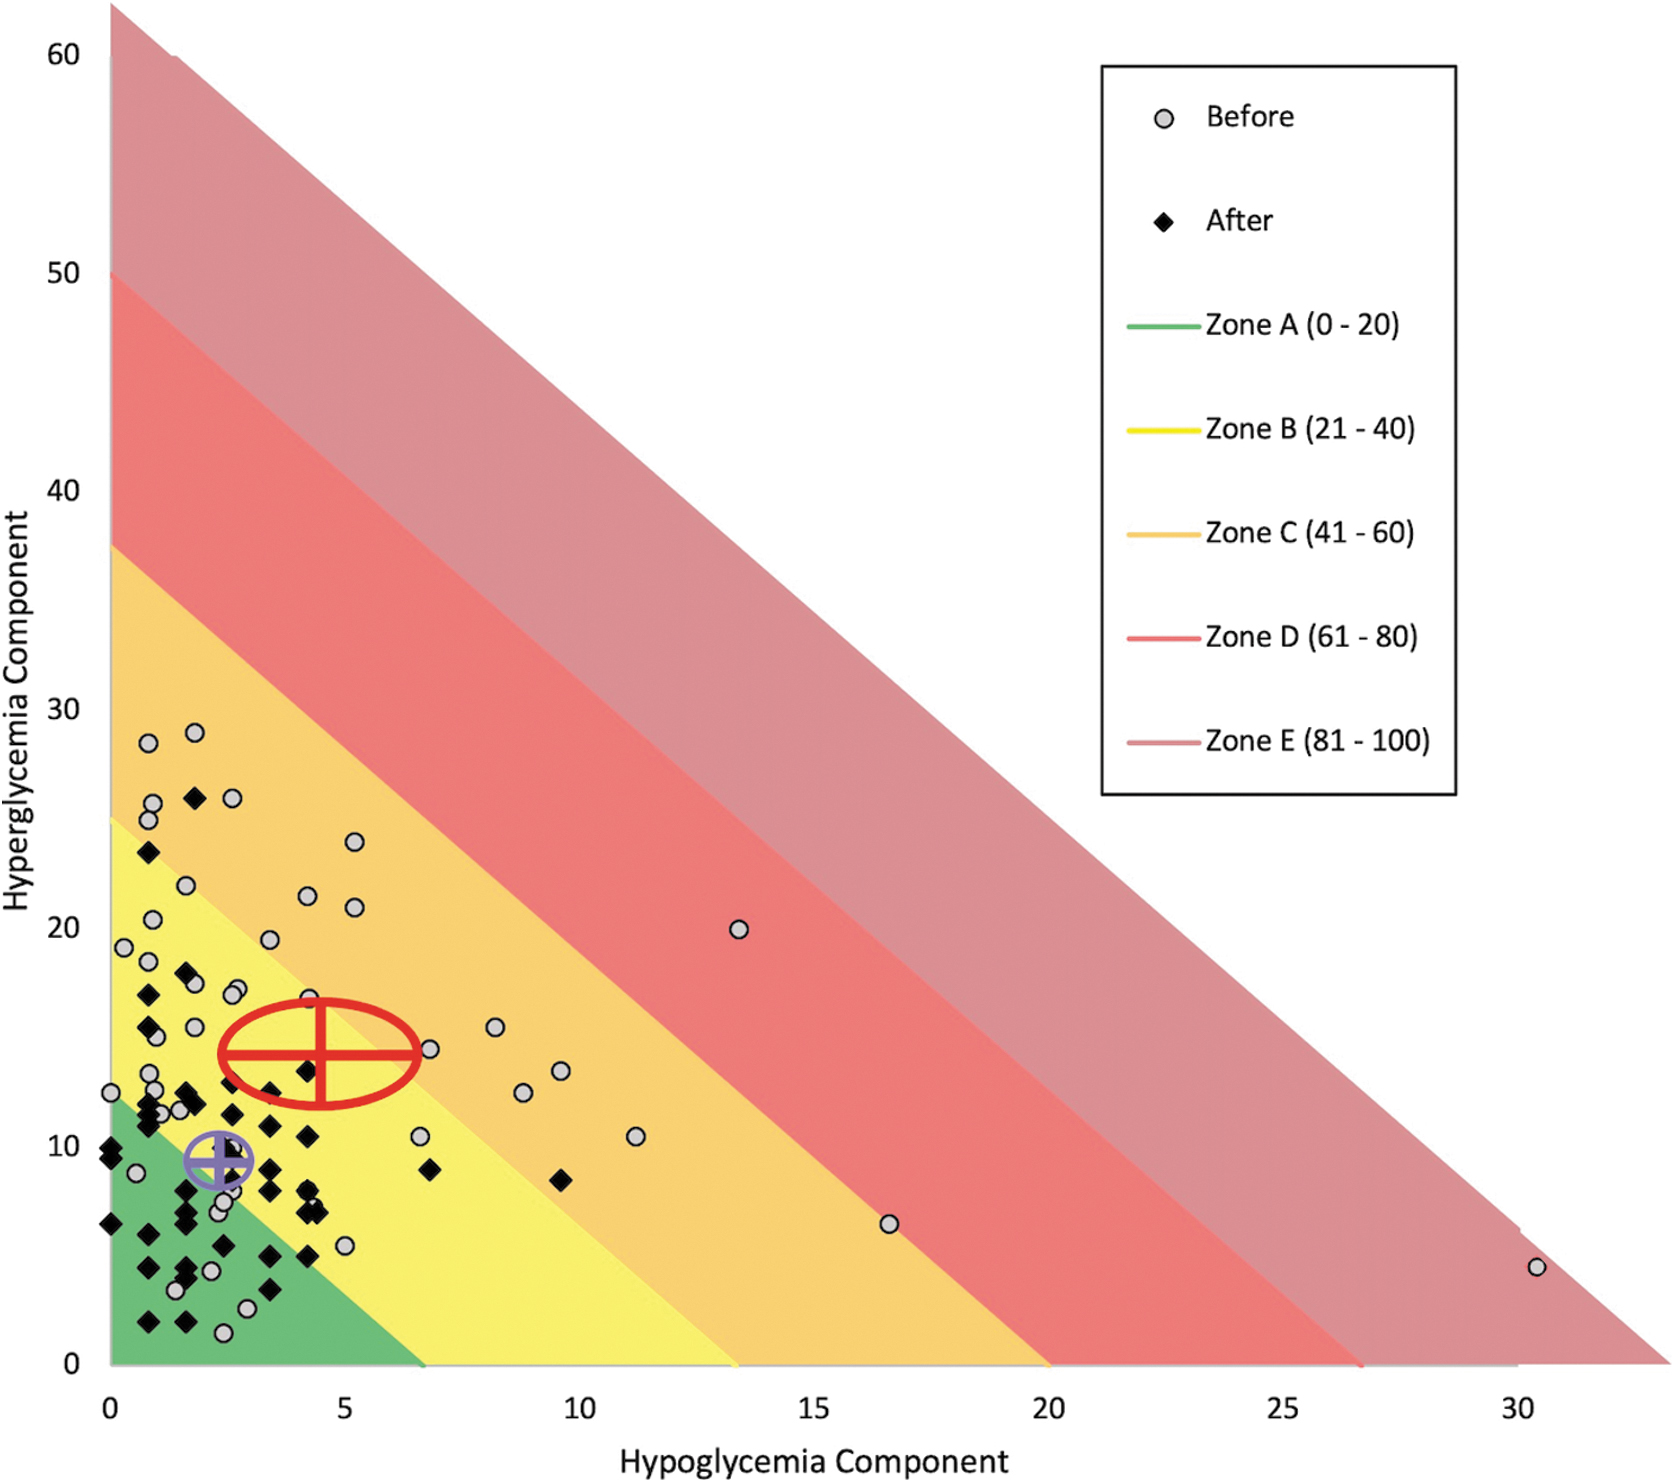
Pre- and post-AHCL GRI zones in all participants. The mean with 95% CIs of hypoglycemia component and hyperglycemia components are given for before (red lines, and ellipse surrounding the lines) and after (magenta lines, and ellipse surrounding the lines) AHCL. Mean GRI was 35.7 (95% CI: 30.4–40.9) before AHCL and mean GRI was 22.8 (95% CI: 20.1–25.6) at 6 months. CI, confidence interval; GRI, glycemia risk index.
A Comparison of Glycemic Profiles at Baseline and 6 Months After Advanced Hybrid Closed Loop Initiation
Hyperglycemia level 1; TAR (180–250 mg/dL), hyperglycemia level 2; TAR >250 mg/dL, hypoglycemia level 1; TBR (54–70 mg/dL), hypoglycemia level 2; TBR (<54 mg/dL), TAR (>180 mg/dL), TBR (<70 mg/dL), TIR (70–180 mg/dL).
t-Scores were calculated as mean change/SEM for each variable.
Variables at the baseline and 6 months were compared by paired t-test.
Three children were excluded due to missing data.
The change in the given zone was compared by McNemar test, which hypothesized that participants remained in the same zone.
Thirty-six children were excluded in the comparison due to missing paired A1c values.
COGI, continuous glucose monitoring index; CV; coefficient variation, GMI, glucose management indicator; GRI, glycemia risk index; N/A, not available; SEM, standard error of the mean; TDD, total daily dose.
Time in hyperglycemia level 1 decreased significantly from 19.03% ± 8.35% at baseline to 13.82% ± 5.24% at 6 months (P < 0.001). The mean time in hyperglycemia level 2 decreased significantly at 6 months compared with the baseline (4.77% ± 4.04% vs. 2.80% ± 2.96%, P = 0.001). Whereas the mean time in hypoglycemia level 1 decreased significantly at 6 months compared with baseline (3.43% ± 3.27% vs. 2.29% ± 1.44%, P = 0.005), hypoglycemia level 2 did not change significantly at 6 months (1.72% ± 4.67% vs. 0.60% ± 0.78%, P = 0.106) The decrease in mean glucose was also significant (150.50 ± 27 mg/dL vs. 136.11 ± 12.33 mg/dL, P < 0.001). However, CV did not change significantly at 6 months (P = 0.514). When looking at the mean change/SEM values, COGI has the highest t-value of 6.8 followed by TIR (6.25), GRI (−5.18) and then TAR (−4.8) (Table 2).
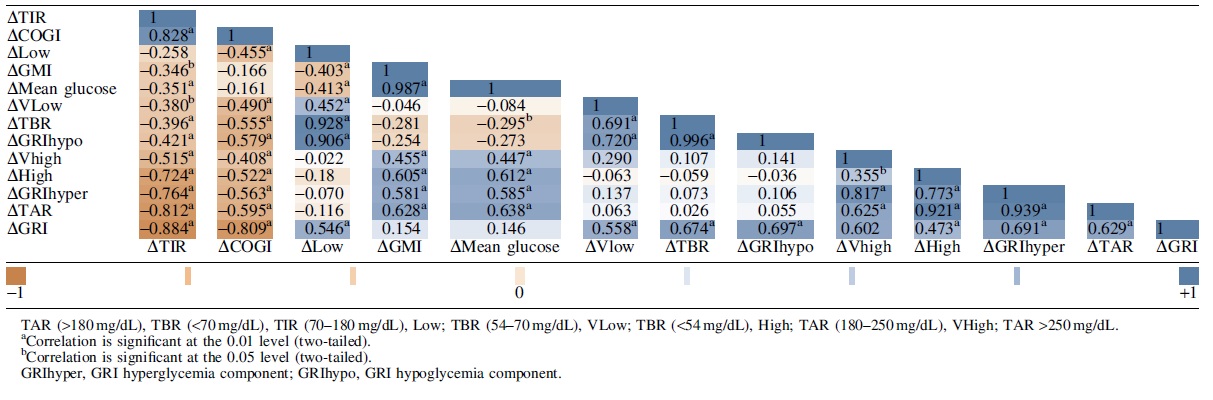
At 6 months, there was a significant negative correlation between TIR and GRI (r = −0.914, P < 0.001) and a significant negative correlation between TIR and mean glucose (r = −0.841, P < 0.001). Correlations between changes in CGM metrics are shown in Table 3. Change in TIR was significantly correlated with change in GRI (r = −0.884, P < 0.001), change in COGI (r = 0.828, P < 0.001), change in mean glucose (r = −0.351, P = 0.02), and change in GMI (r = −0.346, P = 0.02). Change in GRI was significantly correlated with change in COGI (r = −0.809, P < 0.001); however, it was not correlated with change in mean glucose (r = 0.146, P = 0.34), and change in GMI (r = 0.154, P = 0.31). Change in TIR correlated more with change in TAR (r = −0.812, P < 0.001) than change in TBR (r = −0.396, P = 0.007). Change in GRI provided similar correlations with change in TAR (r = 0.629, P < 0.001) and change in TBR (r = 0.674, P < 0.001).
Correlations Between Changes in Continuous Glucose Monitoring Metrics
Whereas 29% of participants (n = 13) achieved a combined target of TIR >70% and TBR <4% and VLow <1% at the baseline, 44% (n = 20) achieved the same target at 6 months (P = 0.189). Four participants who achieved TIR >70% at baseline but failed to achieve TBR <4% were analyzed separately. Although they met the TIR target, none of them were in the A zone (the lowest glycemic risk), one participant was in the C zone and three participants were in the B zone. After using AHCL, the GRI scores of those four participants decreased, one participant in zone C moved to zone B and one participant in zone B moved to zone A.
With the use of AHCL, the mean ± SD GRI score decreased from 42 ± 18.7 to 22.1 ± 9.3 in patients whose previous treatment modality was MDI (P < 0.001), whereas it decreased from 27.7 ± 12 to 23.8 ± 8.9 in those who used CSII (P = 0.07). The mean ± SD TIR increased from 67.6% ± 11.7% to 81.6% ± 7.5% for MDI users (P < 0.001) and from 74.2% ± 10% to 79.1% ± 7.3% for CSII users (P = 0.008). The improvement in GRI and TIR after switching to AHCL was more pronounced for those who switched from MDI than for those who switched from CSII (for GRI P < 0.001, for TIR P < 0.001).
Discussion
In this study, real-world data from children with T1D on AHCL were evaluated for GRI and COGI scores, both composite metrics, as well as other glycemic parameters derived from CGM. AHCL was shown to significantly reduce GRI (13%), significantly increase COGI (9.4%), and TIR (10%) in the study group. In the optimal care of diabetes, keeping glucose levels as close to normal as possible is important to avoid acute and chronic complications. 13,14 In studies on AID systems, TIR was taken as the main indicator of effectiveness. 15
There are studies that report significant improvements in TIR after starting the use of AHCL—one of the aforementioned AID systems. 8,16,17 In our cohort, the proportion of those meeting all three of the CGM consensus targets, that is, having TIR >70%, TBR <4%, and VLow <1% increased within 6 months when using the AHCL, although this increase was not significant. The mean glucose showed a significant decrease (150.50 mg/dL vs. 136.11 mg/dL). Both the change in GRI and the change in TIR correlated with TBR and TAR. The change in TIR correlated more with the change in TAR, compared with the change in TBR (r = −0.812 vs. r = −0.396).
Our study aligns with a recent study by Rodbard 18 indicating that HbA1c is the least sensitive measure for detecting changes in glycemia, as shown in Table 2. In the same study it was shown that the correlations between CGM metrics also showed a higher correlation between TIR and TAR (r = −0.96) and the correlation between ΔTAR and Δ (mean glucose) were stronger than the correlation between ΔTIR and Δ (mean glucose). 18 The TIR showed slightly lower sensitivity than TAR, with excellent sensitivity to hyperglycemia but only marginal sensitivity to hypoglycemia. 18 In contrast, this study found that the change in TAR is not more sensitive than the change in TIR (Table 2). Our findings reveal similarity between the GRI, which reflects both hypoglycemia and hyperglycemia components, and the COGI, which is based on TIR and hypoglycemia (TBR <54 mg/dL) and variability (SD) components.
Although TIR is the most frequently used CGM-derived parameter in the evaluation of the glycemic quality and is a well-structured metric that is easy to understand, it is inadequate for distinguishing the severity of hypoglycemia and hyperglycemia out of the TIR. 2 Various parameters and graphical representations have been proposed in the search for new evaluation parameters and methods. Rodbard suggested various graphical designs using multiple parameters (hypoglycemia, hyperglycemia, and mean glucose) to show the change in the glycemic status of a person with diabetes during the day, between days, and after an intervention. 19
Vigersky et al., moreover, proposed a new composite metric called “the comprehensive glucose pentagon” (CGP) model based on CGM data, with five components consisting of mean glucose, GV, hypoglycemia severity, hyperglycemia severity, and time out of target range. It has been suggested that the CGP offers diabetes teams, researchers, and even people with diabetes the potential to better understand the components of glycemic control and the factors that affect metabolic control. 20 COGI was also introduced to provide a glycemic profile score derived from TIR, TBR, and SD into a single score between 0 and 100 similar to GRI and was tested on data of previous clinical trials. 11 However, these new models were not widely used in daily clinical practice, perhaps because they were not easily calculated.
The GRI and COGI are new and promising composite metrics that has been shown to correlate with clinicians' views on the quality of glycemia. 2,14 Both scores can be easily calculated mathematically and incorporated into CGM data, making them potentially useful metrics. By emphasizing very low and very high glucose components, the GRI offers a risk-focused assessment that provides a more comprehensive evaluation than TIR alone. Since it is a parameter derived from Low, VLow, High, and Vhigh, it indirectly provides information about TIR and allows for the evaluation of five parameters using a single score and zone system. In clinical settings, it can offer ease of use. Plotting an individual's visits on a grid can provide more insights into how diabetes care is progressing for that individual, while also objectively showing differences between groups in a study or assessing a new treatment modality.
In addition, the GRI has been proposed as an objective measure in the recent consensus on CGM metrics in clinical trials. 21 Given these theoretical advantages of GRI and COGI, which consider both hyperglycemia and hypoglycemia components (GRI) or TIR, TBR, and variability, 2,11 we conducted within-subject analyses to compare the changes in these composite metrics, as well as the widely used metric TIR and other metrics, before and after implementing AHCL. Our results showed that the t-score (the mean change/SEM) is 6.8 for COGI, 6.25 for TIR, −4.8 for TAR, and −5.12 for GRI (Table 2). Although the change in mean of GRI was greater than the change in mean of TIR and COGI, sensitivity of GRI is not superior to COGI and TIR as t-scores suggest. Similarly, the mean change in TAR has similar sensitivity compared with GRI.
Both TIR and GRI are evaluated out of 100 points. Although GRI aims to decrease the underestimation of hypoglycemia, there are not enough data for children regarding this scoring system—a system that was developed using 225 CGM data references for adults. 2 In a recent study conducted on 202 children and adults with T1D, GRI was evaluated with the use of MDI and CSII, and it was shown that GRI scores were better in children with the use of CSII. 22 In a study evaluating the transition from an open-loop insulin infusion system to AID use, there was a 13.2% difference in GRI and a 5% difference in TIR. 14
COGI was also produced to provide a comprehensive glycemic profile as a single score; however, data on COGI are lacking in the literature. Klonoff et al. noted that compared with the GRI's components, the use of a combination of TIR and TBR did not provide as good a fit to clinician rankings. 2 Interestingly our study showed that COGI is a sensitive composite metric to assess glycemia. Although the change in the mean is greater in TIR compared with COGI, the greatest sensitivity for the improvement in glycemia is shown with COGI as t-scores suggest.
In a recent study by Montaser et al., 23 which analyzed 75,563 2-week CGM profiles from 790 individuals with type 1 or type 2 diabetes across six studies, two essential metrics (one heavily weighted toward TIR and/or TAR) and another weighted for hypoglycemia and/or variability (CV), in other words quantifying exposure to hyperglycemia (treatment efficacy) and risk for hypoglycemia (treatment safety) were found to explain ∼90% of the variance in both the training and test data. The authors suggest that optimizing diabetes treatment can be simplified to a two-dimensional problem, as other markers have already lied in the same plane. By optimizing these two principal components, the other markers would naturally be optimized as well. However, more studies with larger cohorts are needed to determine which of these parameters is best or most sensitive to evaluate the glycemic profile.
It was shown that TIR, mean glucose, and HbA1c are correlated. 24 The strong correlation between TIR and GRI suggests that GRI may significantly correlate with HbA1c. The association of HbA1c with diabetes-related complications is well known 25 and multiple previous retrospective studies have shown the association between CGM metrics such as TIR and diabetes-related complications, and given the association between TIR and GRI, improving GRI may be associated with a reduction in diabetes-related complications. 26,27 Although the proportion of children achieving the composite consensus target increased from 29% to 44% after switching to AHCL, there was no statistically significant difference, probably due to the small size of the study group.
The limitations of this study are its retrospective design, lack of homogenous treatment modality at the baseline, and the small study group. Furthermore, GRI and COGI have not been adequately evaluated in the pediatric age group previously, so their validity and utility in this age group remain to be determined.
Conclusion
In our study, GRI improved and shifted toward lower-risk zones with the use of AHCL. However, it is important to note that the recent study, which was conducted on a relatively small cohort, does not provide compelling evidence that GRI is a superior parameter to TIR and COGI. Nevertheless, the incorporation of GRI and COGI alongside TIR may enhance the assessment of the glycemic profile by providing a more comprehensive and in-depth analysis. More studies are needed to be able to strongly recommend the use of GRI and COGI in children with diabetes.
Footnotes
Acknowledgments
The authors would like to thank the children, their families, and Alan J. Newson for English language editing. (Alan J. Newson is an academic proofreader in İstanbul University).
Authors' Contributions
E.E., G.Y.M., K.E.K., E.C., T.G., S.M., and S.H. designed the study. E.E. and K.E.K. collected the data. E.E., G.Y.M., and K.E.K. performed data analysis. E.E., G.Y.M., K.E.K., and S.H. wrote the article. All authors read and approved the final version of the article.
Author Disclosure Statement
No competing financial interests exist.
Funding Information
This research received no specific grant from any funding agency in the public, commercial, or not-for-profit sectors.