




Abstract
Objectives:
To study real-world effect of switching to Insulin Glargine 300 U/mL (Gla-300) on glucose metrics in people with type 1 diabetes.
Methods:
This retrospective secondary-use study compared 151 adults who switched to Gla-300 from first-generation long-acting insulins (Switchers) to 281 propensity-score matched controls (Non-switchers) who continued first-generation long-acting insulins. Primary endpoint was difference in time in range (TIR) evolution. A fictive “switching” date was assigned to Non-switchers to facilitate between-group comparisons.
Results:
In the period before switching, TIR decreased numerically for people in whom Gla-300 was eventually initiated (−0.05%/month [−0.16 to 0.07]), while it increased for matched controls (0.08%/month [0.02 to 0.015]; between-group difference P = 0.047). After Gla-300-initiation, Switchers had similar TIR increase compared to Non-switchers (P = 0.531). Switchers used higher basal dose than before switch (Δ0.012 U/[kg·d] [0.006 to 0.018]; P < 0.0001).
Conclusion:
In real-life, Gla-300 was typically initiated in people where TIR was decreasing, which was reversed after switch using slightly higher basal insulin dose.
ClinicalTrials:
ClinicalTrials.gov number NCT05109520.
Introduction
The gold standard for treating type 1 diabetes (T1D) is to mimic beta-cell physiology as closely as possible through exogenous insulin administration, with dosing being adjusted based on frequent glycemic control. The benchmark is to maintain stable basal insulin levels throughout the day and increased insulin levels at mealtimes. To assist with day-to-day treatment adaptations, continuous glucose monitoring (CGM) provides a powerful tool by offering a thorough interpretation of glycemic management through accompanying glucose metrics such as time in ranges (TIRs). 1
New long-acting insulins aim to improve action profiles and offer clinical benefits. 2 This study focuses on Insulin Glargine 300 U/mL (Gla-300; Toujeo®; Sanofi, Frankfurt, Germany), a concentrated form of Insulin Glargine 100 U/mL (Gla-100; Lantus®; Sanofi) that provides longer action times. 3 Gla-300 has superior pharmacokinetic and pharmacodynamic profiles and can last over 24 h, offering more flexibility in injection timing. 3 –5 According to randomized controlled trials, Gla-300 shows less within-day variability and lower rates of hypoglycemia, especially at night and during titration period. 6,7
The aim of this study is to evaluate the impact on glucose metrics and metabolic control of switching to Gla-300 under real-life conditions.
Materials and Methods
Study design
This was a multicenter, retrospective, propensity-score matched, secondary-use study which used data from the prospective observational real-world FUTURE study 8,9 to investigate if switching from first-generation long-acting insulins to the next-generation long-acting insulin Gla-300 had effects on glucose metrics and metabolic control in people with T1D using CGM.
FUTURE (ClinicalTrials.gov NCT02898714) evaluated the 24-month real-life impact of intermittently scanned CGM (isCGM; first version of the 14-day wear FreeStyle Libre flash glucose monitoring system; Abbott Diabetes Care, Witney, UK) in 1905 adults with T1D who were recruited between July 2016 and July 2018 at three Belgian centers.
The current study complied with the Declaration of Helsinki and the International Conference on Harmonization/Good Clinical Practice Guidelines and was approved by the institutional review boards and independent ethics committees of the three participating centers. The study is registered with ClinicalTrials.gov (NCT05109520).
Participants
FUTURE study participants were screened (Supplementary Table S1) to create two groups: Switchers (those who started Gla-300 as part of standard of care) and Non-switchers (those who continued using first-generation long-acting insulins). Switchers' switch date was defined as the date of their first Gla-300 prescription, while Non-switchers were assigned a hypothetical “switching” date based on their matched Switchers (see next paragraph) for comparison.
Refer to Supplementary Data S1 for propensity model and matching details. Briefly, Switchers were matched with Non-switchers based on center, gender, T1D duration, basal insulin dose, body mass index (BMI), hemoglobin A1c (HbA1c), TIR (70–180 mg/dL or 3.9–10.0 mmol/L), and time <54 mg/dL (3.0 mmol/L). A propensity score was derived using a multivariable Cox regression, considering actual and baseline value changes as predictors. Variables with P < 0.05 in univariable analyses were included. For each Switcher, Non-switchers were selected having a similar propensity score at the moment of switch, aiming for three controls per Switcher. Note that a single Non-switcher could serve as a control for multiple Switchers who switched at different times.
Greedy nearest neighbor matching was used for the matching process, allowing only exact matches on center and gender. Additional variables used were mean TIR pre-switch, actual TIR value, and daily insulin dose at time of switch. Missing values in monthly time-varying values were handled using an imputation approach based on a multivariate normal model. The imputed values were only used in the Cox model and matching procedure, not in the analysis models.
Outcomes
Primary endpoint was difference in TIR evolution over 24 h before and after switching to Gla-300 between Switchers and Non-switchers. Secondary endpoints included between- and within-group differences in HbA1c and TIRs over 24 h, during daytime (6 am–10 pm), and nighttime (10 pm–6 am). Exploratory endpoints included between- and within-group differences in prescribed insulin doses and BMI.
Data collection
FUTURE study's data collection details are available here. 8 For the current research, additional data were gathered from the electronic medical records (type of basal/bolus insulin) and from CSV files extracted from LibreView (monthly glucose metrics over 24 h, daytime, and nighttime).
Statistical analysis
Analysis model for glucose metrics and HbA1c
The 3-month period following the first prescription of Gla-300 was excluded for Switchers and their matched Non-switchers due to uncertainty regarding the exact timing of initial Gla-300 administration. This period of 3 months is referred to as the “switch period.”
Monthly glucose metrics and HbA1c values were analyzed using a linear model for longitudinal measurements. Random effects were incorporated for cluster (Switcher and its matched Non-switchers), subject within a cluster, and individual subject (the distinction between the latter two random effects was considered since the same Non-switcher can be control in multiple clusters). The time axis in the analysis refers to time since switch.
Two approaches were considered: (1) Comparing mean pre- and post-switch values based on a model using period (pre or post), group (Switcher or Non-switcher) and their interaction as fixed effects (only reported for primary outcome). (2) Comparing linear evolution between groups, allowing a different slope before and after the switch period.
Analysis model for insulin doses and BMI
Within- and between-group evaluations were based on a linear model with time (pre/post), group (Switcher/Non-switcher) and the interaction as factors. Hence, only a single pre- and post-value were included, referring to the last available value before the switch period and the first available value after the switch period, respectively. The same random effects as in the glucose metrics model were used to model the covariance matrix.
Data are shown using medians with interquartile range (IQR) or estimated mean with 95% confidence interval where appropriate. All analyses have been performed using SAS software, version 9.4 of the SAS System for Windows.
Results
Person characteristics
Of 1905 FUTURE participants, 151 Switchers and 281 Non-switchers were withheld (based on inclusion/exclusion criteria and propensity score matching; Supplementary Fig. S1). Over 90% of Switchers were matched to three Non-switchers, and 96% of Non-switchers served as controls for ≤3 Switchers (Supplementary Tables S2 and S3). Table 1 summarizes baseline characteristics. Participants of both groups were comparable except for insulin dose.
Person-Characteristics At Start of the FUTURE Study
Data are median (IQR) or n (%). Note that these descriptive data do not take into account that a Non-switcher could be matched to multiple Switchers who had switched at different time points. Hence, the data shown are from unique cases.
In case of Switchers: long-acting insulin used before switch to insulin glargine 300 U/mL.
BMI, body mass index; HbA1c, hemoglobin A1c; IQR, interquartile range; NPH, Neutral Protamine Hagedorn.
Percentage of TIR
Based on the mean of all pre-switch values, TIR did not differ significantly between Switchers (47.1% [45.2 to 49.1]) and Non-switchers (47.4% [45.5 to 49.2]; between-group P = 0.666). Also, after switch to Gla-300, no difference could be observed (Switchers: 48.1% [46.2 to 50.1]; Non-switchers: 48.8% [47.0 to 50.7]; between-group P = 0.122).
However, when the linear evolution was considered, TIR decreased numerically for Switchers (−0.05%/month [−0.16 to 0.07], P = 0.418), while it increased for matched Non-switchers (0.08%/month [0.02 to 0.015]; P = 0.013; between-group difference P = 0.047) in the period before switching. After Gla-300-initiation, Switchers showed a similar TIR evolution compared to Non-switchers (between-group difference P = 0.531). For Switchers, differences in slopes before versus after Gla-300-initiation were more pronounced during daytime (Δ0.24%/month [0.08 to 0.39]; P = 0.003) while absent during nighttime (Δ-0.04%/month [−0.22 to 0.14]; P = 0.679) (Fig. 1; Supplementary Table S4).
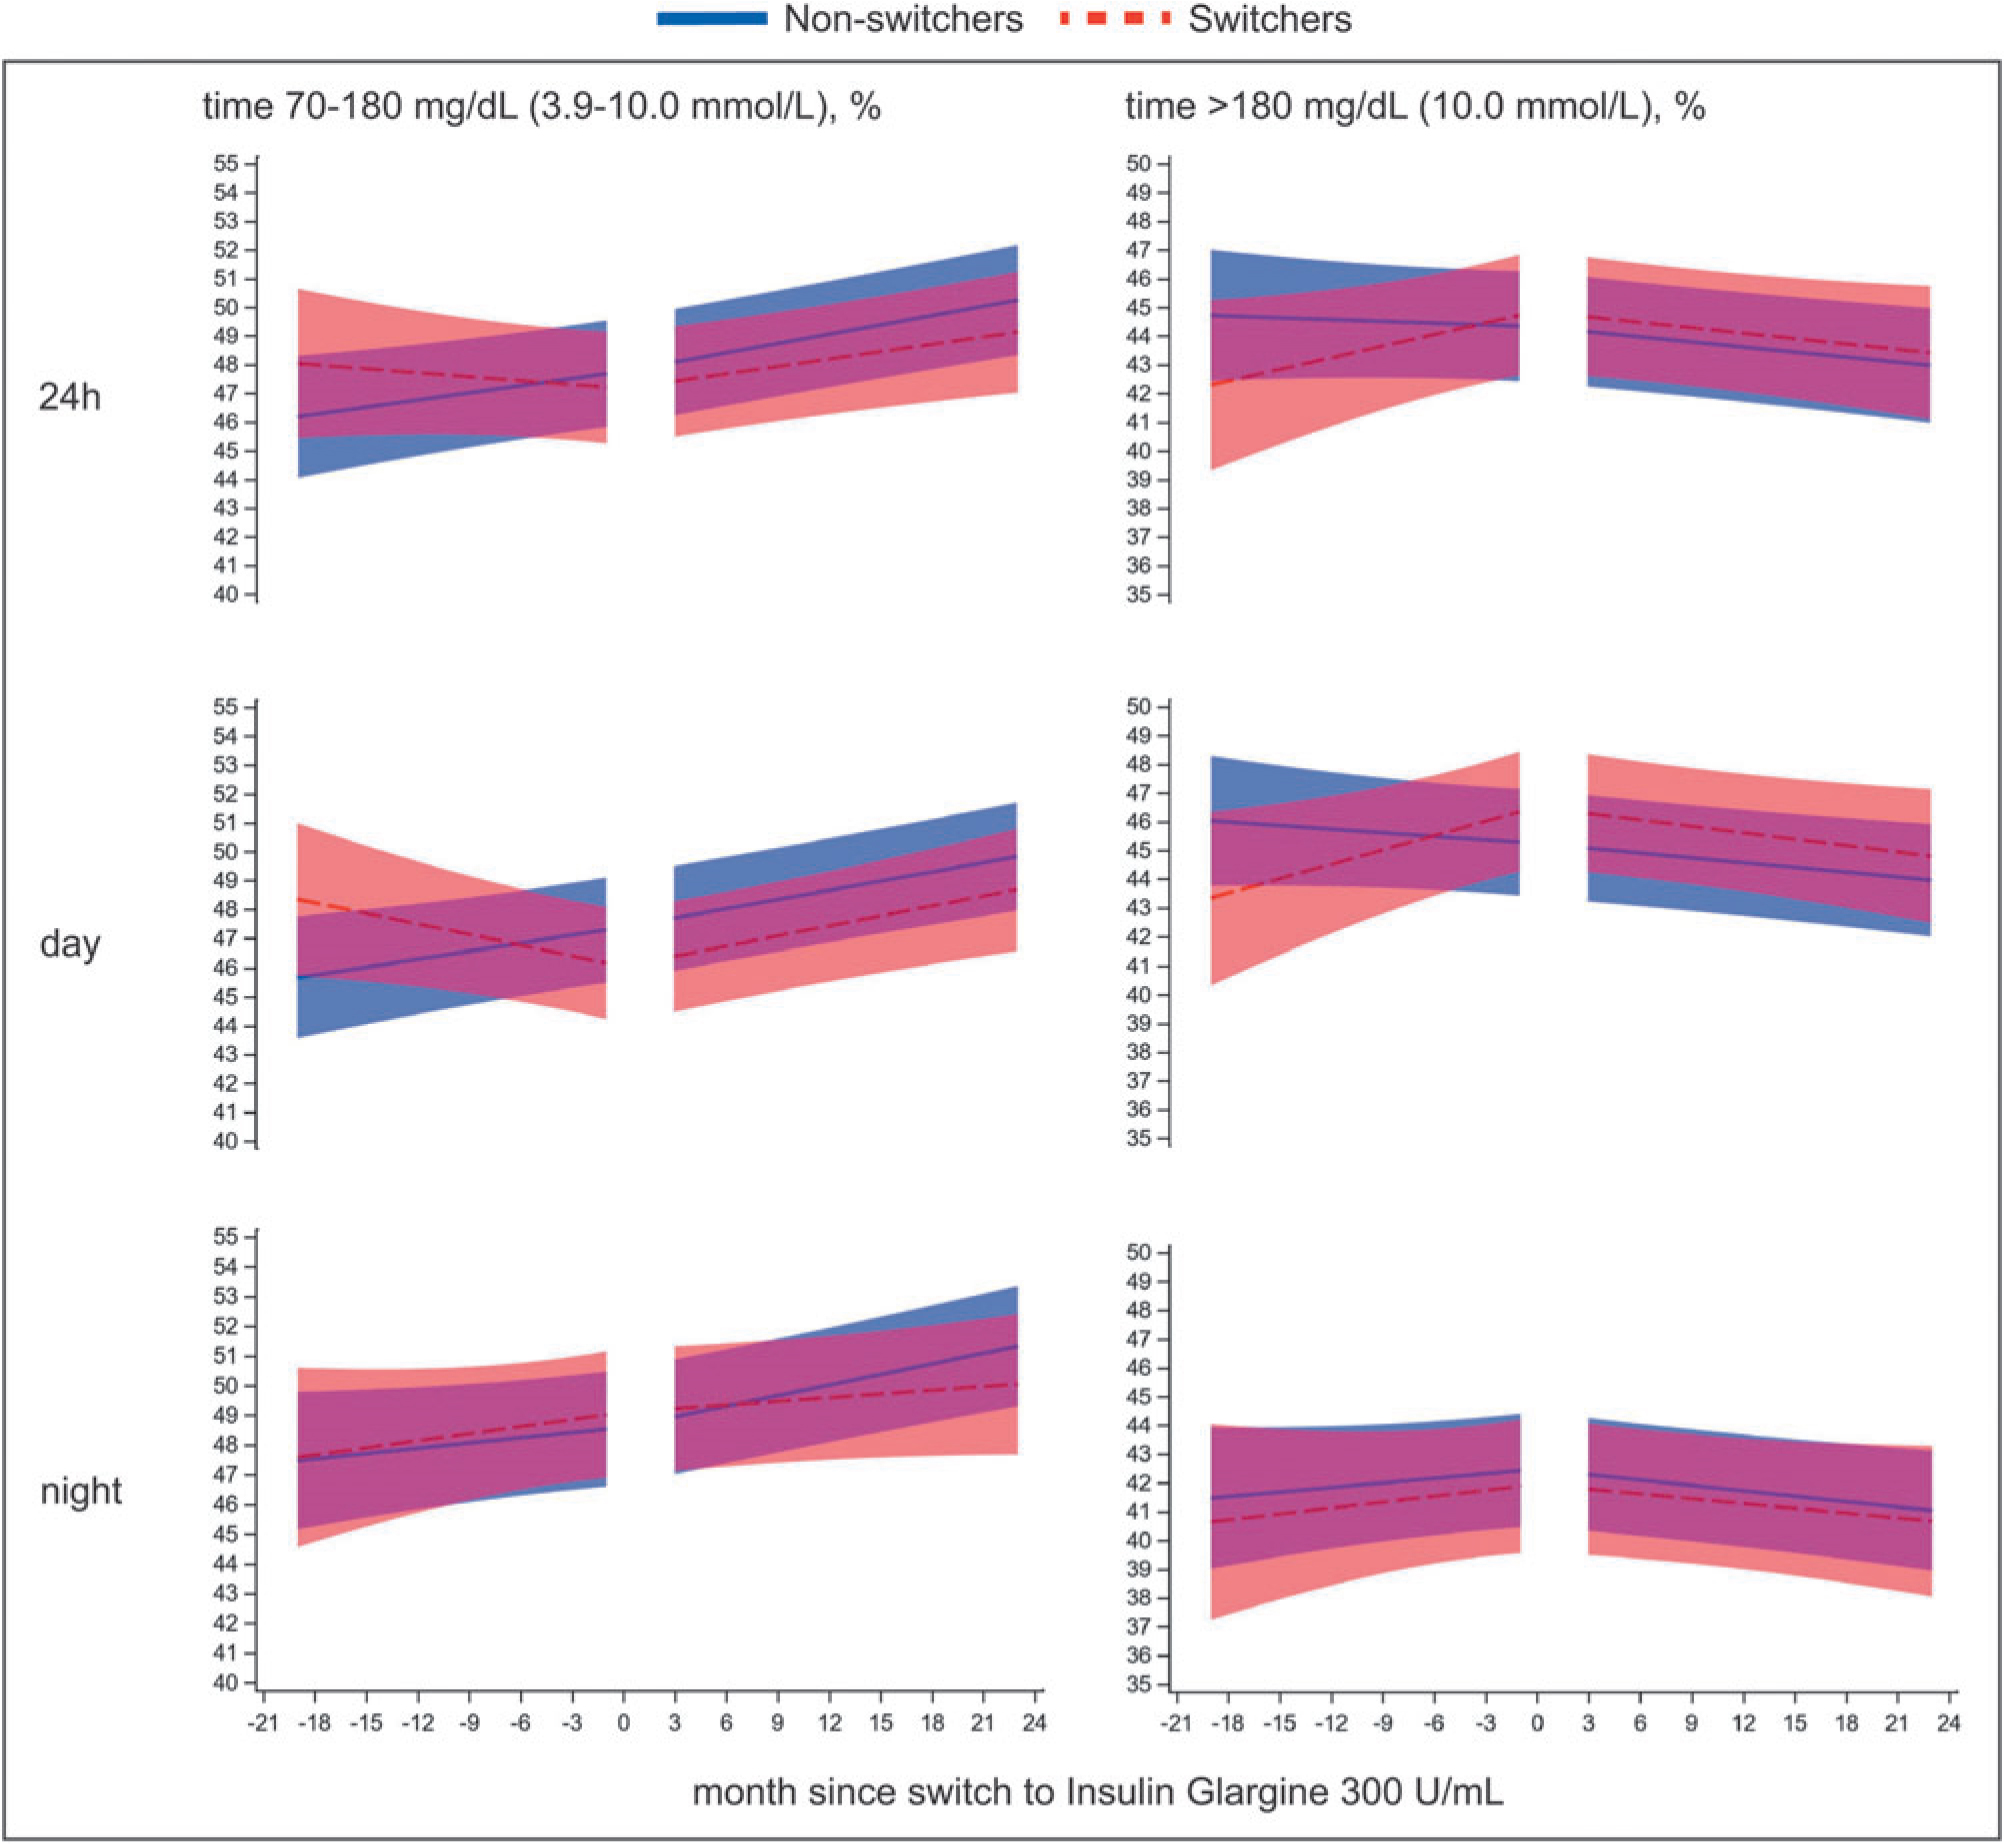
Linear evolution in time in range (70–180 mg/dL [3.9–10.0 mmol/L], left) and time above range (>180 mg/dL [10.0 mmol/L], right) before and after switch to insulin glargine 300 U/mL for Switchers (blue, continuous line) and Non-switchers (red, dashed line), divided by time of day: 24 h, day (6 am–10 pm), night (10 pm–6 am). Shaded areas refer to the 95% confidence interval for the linear slopes from the linear mixed model. The first 3 months after prescribing insulin glargine 300 U/mL have been omitted from the analysis. Non-switchers were given a hypothetical “switching” date in accordance with their matched Switchers for comparison.
Other glucose metrics and HbA1c
The observation that Gla-300-initiation reversed a negative evolution was also seen for time >180 mg/dL (10 mmol/L) (Fig. 1; Supplementary Table S5), but not for time >250 mg/dL (13.9 mmol/L) (Supplementary Table S6). Both groups showed a continuous decrease in time in hypoglycemia (Supplementary Tables S7 and S8).
There were no between nor within-group changes in HbA1c (data not shown).
Insulin dosing and BMI
Switchers had higher prescribed basal insulin doses than matched Non-switchers before (24.0 U/day [22.3 to 25.6] vs. 20.5 U/day [19.3 to 21.7]; between-group Δ3.5 U/day [1.5 to 5.5]; P = 0.0008) and after switch to Gla-300 (24.5 U/day [22.9 to 26.2] vs. 20.1 U/day [18.9 to 21.3]; between-group Δ4.5 U/day [2.4 to 6.5]; P < 0.0001).
Basal insulin dose was not different for Switchers (Δ0.5 U/day [−0.2 to 1.2]; P = 0.150), while dose decreased significantly for Non-switchers (Δ-0.4 U/day [−0.85 to −0.02]; P = 0.042) after the switch period (between-group difference in change: Δ1.0 U/day [0.1 to 1.8]; P = 0.023). However, based on dose corrected for weight, basal insulin dose increased significantly for Switchers (Δ0.012 U/[kg·d] [0.006 to 0.018]; P < 0.0001), but not for Non-switchers (P = 0.400) (between-group difference in change: Δ0.013 U/[kg·d] [0.007 to 0.020]; P = 0.0001).
Bolus insulin dose did not change significantly for both Switchers (Δ-0.2 U/day [−1.1 to 0.7]; P = 0.676) and Non-switchers (Δ-0.4 U/day [−0.9 to 0.2]; P = 0.160) after the switch period (between-group difference in change: Δ0.2 U/day [−0.9 to 1.3]; P = 0.727). Similar results were seen for bolus insulin dose in U/(kg·d) (data not shown).
BMI was not significantly different before and after switch to Gla-300 between Switchers and Non-switchers (data not shown).
Discussion
This retrospective observational study provides more insight into real-life effects of switching to Gla-300 in a heterogeneous group of people with T1D who used isCGM as part of standard of care. Glucose metrics were compared between Switchers and Non-switchers. Although mean TIR was comparable between the groups before and after switch, the linear evolution of TIR differed before switching but not after. Furthermore, basal insulin dose increased significantly for Switchers after switching when corrected for weight, while no significant differences were observed for bolus insulin dose nor BMI.
To our knowledge, this is the first real-world study to assess glucose metrics according to the TIR International Consensus Report 10 before and after Gla-300-initiation with a significant follow-up period, and where isCGM was already part of standard of care. Previous comparisons of glucose metrics between first-generation long-acting insulins, and Gla-300 were limited to blinded CGM in interventional studies. 4,11,12 Moreover, because these studies were conducted before the TIR International Consensus Report, 10 comparing outcomes across these trials should be done with caution due to considerable diversity in reported glucose metrics.
Switchers displayed a downward trend in TIR before switching to Gla-300, particularly during daytime, which reversed to an upward trend after the switch. Similarly, the trend of time >180 mg/dL (10.0 mmol/L) increased before the switch but remained stable afterward. In contrast, matched Nonswitchers showed no change in slopes before versus after the hypothetical switch. These observations suggest that the prescription of Gla-300 may have been prompted by deteriorating diabetes control before switch. Previous studies support this hypothesis, where lack of efficacy or to lower HbA1c levels led to Gla-300 prescription. 13,14 In the RESTORE-1 study, “better control” was identified as a top reason for initiating Gla-300 in individuals with T1D. 15 Notably, the comparable mean TIR values before and after switch align with the absence of HbA1c improvement.
It is widely acknowledged that hypoglycemia is often underreported and poorly recorded. 16,17 This analysis shed light on different levels of hypoglycemia by using CGM technology, showing that initiating Gla-300 showed comparable CGM-measured hypoglycemia after the switch, which is in line with other studies. 4,11,12
In Switchers, we observed that basal insulin dose increased significantly, with an average of 0.012 U/(kg·d), which is an increase of 4.5% compared to pre-switch dose. These findings align with other studies 18 and the summary of product characteristics, 19 which recommends increasing the Gla-300 dose by 10%–18% compared to the previous first-generation long-acting insulin dose. However, the increase in basal insulin dose prevents us from conclusively attributing the inversion of worsening glycemic control either to the use of Gla-300 or to the rise in basal insulin. Despite the basal dose uptitration, there was no clinically relevant increase in BMI, a critical aspect in insulin therapy, 20 which was similar for the control group and did not involve any changes in the bolus dose.
This study is not without limitations. Due to the retrospective nature, potential confounding and bias could have been introduced. First, despite our efforts to match individuals based on propensity scores for several important parameters, we noted a significant discrepancy in the prescribed insulin dose before Gla-300-initiation between Switchers (who had higher basal and bolus insulin dose) and matched Non-switchers, indicating that these two groups are not entirely comparable. Second, this study compared Gla-300 to both Gla-100 (70%) and other first-generation long-acting insulins (30%), whereas most other studies compared Gla-100 versus Gla-300. However, this could be viewed as a strength, as it better reflects distribution of insulin analogues in the real-world setting. Despite including all eligible participants from the FUTURE study, the sample size of 151 analyzable Switchers may be too small to detect significant differences in outcomes. This limitation is due to the availability of Fiasp on the Belgian market during the study, which was an exclusion criterion.
Results of this real-world retrospective propensity-score matched analysis show that use of Gla-300 provides similar efficacy and safety to first-generation long-acting insulins. In addition, Gla-300 may be a safe way to improve deteriorating glucose metrics without any rise in hypoglycemia.
Footnotes
Acknowledgments
We would like to acknowledge Dr. Thibaut Boone and Dr. Niels Bochanen for their contribution to collect the data from electronic medical files.
Authors' Contributions
S.C. designed the study, collected and analyzed the data, performed statistical analyses, wrote the manuscript, and made figures and tables. S.F. performed statistical analyses and edited the manuscript. P.G. designed the study, collected and discussed the data, and wrote the manuscript. C.D.B., N.B., F.N., and C.M. collected and discussed the data and edited the manuscript. K.M. provided feedback on the study design, discussed the data, and edited the manuscript. S.C. and P.G. are guarantors of this work and, as such, had full access to all the data in the study and take responsibility for the integrity of the data and the accuracy of the data analysis.
Author Disclosure Statement
KU Leuven has received research support for S.C. from Roche Diabetes Care, Novo Nordisk, and Sanofi. C.D.B. reports consulting fees and honoraria for speaking for Abbott, AstraZeneca, Boehringer-Ingelheim, A. Menarini Diagnostics, Eli Lilly, Medtronic, Novo Nordisk, and Roche. F.N. reports consulting fees and honoraria for speaking from Abbott, AstraZeneca, Boehringer Ingelheim, Eli Lilly, Johnson and Johnson, Medtronic, Merck Sharp and Dohme, Novo Nordisk, Roche, and Sanofi-Aventis. When this study was performed, K.M. was an employee of Sanofi-Aventis Denmark A/S. C.M. serves or has served on the advisory panel for Novo Nordisk, Sanofi, Merck Sharp and Dohme, Eli Lilly, Novartis, AstraZeneca, Boehringer Ingelheim, Roche, Medtronic, ActoBio Therapeutics, Pfizer, Imcyse, Insulet, Zealand Pharma, Avotres, Mannkind, Sandoz, and Vertex. Financial compensation for these activities has been received by KU Leuven; KU Leuven has received research support for C.M. from Medtronic, Imcyse, Novo Nordisk, Sanofi, and ActoBio Therapeutics; C.M. serves or has served on the speakers bureau for Novo Nordisk, Sanofi, Eli Lilly, Boehringer Ingelheim, Astra Zeneca, and Novartis. Financial compensation for these activities has been received by KU Leuven. P.G. serves or has served on the advisory panel for Novo Nordisk, Sanofi-Aventis, Boehringer Ingelheim, Janssen Pharmaceuticals, Roche, Medtronic, Abbott, and Bayer. Financial compensation for these activities has been received by KU Leuven. P.G. serves or has served on the speakers bureau for Merck Sharp and Dohme, Boehringer Ingelheim, Bayer, Medtronic, Insulet, Novo Nordisk, Abbott, Roche, VitalAire, and Dexcom. Financial compensation for these activities has been received by KU Leuven. KU Leuven received for P.G. non-financial support for travel from Sanofi-Aventis, A. Menarini Diagnostics, Novo Nordisk, Medtronic, and Roche. S.F. and N.B. have nothing to disclose.
Funding Information
Sanofi provided a grant for the current work, gave input to the study design, and discussed the data.
Supplementary Material
Supplementary Data S1
Supplementary Figure S1
Supplementary Table S1
Supplementary Table S2
Supplementary Table S3
Supplementary Table S4
Supplementary Table S5
Supplementary Table S6
Supplementary Table S7
Supplementary Table S8
References
Supplementary Material
Please find the following supplemental material available below.
For Open Access articles published under a Creative Commons License, all supplemental material carries the same license as the article it is associated with.
For non-Open Access articles published, all supplemental material carries a non-exclusive license, and permission requests for re-use of supplemental material or any part of supplemental material shall be sent directly to the copyright owner as specified in the copyright notice associated with the article.
