




Abstract
Background:
Few studies have evaluated the implications of the alarm thresholds of continuous glucose monitoring (CGM) systems for individuals with diabetes. The present study aimed to investigate the influence of hypoglycemia and hyperglycemia alarm thresholds on glycemic control in adults with type 1 diabetes (T1DM) and the characteristics of patients who use these alarms more frequently.
Methods:
This observational cross-sectional study included 873 users of the FreeStyle Libre 2 system (501 men, median age 48 years, range 18–90 years) with T1DM from a single center. We investigated the role of demographic and metabolic factors on the use of alarms and the impact of hypoglycemia and hyperglycemia alarms and their thresholds on glycemic control.
Results:
Alarm users were older than nonusers (median age 49 vs. 43 years, respectively; P < 0.001). The hypoglycemia alarms were set by 76.1% of women and by 69.1% of men (P = 0.022). The hypoglycemia alarms reduced hypoglycemia features and glucose variability, although at the expense of shorter time in range. The higher the hypoglycemia alarm threshold, the greater these effects. The hyperglycemia alarms were effective in reducing hyperglycemia and lowering the glucose management indicator, although at the expense of a greater tendency to hypoglycemia. The lower the hyperglycemia alarm threshold, the greater these effects.
Conclusions:
CGM alarms contribute to better glycemic control. However, hypoglycemia and hyperglycemia alarms have advantages and disadvantages. Adults with T1DM should explore, under medical supervision, which alarm thresholds will best help them achieve their individual glycemic goals.
Introduction
By measuring glucose concentrations in subcutaneous tissue, continuous glucose monitoring (CGM) systems enable individuals with diabetes mellitus to know their glucose levels. 1 There are CGM devices that continuously transmit glucose levels to the users' smartphone or receiver (real-time CGM) 2 and devices that automatically store glucose levels but only display them to the users when they scan their reader or smartphone over the CGM sensor (intermittently scanned CGM or flash CGM). 3 Scanning is therefore a nonpassive process in which the patient with diabetes takes an active interest in knowing his or her glucose levels. Recent studies have shown that a higher frequency of daily scans leads to improved glycemic control. 4
In addition to reporting glucose levels, many of these devices have alarms that can notify users in the event of hypoglycemia or hyperglycemia. 1 Flash CGM devices have only basic threshold alarms that notify users when glucose levels pass a certain threshold, while real-time devices can also have advanced alarms that provide predictive warnings when they anticipate that blood glucose is at risk of passing certain levels in the next minutes. 2
CGM devices have been in development since the early 21st century. 5 The FreeStyle Libre 1 (FSL1) CGM device was released in 20145; it was updated with a second version, FreeStyle Libre 2 (FSL2), in 2018. 5 Unlike FSL1, FSL2 has alarms for hypoglycemia and hyperglycemia. 6 To date, FreeStyle Libre devices are the only CGM flash devices available on the market 2 and are one of the most widely used CGM devices.
The use of CGM systems has been shown to improve glycemic control in individuals with type 1 diabetes (T1DM) compared with classical capillary blood glucose measurement. 7 –11 Previous studies have also shown that switching from a CGM system without alarms to a CGM system with alarms results in improved glycemic control in individuals with T1DM, especially in terms of reducing the time in hypoglycemia. 12 –15
FSL2 alarms are optional, 2 and patients can modify their hypoglycemia and hyperglycemia thresholds, given that the alarm thresholds are not fixed. 6 In the era of individualized and precision medicine, 16 it stands to reason that all individuals with T1DM can benefit from customizing their alarms. To our knowledge, there have been only two studies that have analyzed the impact of hypoglycemia and hyperglycemia alarm threshold customization on glycemic control in individuals with T1DM. 12,17 One study showed that the improvement in glycemic control when switching from FSL1 to FSL2 (thus comparing baseline FSL1 CGM metrics vs. later FSL2 CGM metrics) was similar in patients with high or low alarm threshold settings, 12 but did not compare the differences in glycemic control among FSL2 users with different alarm thresholds. Another study assessed glycemic control in users of CGM devices in relation to their alarm thresholds, finding differences in glycemic control among the groups. 17
However, this study had certain limitations that should be considered. First, no adjustments were made for other major factors affecting glycemic parameters. It was conducted with a relatively small and selected sample of patients, given that only patients with high sensor use (sensor active for more than 86% of the day) were included. Considering that higher sensor use is associated with better glycemic control 4,18 and that sensor use varies with patient age, 19 it is likely that there was an underrepresentation of patients with poor glycemic control or patients of certain age ranges.
The study 17 was conducted by categorizing the information: for instance, it compared the differences in glycemic control between patients with the hypoglycemia alarm set at a level ≥73 mg/dL and patients with the hypoglycemia alarm set to <73 mg/dL, thereby including in the same category a patient with the hypoglycemia alarm at 75 mg/dL and one with the hypoglycemia alarm set to 100 mg/dL, leading to a loss of information. Lastly, the authors did not analyze the influence of the alarm threshold on glucose variability (GV) and, as it was performed with real-time CGM devices, it could not analyze the influence of the alarm thresholds on the frequency of scans 17 (given that, as mentioned above, the scans are exclusive to flash systems).
Considering that alarms in FSL2 are optional 2 and modifiable to the patient's preference, 6 it would be informative to understand the patient traits that lead to a higher likelihood of alarm setting and the characteristics of those who modify the alarms seeking a stricter or less strict glycemic control. To our knowledge, there have been no studies that have performed such an analysis.
The aims of the present study were to evaluate the influence of hypoglycemia and hyperglycemia alarm thresholds on glycemic control in adults with T1DM and to identify the characteristics of adults with T1DM who use these alarms more frequently. This study is the first of its kind conducted with patients with CGM flash systems.
Methods
Study design and setting
This was an observational cross-sectional study performed in patients attended at the endocrinology department of a university hospital in Spain. Only users of the FSL2 system (Abbott) with a diagnosis of insulin dependent T1DM were included. A diagnosis of diabetes was defined according to the American Diabetes Association criteria. 20 T1DM was defined by evidence of pancreatic islet autoimmunity (positivity for autoantibodies to glutamic acid decarboxylase, the tyrosine phosphatase-related islet antigen 2, or zinc transporter 8) 20 and insulin requirement to achieve glycemic control goals, given that only patients with insulin dependency were selected. Therefore, individuals with stage 1 of T1DM (normoglycemia with evidence of pancreatic autoimmunity, thus no insulin requirement) 20 were excluded. Pregnant women and patients younger than 18 years were also excluded.
FSL2 is a flash CGM system marketed by Abbott in 2018. 5 Through a 14-day lifetime sensor, 5,21 the system provides accurate interstitial glucose measurements. 21 Patients can know their interstitial glucose levels by scanning their reader or smartphone over the CGM sensor, 3 which is typically worn on the upper arm 24 h a day. 22 Optional alarms are available to notify users when glucose levels pass modifiable thresholds. 2 These alarms are set by the patient, usually in consultation with their physician. A total of 8 physicians attended the 873 patients included in the study. In Asturias, the Spanish region where this study was conducted, FSL2 devices are financed by the public health system for all individuals with T1DM. At the center where the study was conducted, individuals with T1DM who are implanted with a FSL2 device receive diabetes education on the use of such devices, including information on alarm programming.
Data were recorded through LibreView, a cloud-based platform where FSL2 users voluntarily share their glucose data with health care professionals. Data were collected from August 18 to September 21, 2023; selecting the available 14-day period closest to the dates of the data collection, with a maximum of 1 year before the date of the data collection (the oldest piece of data was from August 27, 2022). For patients with sensor usage so low that the system was unable to calculate the glucose management indicator (GMI), the available 14-day period closest to the date of the data collection that allowed the GMI to be calculated was selected. Thus, the daily percentage of sensor usage time had a median of 91% and a range of 35%–100%, and daily scans had a median of 8 scans per day and a range of 1–71 scans per day.
Recent consensus for CGM in clinical trials recommends that a minimum of 70% of sensor usage should be obtained for each participant. 23 However, not to exclude individuals with specific characteristics in their glycemic control 4,18 and age, 19 the 118 individuals (13.5%) with <70% of sensor usage were not excluded from this real-life observational study, although they were considered apart in some analyses, as recommended in the aforementioned consensus. 23 For patients whose CGM data came from multiple sources (more than one reader or smartphone), the alarm thresholds of the device considered primary device by LibreView were registered. A total of 873 adults (501 [57.4%] men; median age 48 years, range 18–90 years; median duration of T1DM 21 years, range <1–68 years) met the criteria and were included in the study. A flowchart of the study is represented in Supplementary Figure S1.
Ethical issues
The study was reviewed and approved by the Research Ethics Committee of the Principality of Asturias (code 2023.376), which waived the requirement for informed consent from the study participants, in agreement with Spanish regulations for retrospective studies of clinical records.
Main determinations
The definitions of CGM-related variables and covariates included in the study are detailed as Supplementary Data S1.
Statistical analyses
According to alarm setting, the sample was divided into the following four categories: patients with no alarms set (n = 232), patients with only the hypoglycemia alarm set (n = 164), patients with only the hyperglycemia alarm set (n = 12), and patients with both the hypo- and hyperglycemia alarms set (n = 465). The groups with no alarms set and both alarms set were used as reference categories in certain statistical comparisons.
We used the chi-squared test to compare proportions (with Yates' correction, when appropriate), the Mann–Whitney test to compare numerical data between two independent groups, and the Kruskal–Wallis test for the same purpose when the number of groups was greater than two. We used Spearman's rank test to assess correlations. For regression models, different distributions were fitted to the observed distribution of the different responses using Generalized Additive Models for Location Scale and Shape (GAMLSS). GAMLSS allow for modeling not only the mean response μ (i.e., the location), but also other distribution parameters, such as standard deviation σ (i.e., the scale) or skewness and kurtosis (i.e., the shape parameters), as a function of a set of explanatory variables. 24
A reverse Gumbel distribution was considered for GMI, Box-Cox-t for GV, Poisson inverse Gaussian for the number of scans per day, Sichel for the number of hypoglycemic events, and lognormal distribution for the total duration of hypoglycemic events. Dirichlet regression models were used to analyze the percentage of time in limits (time above range [TAR], time in range [TIR], and time below range [TBR]) since these variables are proportions that lie in a bounded interval that sum up to a constant exhibiting skewness and heteroscedasticity, without having to transform the data. 25 For this analysis, TAR and TBR were not divided into smaller categories (level 1 and level 2) to ensure model stability. Covariates, including age (in years), sex, body mass index [BMI], total daily dose of insulin [TDDI] (in IU/kg/day), use of insulin pump, and alarm thresholds, were forced to enter the equation in all models.
Additional use of hyperglycemia alarms entered the equation for the analyses in relation to the hypoglycemia alarm threshold, and additional use of hypoglycemia alarms entered the equation for the analyses in relation to the hyperglycemia alarm threshold, as yes/no variables. Diabetes duration was not included in the models due to collinearity with age. All tests were two-tailed, and P-values lower than 0.05 were considered statistically significant. Statistical analyses were performed using the R statistical software environment (version 4.3.1; R Foundation,
Results
Alarm users' characteristics
Six hundred twenty-nine patients (72.0%) had the hypoglycemia alarm set. The hypoglycemia alarm threshold used ranged from 60 to 100 mg/dL, with a median and mode threshold of 70 mg/dL (Fig. 1). Four hundred seventy-seven patients (54.6%) had the hyperglycemia alarm set. The hyperglycemia alarm threshold used ranged from 130 to 400 mg/dL, with a median and mode threshold of 240 mg/dL (Fig. 1).
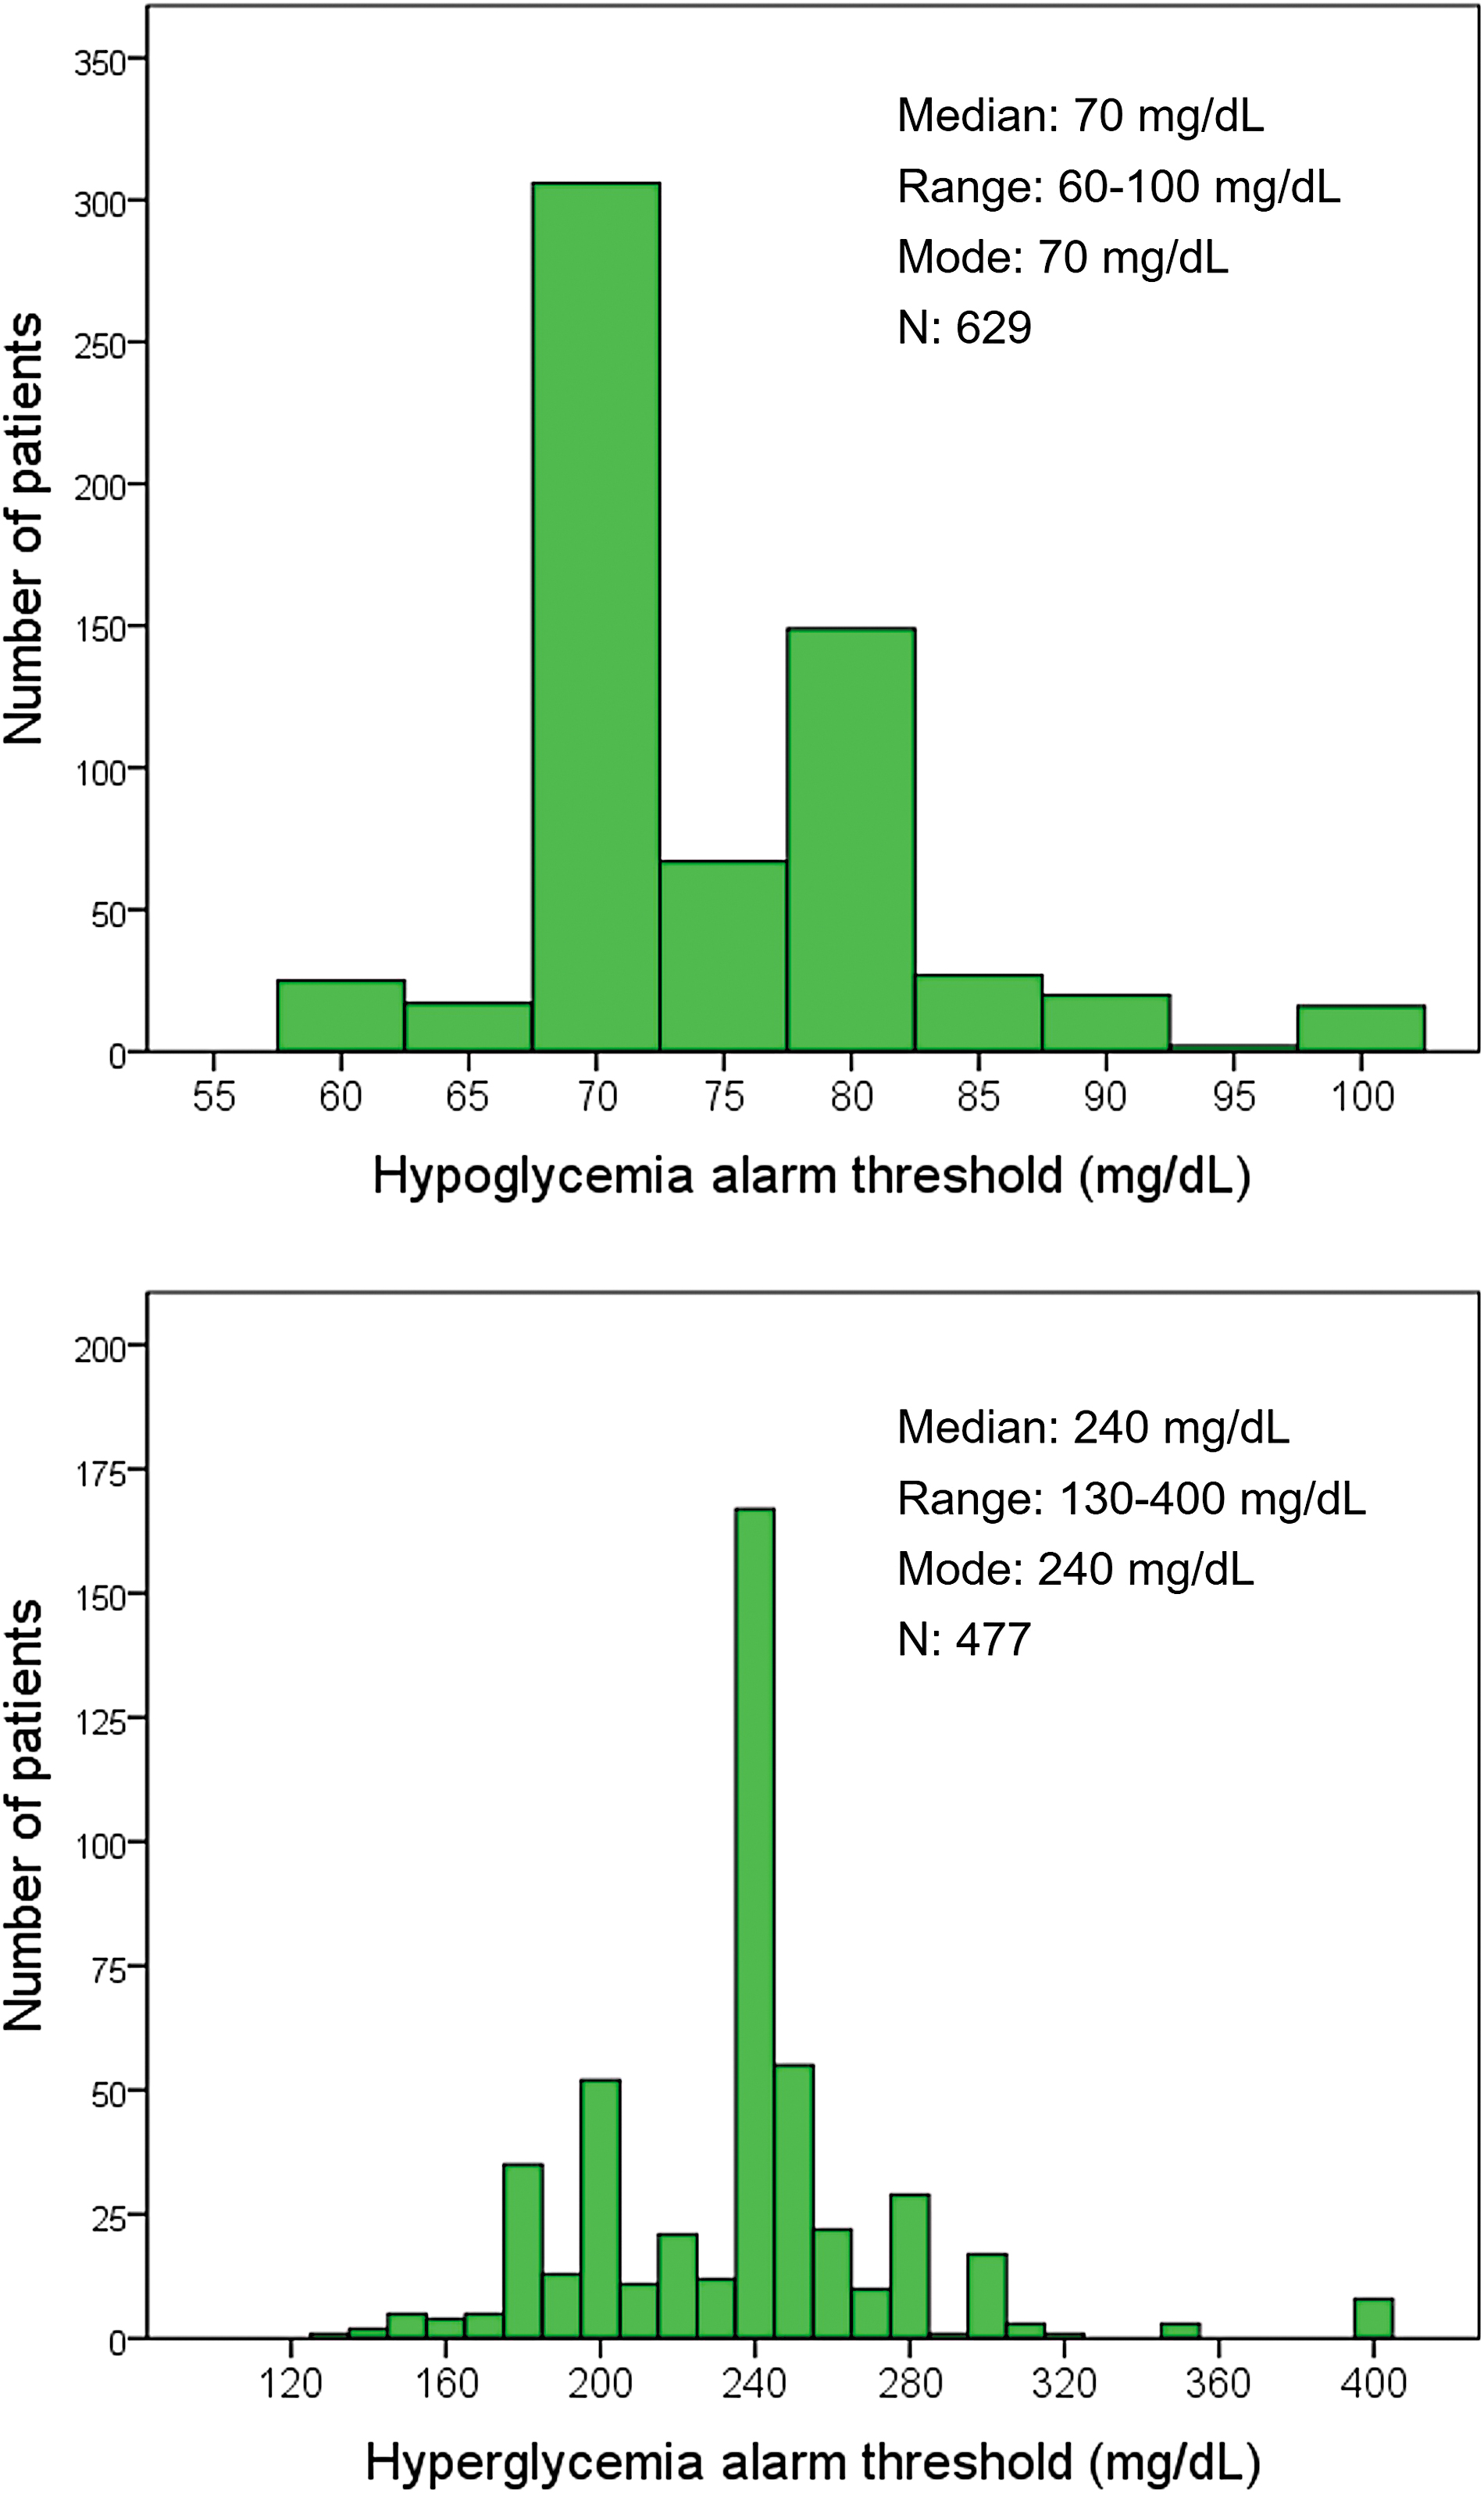
Histograms representing the distribution of hypoglycemia alarm threshold (upper panel) and hyperglycemia alarm threshold (lower panel).
Table 1 represents the characteristics of the patients in relation to the use of alarms. The use of both the hypo- and hyperglycemia alarms was greater in the older patients (Table 1). When selecting patients with hypoglycemia alarms set (n = 629), there was a directly proportional relationship between age and the hypoglycemia alarm threshold (i.e., the older the patient, the higher the glucose level at which the hypoglycemia alarm threshold was set) (Rho = 0.142, P < 0.001). Similarly, when selecting patients with hyperglycemia alarms set (n = 477), there was a directly proportional relationship between age and the hyperglycemia alarm threshold (Rho = 0.096, P = 0.036).
Use of the Alarms in Relation to the Characteristics of the Patients with Type 1 Diabetes
Data are expressed as median and interquartile range (within parentheses) or as absolute numbers and percentage (within parentheses).
P < 0.05, ** P < 0.01, *** P < 0.001 versus the reference category (No alarms). P-values were calculated with the chi-square test or the Mann–Whitney test for categorical and numerical variables, respectively.
Data available for 869 patients.
Data available for 852 patients.
BMI, body mass index; T1DM, type 1 diabetes.
Figure 2 represents the frequency of alarm use in relation to time elapsed since the diagnosis of diabetes, divided into quintiles. We observed that the use of alarms (particularly, hypoglycemia alarms) followed a U-shape: during the first 34 years of diabetes duration (quintiles 1–4), there was a progressive decrease in the use of alarms, whereas from 35 years of duration onward (quintile 5), the use of alarms increased and reached its maximum (Fig. 2).
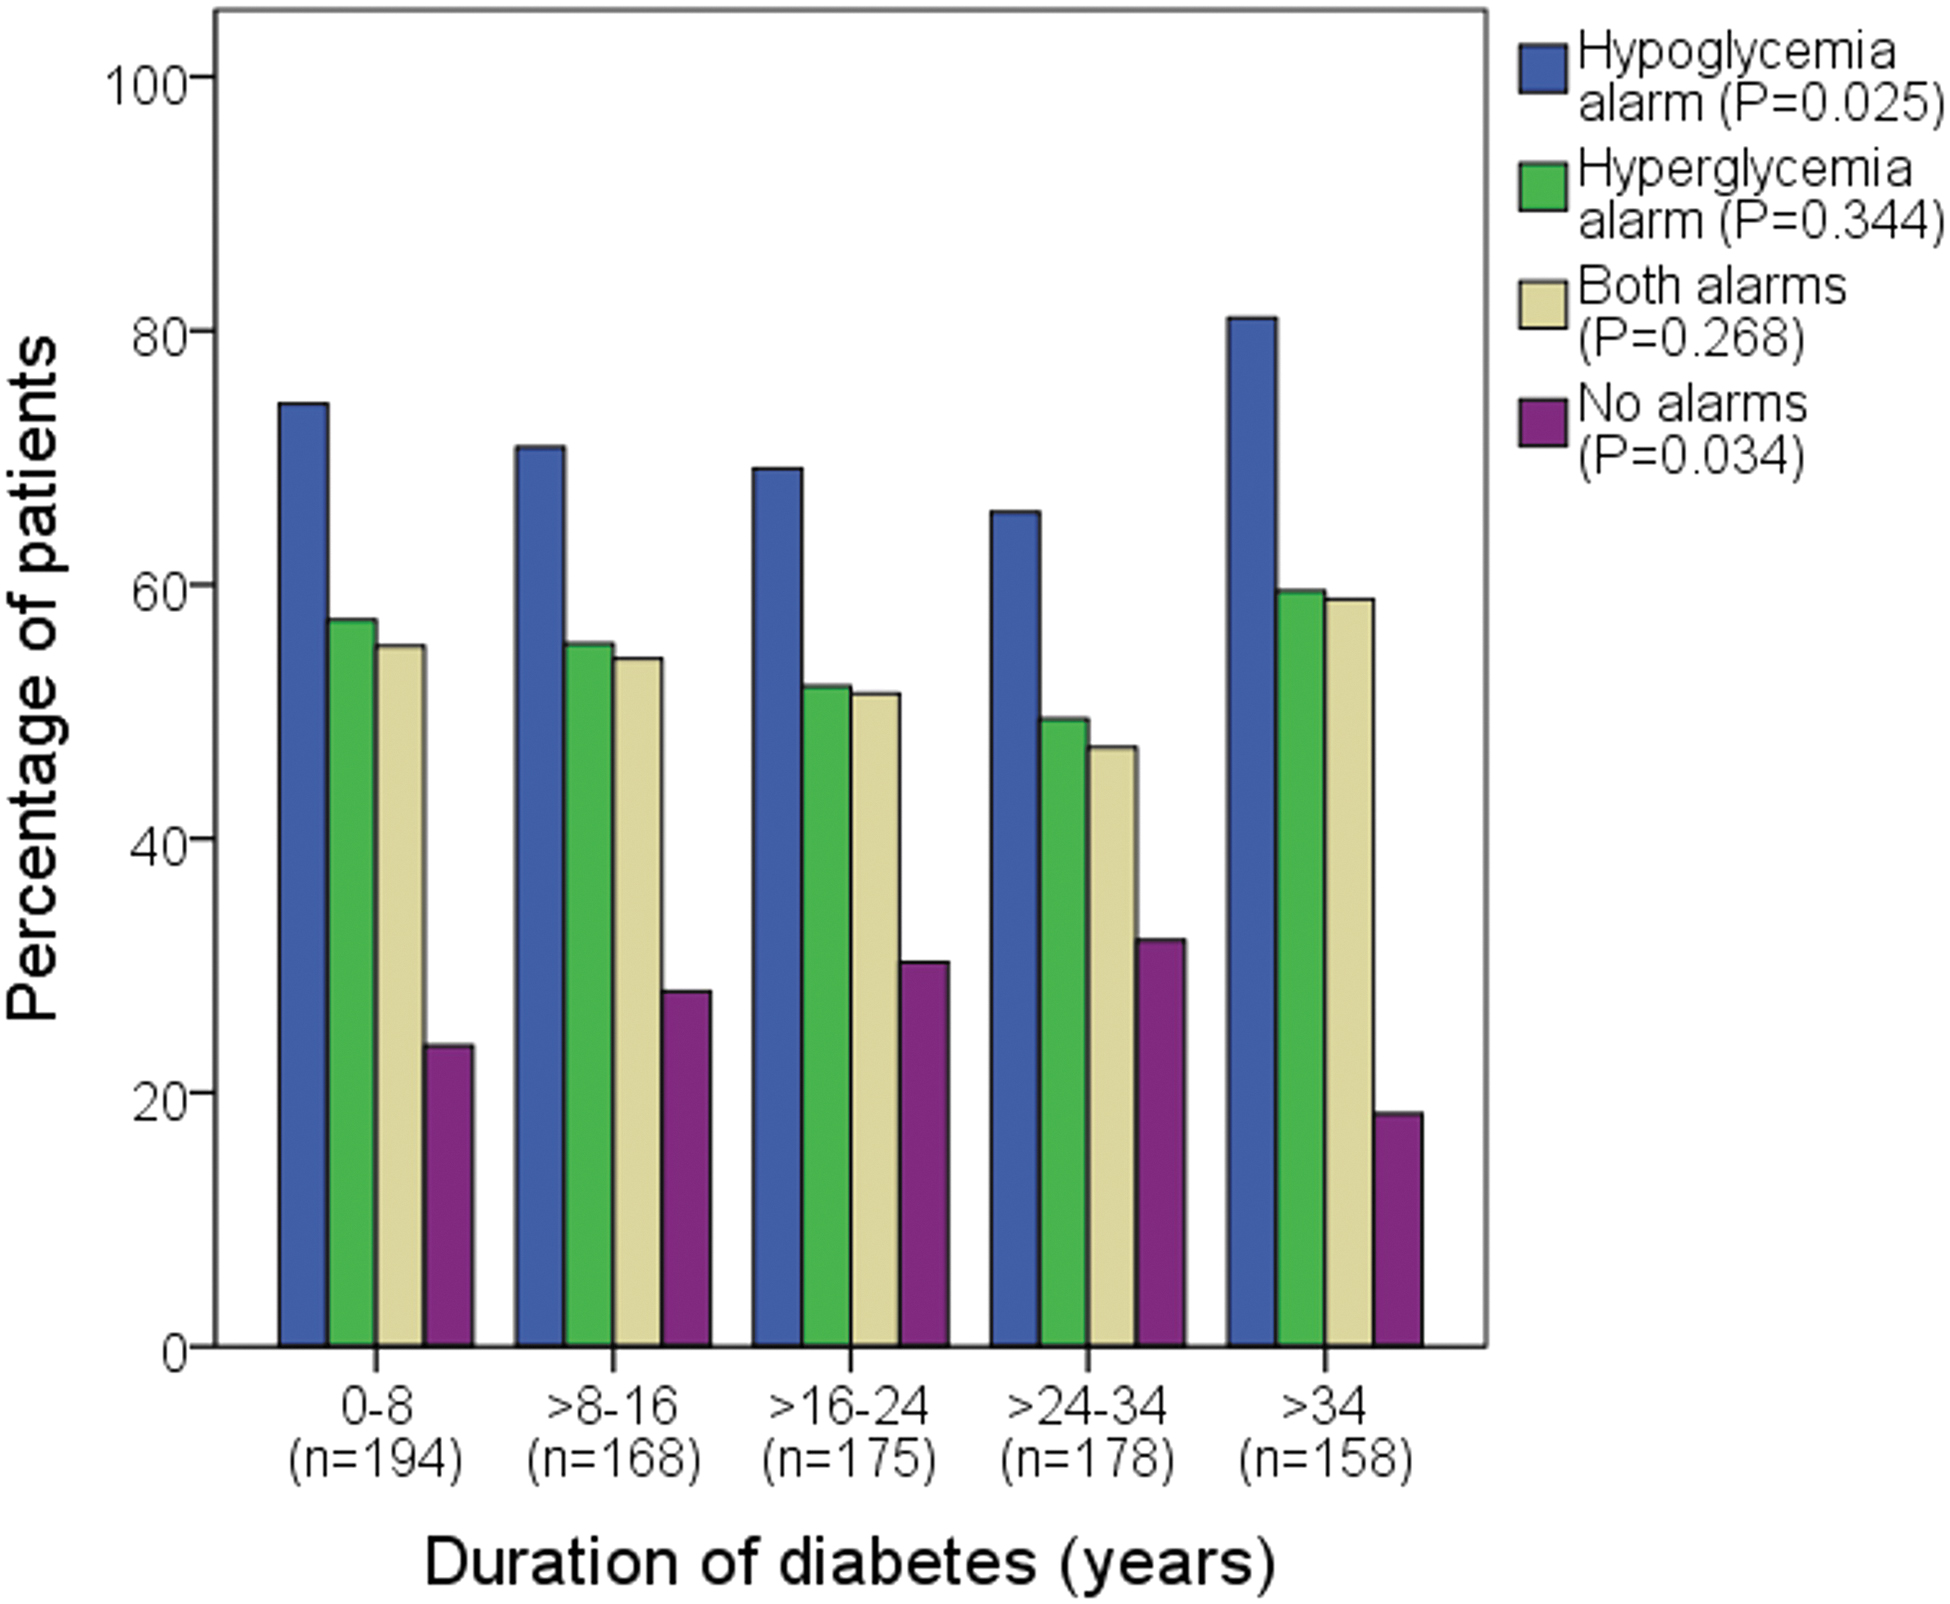
Bar graph representing the use of alarms in relation to the time of duration of T1DM. The y-axis represents the percentage of patients with each alarm(s) set. The x-axis represents the duration of diabetes in the study population divided into quintiles. Note that the categories are not mutually exclusive (the hypoglycemia alarm category includes patients with and without hyperglycemia alarm set; the hyperglycemia alarm category includes patients with and without hypoglycemia alarm set). P-values were calculated with the chi-squared test. T1DM, type 1 diabetes.
Hypoglycemia alarms were more frequently used by the women (Table 1). However, when selecting patients with hypoglycemia alarms set, there were no statistically significant differences between the hypoglycemia alarm thresholds between the women (mean threshold 74 mg/dL, range 60–100 mg/dL) and the men (mean threshold 74 mg/dL, range 60–100 mg/dL) (P = 0.346). The women were also more likely to use hyperglycemia alarms (P = 0.077 for the comparison of the group with no alarm vs. the group with the hyperglycemia alarm set).
Insulin pump users (n = 33) were a patient group with a low use of only hypoglycemia alarms and a high use of only hyperglycemia alarms (Table 1). When we selected patients with hyperglycemia alarms set, the insulin pump users tended to have lower hyperglycemia alarm thresholds (mean 224 mg/dL, range 140–400 mg/dL) than the insulin pen users (mean 237 mg/dL, range 130–400 mg/dL; P = 0.054). Insulin pump users required lower TDDI (P = 0.001; data not shown). Similarly, patients with only hyperglycemia alarms set showed lower TDDI (Table 1).
Patients who had required hospitalization for hyperglycemia in the last 5 years (n = 32) had a similar use of alarms than those who did not require hospitalization (Table 1). However, when selecting patients with hyperglycemia alarm set, the patients who required hospitalization had higher hyperglycemia alarm thresholds (mean 248 mg/dL, range 170–300 mg/dL) than those who did not (mean 236 mg/dL, range 130–400 mg/dL; P = 0.049). Similarly, patients who had required attention in an emergency department due to severe hypoglycemia during the preceding 5 years (n = 34) had a similar use of alarms than those who did not (Table 1).
However, patients with hypoglycemia alarm set who had visited an emergency department for severe hypoglycemia in the preceding 5 years had higher hypoglycemia alarm thresholds (mean 77 mg/dL, range 65–100 mg/dL) than those who did not (mean 74 mg/dL, range 60–100 mg/dL), although this association was not statistically significant (P = 0.107). There was no association between the use of alarms and the presence of advanced chronic complications of diabetes and BMI (Table 1).
Depending on the attending endocrinologist physician, hypoglycemia alarm setting ranged from 66.7% to 84.7% of patients, and hyperglycemia alarm setting ranged from 48.6% to 65.9% of patients. Among patients who had the hypoglycemia alarm set, the mean hypoglycemia alarm threshold ranged from 73 to 76 mg/dL depending on the attending physician. Among patients who had the hyperglycemia alarm set, the mean hyperglycemia alarm threshold ranged from 229 to 242 mg/dL depending on the attending physician. The characteristics of the patients attended by each endocrinologist were not completely uniform, especially regarding insulin pump treatment (Supplementary Table S1).
Comparisons Among the Groups with Different Alarm Settings
Comparisons versus the group with no alarms
Table 2 represents CGM parameters in relation to which alarms are set in all study participants (n = 873). The group with only the hypoglycemia alarm had less hypoglycemia features (shorter time below range level 1 [TBR1], shorter time below range level 2 [TBR2], fewer hypoglycemic events, and shorter duration of hypoglycemia) and less GV than the group with no alarms (Table 2). Time above range level 1 (TAR1) was, however, greater in the group with only the hypoglycemia alarm set, implying a higher GMI. There were no significant differences in TIR between these two groups (Table 2).
Continuous Glucose Monitoring Parameters in Relation to Which Alarms Are Set
Data are expressed as mean and standard deviation (within parentheses).
There were significant (P < 0.01) differences among groups for all variables (Kruskal–Wallis test).
Data available for 766 patients, as only patients with at least one hypoglycemic event were selected (duration of hypoglycemia is considered 0 min in those with no hypoglycemic events).
P < 0.05, b P < 0.01, c P < 0.001 versus the “No alarms” category (Mann–Whitney test).
P < 0.05, e P < 0.01, f P < 0.001 versus the “Hypo- and hyperglycemia alarms” category (Mann–Whitney test).
GMI, glucose management indicator; GV, glucose variability; TAR1, time above range level 1; TAR2, time above range level 2; TBR1, time below range level 1; TBR2, time below range level 2; TIR, time in range.
The group with only the hyperglycemia alarm had less hyperglycemia features (shorter TAR1 and time above range level 2 [TAR2]) and longer TIR, and therefore a lower GMI, than the group with no alarms (Table 2). There were no significant differences in GV and hypoglycemia features between the two groups (Table 2).
The group with both the hypo- and hyperglycemia alarms had a better overall glycemic control: shorter TBR1 and TBR2 (with fewer and shorter hypoglycemic events); longer TIR; less GV; and a trend to shorter TAR2 (P = 0.054) than the group with no alarms (Table 2). There were no significant differences in the GMI between these two groups (Table 2).
The patients of any of these three groups (only hypoglycemia alarm, only hyperglycemia alarm, and both alarms) performed more daily scans that the group with no alarms (Table 2).
Comparisons versus the group with both the hypo- and hyperglycemia alarms
The group with only the hypoglycemia alarm was only superior to the group with both the hypo- and hyperglycemia alarms in terms of avoiding hypoglycemia: shorter TBR1, fewer hypoglycemic events (which had a similar duration in the two groups), and a trend to shorter TBR2 (P = 0.055) (Table 2). There were no differences in GV between these two groups. The rest of the glycemic control parameters were better in the group with both alarms: shorter TAR1 and TAR2, longer TIR, and lower GMI. The group with both alarms had more scans per day (Table 2).
The group with only the hyperglycemia alarm had shorter TAR1, shorter TAR2, and longer TIR (and therefore lower GMI) than the group with both the hypo- and hyperglycemia alarms (Table 2). The group with only the hyperglycemia alarm tended to have longer TBR1 (P = 0.060) and had longer hypoglycemic events. There were no significant differences in GV and scans per day between these two groups (Table 2).
Subanalysis in patients with sensor usage ≥70%
A comparison between participants with a low percentage of recorded CGM time (sensor usage <70%, n = 118) and those with a recorded time ≥70% (n = 755) is depicted in Supplementary Table S2. Patients with sensor usage <70% were younger, had higher TDDI, had worse glycemic control, and used alarms less frequently than patients with sensor usage ≥70%. However, both the hyperglycemia and hypoglycemia alarm thresholds were similar in both groups (Supplementary Table S2). Supplementary Table S3 represents CGM parameters in relation to which alarms are set in the subset of participants with sensor usage ≥70% (n = 755), showing that the results are entirely similar to those observed in the whole sample (Table 2).
Relationship Between Alarm Thresholds and Glycemic Control Parameters
Table 3 represents the association (regression models) between alarm thresholds and glycemic control parameters, after adjusting for additional covariates that could influence glycemic control (age, sex, BMI, TDDI, and use of an insulin pump). The unadjusted correlations between alarm thresholds and glycemic control parameters are further represented in Supplementary Table S4.
Multivariate Analysis of Factors Associated with Continuous Glucose Monitoring Parameters (Regression Models)
Data are regression coefficients (slopes, i.e., the degree of change in the dependent variable per unit of increase in the covariate) and standard error (within parentheses). All listed covariates entered the equations. A reverse Gumbel distribution was considered for GMI, Box-Cox-t for glucose variability, Poisson inverse Gaussian for the number of scans per day, Sichel for the number of hypoglycemic events, lognormal distribution for the total duration of hypoglycemic events, and Dirichlet regression models were used to analyze the percentage of time in limits. The models included only patients with available data for all listed covariates.
Only patients with at least one hypoglycemic event were included (n = 540).
Only patients with at least one hypoglycemic event were included (n = 416).
P < 0.001; ** P < 0.01; * P < 0.05.
For those patients with hypoglycemia alarms set, the higher the hypoglycemia alarm threshold was set (i.e., the further from the hypoglycemic range), the less intense hypoglycemia features (shorter TBR and fewer hypoglycemic events, although with no statistically significant differences in terms of duration), the shorter TIR (and, therefore, the greater GMI), and the less GV. Higher hypoglycemia alarm thresholds were associated with more scans per day after adjusting for confounders. The hypoglycemia alarm threshold setting did not have a statistically significant relationship with TAR. In these patients with hypoglycemia alarms set, the additional hyperglycemia alarm setting was associated with lower GMI, higher GV, more scans per day, longer TIR, longer TBR, and higher number of hypoglycemic events (Table 3).
For those patients with hyperglycemia alarms set, the lower the hyperglycemia alarm threshold was set (i.e., the further from the hyperglycemic range), the greater TBR and lower TAR, although these associations were not statistically significant (P = 0.085 and P = 0.058, respectively). Likewise, the lower the hyperglycemia alarm threshold was set, the lower the GMI and the higher the number of hypoglycemic events. In univariate correlation (Supplementary Table S4), lower hyperglycemia alarm thresholds were associated with more scans per day. However, this association became not significant after adjusting for covariates in the regression model (Table 3). The hyperglycemia alarm threshold had no statistically significant impact on GV and TIR. In these patients with hyperglycemia alarms set, the additional hypoglycemia alarm setting was associated with the higher GMI and shorter duration of hypoglycemic events (Table 3).
Regarding additional covariates included in the multiple regression models, those with the strongest association with glycemic control were TDDI (patients with lower TDDI had better overall glycemic control) and age (patients with older age had less hypoglycemia features and less GV). Patients who performed more scans per day had lower TDDI, older age, and lower BMI. Taken together, the regression models moderately explained the variability in the effects (R-squared 0.011–0.126).
Discussion
Our study found significant differences in the use of FSL2 alarms according to the characteristics of the adults with T1DM, which have not been previously studied. The older patients were more likely to use alarms than the younger patients. Despite the popular belief that younger people are more technologically savvy, studies have shown that older individuals are increasingly embracing technology. 26 The greater use of hypoglycemia alarms by older adults could be due to the increased risk of hypoglycemia unawareness in older adult patients, 27 caused by autonomic nervous system failure due to recurrent hypoglycemia throughout their lives, 28 leading to an almost doubled risk of severe hypoglycemia. 29 Older patients not only use hypoglycemia alarms more frequently, but also set the hypoglycemia alarm threshold at higher glucose levels, presumably to have more time to react in the face of hypoglycemia.
Older patients also use hyperglycemia alarms more frequently but also set the hyperglycemia alarm threshold at higher glucose levels, which would be consistent with the recommendations to relax glycemic control in older adults, 30 thus tolerating mild hyperglycemia in this patient group. 31 We also observed a lower use of alarms, especially hypoglycemia alarms, in the patients with 8–34 years of diabetes duration compared with the patients who have had T1DM for shorter and longer durations. Patients who have had diabetes for a short period are probably more motivated to control the disease due to the disease's recent diagnosis and are therefore frequent users of alarms, while patients who have had diabetes for a long period might use alarms with high frequency for the same reasons as older patients (there was a positive correlation between age and duration of diabetes; data not shown), leaving the intermediate duration patients with the lowest alarm use.
The women also demonstrated greater use of hypoglycemia alarms, possibly due to a greater fear of hypoglycemia (FOH) in women than in men, which has been found in previous studies in individuals with T1DM. 32 The patients who required hospitalization for hyperglycemia in the last 5 years had a higher hyperglycemia alarm threshold than the patients who did not require hospitalization. As expected, the patients who required hospitalization for hyperglycemia comprised a group with particularly poor chronic glycemic control compared with those who did not require hospitalization (data not shown). These patients were therefore likely accustomed to higher hyperglycemia and thus maintained a higher hyperglycemia alarm threshold, despite the shock of recent hospitalization.
Conversely, the users of open-loop insulin pumps tended to have better glycemic control than the users of insulin pens (data not shown) and also tended to use lower hyperglycemia alarm thresholds. The shock of an emergency department visit for severe hypoglycemia in the preceding 5 years may have made patients tend to set the hypoglycemia alarm threshold higher.
We divided the sample into four groups according to the setting of the alarms (no alarms set, only the hypoglycemia alarm set, only the hyperglycemia alarm set, and both alarms set) and compared them, using “no alarms” and “both alarms set” as the reference categories. In general, the group with no alarms had the worst glycemic control, which was expected given the results of previous studies that showed improved glycemic control when switching from a system with no alarms to one with alarms. 12 –15 The patients with both alarms set had better overall glycemic control (less intense hypoglycemia features, longer TIR, and less GV). Compared with this better-controlled group, the patients with only hypoglycemia alarm had less intense hypoglycemia features (at the expense of shorter TIR), and the patients with only hyperglycemia alarm had less intense hyperglycemia features (at the expense of a longer hypoglycemia duration).
Lastly, our study analyzed the correlation between the hypoglycemia/hyperglycemia alarm thresholds on glycemic control in adults with T1DM, which only one study has performed to date, 17 with the aforementioned limitations. The authors observed a shorter TBR, shorter TIR, and higher mean glucose level (a parameter essentially identical to GMI) in patients with a hypoglycemia alarm threshold ≥73 mg/dL, and a shorter time in hyperglycemia in the patients with a hyperglycemia alarm threshold ≤205 mg/dL. 17 Our study confirmed these findings and provided a deeper insight by providing uncategorized information, showing statistically significant associations between alarm thresholds and the aforementioned CGM parameters that were still present after adjusting for confounders.
In terms of additional findings, our study showed a higher frequency of hypoglycemic events in those patients with low hyperglycemia alarm thresholds, and studied the impact of these alarms on GV and on the number of scans per day, which had never been analyzed before, to the best of our knowledge. Our results showed that the setting of hypo- and hyperglycemia alarms lead to a higher number of scans per day. The alarm whose setting resulted in a greater decrease in GV was the hypoglycemia alarm. Hypoglycemia is often corrected by carbohydrate intake, leading to posthypoglycemic hyperglycemia, 33 thereby resulting in two glycemic peaks (initial hypoglycemic and later hyperglycemic) that can significantly increase GV. Perhaps for this reason, the hypoglycemia alarms, which were shown to be effective in reducing hypoglycemia, also showed a greater reduction in GV than hyperglycemia alarms.
Although our study did not analyze the association between FOH and hypoglycemia alarms setting, previous studies have shown that the use of hypoglycemia alarms contributes to a reduction in FOH, 15 which is an underestimated problem in individuals with diabetes. 34 Therefore, it could be deduced that patients with FOH might frequently use hypoglycemia alarms, possibly with elevated alarm thresholds. Our results show that this intervention could help reduce hypoglycemia features, but at the risk of decreasing TIR and increasing the GMI. Conversely, patients with low thresholds for hyperglycemia alarms can achieve a lower GMI, but they can also be at risk for a higher number of hypoglycemic events. These results reflect that both hypo- and hyperglycemia alarms have certain disadvantages. Thus, the setting of alarms should always be done under medical supervision.
Our study has limitations that should be acknowledged. Temporal ambiguity is inherent to the cross-sectional study design and is a limitation in the inference of causality. It is possible that alarm users had better glycemic control before using FSL2 devices (e.g., due to higher levels of diabetes education or engagement in self-care), making the use of alarms a confounding factor. Alarm setting might be a consensual process between the patient and his/her endocrinologist, and not always an independent decision by the patient. The endocrinologist will generally recommend a form of alarm setting that is appropriate to each patient and could explain part of the variability observed in the characteristics of the individuals with each type of alarm. Some patients might have used more than one device (reader or smartphone).
In these cases, alarms were recorded for the device where LibreView was the primary device, but secondary (less used) devices may have had different alarm thresholds. We did not analyze the influence of the alarms on plasma HbA1c because we could not guarantee that the setting of the alarms during the 90–120-day period that the HbA1c evaluates 35 was the same as during the 15 study days. Nevertheless, a previous study performed in our center showed a strong positive correlation (correlation coefficient, 0.719) between GMI and HbA1c in individuals with T1DM. 36 Recent consensus for clinical trials using CGM recommends that a minimum of 70% of the glucose data should be obtained for each participant during the 14-day period. 23
However, the same consensus recommends that all CGM data should be included in the final analysis, but the proportion of participants who met the minimum 70% data-obtainment requirement for 14 days should be also reported as part of the data completeness. 23 Accordingly, this real-life study included data from all participants, although cases with data recorded ≥70% of the time were considered separately in some analyses. The exclusion of patients with low sensor usage did not appreciably modify the main results, although this is a group with specific characteristics (younger age, worse glycemic control, and less use of alarms), as previously reported. 4,18,19 In any case, these differential variables with the group of patients with sensor usage ≥70% were included in the multivariate analyses.
Retrospective studies such as ours have advantages and drawbacks, particularly regarding data gathering, 37 but it should be considered that the CGM data are systematically collected with the same standard and properly calibrated device.
Conclusions
The present results could have practical clinical implications. CGM alarms contribute to better glycemic control. Hypo- and hyperglycemia alarms have been shown to have their advantages and disadvantages. Exclusive setting of hypoglycemia alarms (especially with elevated alarm thresholds) can be an appropriate option for patients whose primary glycemic goal is to avoid hypoglycemia and reduce GV, regardless of tolerating a certain degree of mild hyperglycemia, as might be the case for older patients. 30,31 Enabling hyperglycemia alarms is useful for patients seeking tighter glycemic control, but with the understanding that a low hyperglycemia alarm threshold has a higher risk of hypoglycemia. The use of alarms involves a greater number of readings per day, which can contribute to better glycemic control, 4 but also risks alarm fatigue in users. 38
Future studies are needed to evaluate the impact of thresholds from more modern forms of alarms, such as the predictive alarms of real-time CGM devices. 2 In the era of personalized medicine, 16 adults with T1DM should evaluate, under appropriate medical supervision, which alarms, and which alarm thresholds will best help them achieve their glycemic control goals.
Footnotes
Acknowledgments
The authors wish to thank all the endocrinology specialists who attended to these patients, and Prof. Francisco Gude (University of Santiago de Compostela, Spain) for the statistical analyses.
Authors' Contributions
T.G.-V.: conceptualization (lead), methodology (lead), formal analysis (lead), investigation (equal), data curation (lead), writing—original draft (lead), visualization (lead), and supervision (equal). D.R.-O.: investigation (equal). P.A.-C.: investigation (equal). G.R.-R.: investigation (equal). E.D.: supervision (equal) and writing—review (equal). E.M.-T.: supervision (equal) and writing—review (equal).
Author Disclosure Statement
No competing financial interests exist.
Funding Information
No funding was received for this article.
Supplementary Material
Supplementary Data S1
Supplementary Figure S1
Supplementary Table S1
Supplementary Table S2
Supplementary Table S3
Supplementary Table S4
References
Supplementary Material
Please find the following supplemental material available below.
For Open Access articles published under a Creative Commons License, all supplemental material carries the same license as the article it is associated with.
For non-Open Access articles published, all supplemental material carries a non-exclusive license, and permission requests for re-use of supplemental material or any part of supplemental material shall be sent directly to the copyright owner as specified in the copyright notice associated with the article.
