




Abstract
Aims:
Diabetic ketoacidosis (DKA) is a serious life-threatening condition caused by a lack of insulin, which leads to elevated plasma glucose and metabolic acidosis. Early identification of developing DKA is important to start treatment and minimize complications and risk of death. The aim of the present study is to develop and test prediction model(s) that gives an alarm about their risk of developing elevated ketone bodies during hyperglycemia.
Methods:
We analyzed data from 138 type 1 diabetes patients with measurements of ketone bodies and continuous glucose monitoring (CGM) data from over 30,000 days of wear time. We utilized a supervised binary classification machine learning approach to identify elevated levels of ketone bodies (≥0.6 mmol/L). Data material was randomly divided at patient level in 70%/30% (training/test) dataset. Logistic regression (LR) and random forest (RF) classifier were compared.
Results:
Among included patients, 913 ketone samples were eligible for modeling, including 273 event samples with ketone levels ≥0.6 mmol/L. An area under the receiver operating characteristic curve from the RF classifier was 0.836 (confidence interval [CI] 90%, 0.783–0.886) and 0.710 (CI 90%, 0.646–0.77) for the LR classifier.
Conclusions:
The novel approach for identifying elevated ketone levels in patients with type 1 diabetes utilized in this study indicates that CGM could be a valuable resource for the early prediction of patients at risk of developing DKA. Future studies are needed to validate the results.
Introduction
Diabetic ketoacidosis (DKA) is a serious life-threatening problem caused by a lack of insulin, which leads to elevated plasma glucose, metabolic acidosis, and ketones in the serum or the urine. 1 –4 The clinical symptoms of DKA are normally polyuria, polydipsia, polyphagia, weight loss, vomiting, abdominal pain, and fatigue. 1 DKA occurs among both type 1 and type 2 diabetes, however, most often it occurs among children or adolescents with type 1 diabetes. 1,4 Even though, the mortality rate of single DKA is only 5.2%, a recurrent attack is around 23.4%. 2,5 From literature, it is known that too late treatment leads to severe complications for example, edema in the brain. 6 Thus, there is a need of investigating the potential in early detection of DKA among this group of patients, who potentially could avoid DKA to occur. 1,7 –9
The etiology of DKA is related to insulin requirement and the precipitating factors are omission of insulin; intercurrent illness; drugs that affect carbohydrate metabolism; mechanical problems with continuous subcutaneous insulin infusion devices, and damaged insulin. 10
For many years, continuous glucose monitoring (CGM) has been used by patients with type 1 diabetes to learn about their blood glucose level and thus learn to live with diabetes. 11 In fact, several studies demonstrate how the use of CGM has shown better glycemic results and significant improvement in the level of HbA1c. 11 –14 Literature shows that having knowledge and insight into ones' own blood glucose level contribute to a better management of the diabetes. 15 –17 Furthermore, CGM allows professionals to track patients' blood glucose levels over time and guide patients the best ways to avoid DKA. 12
Prediction models have been used in many health care research areas and practices and have contributed to predict whether an event will happen, and likewise, predict an event before it happens. 18,19 A health care research area where prediction models have gained large profit is within the area of chronic obstructive pulmonary disease. 20 Literature shows how it is now possible to predict an exacerbation before the exacerbation occurs, and hence the patient will receive information about the future event if he/she does not act, for example, take antibiotics to avoid the exacerbation. 21 –23 Similar prediction models are available within the area of DKA, for example, mortality prediction models. 24,25
Also, there has been conducted studies within DKA, which investigated different predictors for adverse outcome in DKA. 7,26 –28 For instance, a study published by Li et al. 2021 tested several predictors from the electronic health record for example, HbA1c, BMI, height, white blood cell count, pulse rate, respiratory rate, oxygen, and so on. Li et al. did not, however, investigate the potential in using CGM as a predictor for developing DKA. 28
The development of a prediction model based on CGM values, capable of issuing an alert indicating the imminent risk of DKA if insulin is not administered, would be a valuable approach to reduce the onset of DKA. Thus, the aim of the present study is to develop and test a prediction model for the risk of elevated ketone bodies during hyperglycemia.
Materials and Methods
Study data
To investigate whether patterns from CGM could help identify elevated ketone bodies as a risk factor for DKA in patients with diabetes, data from The International Diabetes Closed 1 Loop (iDCL) trial: Clinical Acceptance of the Artificial Pancreas 29 were analyzed. Their study was a multicenter randomized controlled trial of the at-home closed-loop system versus the standard of care.
The study 29 included patient with type 1 diabetes aged 14–71. The patients used the Dexcom G6 CGM system and a t:slim X2 with Control-IQ (intervention group) for 6 months. The patients were also equipped with a blood ketone meter and test strips and were instructed to measure ketone levels if glucose readings were >300 mg/dL. The study included 168 patients with type 1 diabetes, HbA1c 7.4 (1.0) % (9.2 mmol/L), with an average age of 33 (16) years, 54% were female, and median duration of diabetes of 17(8–28) years.
For this analysis, inclusion criteria were patients with ketone measurements and associated CGM data in a period for 4 h before the ketone measurements. The CGM periods needed to have ≥70% wear time. The CGM system had a sample rate of 12/h, so inclusion required ≥34 glucose samples in the 4-h window.
This study adheres to the advised standards defined by the “Transparent Reporting of a Multivariable Prediction Model for Individual Prognosis or Diagnosis” (TRIPOD). 30
Model development
We utilized a supervised binary classification machine learning approach to identify elevated levels of ketone bodies. 31 –33 Ketone levels <0.6 mmol/L are in the normal range and ≥0.6 mmol/L increases the risk of DKA significantly. 34 We defined the binary classification problem as an increased/nonincreased risk (ketone bodies ≥0.6 mmol/L; ketone bodies <0.6 mmol/L) during high-glucose reading. Features from a fixed period of 4 h before the ketone measurement were used to predict increased ketone bodies. Data material was then randomly divided at patient level: 70% was used for training the models and 30% was used for testing the final models. This process ensured that cases from a specific patient were exclusively assigned to either the training or test datasets, and the results were not prone to in-sample overfitting, allowing for better transferability to a similar cohort. 35 Figure 1 illustrates the method.

Illustrates the model development. For each patient, a window with CGM readings was extracted before each ketone measurement. Eligible samples were defined as ketone measurements with a window containing ≥ data completion of CGM samples. Binary sample classes were defined as ketone measurements with a level ≥0.6 mmol/L (class = 1, otherwise class = 0). For each eligible sample, features were extracted from the window of CGM readings before the ketone test measurement. The total eligible samples were divided on the patient level into a 70% training dataset and a 30% test dataset. Selection of features, model hyperparameter estimation and training were performed on the training dataset. The final model(s) performance was assessed using the test dataset. CGM, continuous glucose monitoring.
The analysis and models were implemented using MATLAB R2020b (The MathWorks, Inc., Natick, MA) and Python 3 with packages (sklearn 1.0.2, pandas 1.4.2, numpy 1.21.5, matplotlib 3.7).
Feature extraction and reduction
In total, 14 features were extracted from CGM data in a 4-h window before the ketone samples. An example of a 4-h window from a patient is shown in Figure 2. The features comprised mathematical transformations of the signal to describe the dynamics, range of change, distribution, and extreme values. The approach was data-driven and explorative, as we did not have prior knowledge on which features of the signal would hold discriminative information. Glucose dynamics are influenced by daily cycles, partly induced by hormone secretion and habits such as meals and sleep. Therefore, a feature on the hour of day Let CGMk (k = −48, −47, …, −1) be the CGM measurements in the 4-h window before each ketone sample was included. Features are calculated as described in Table 1.
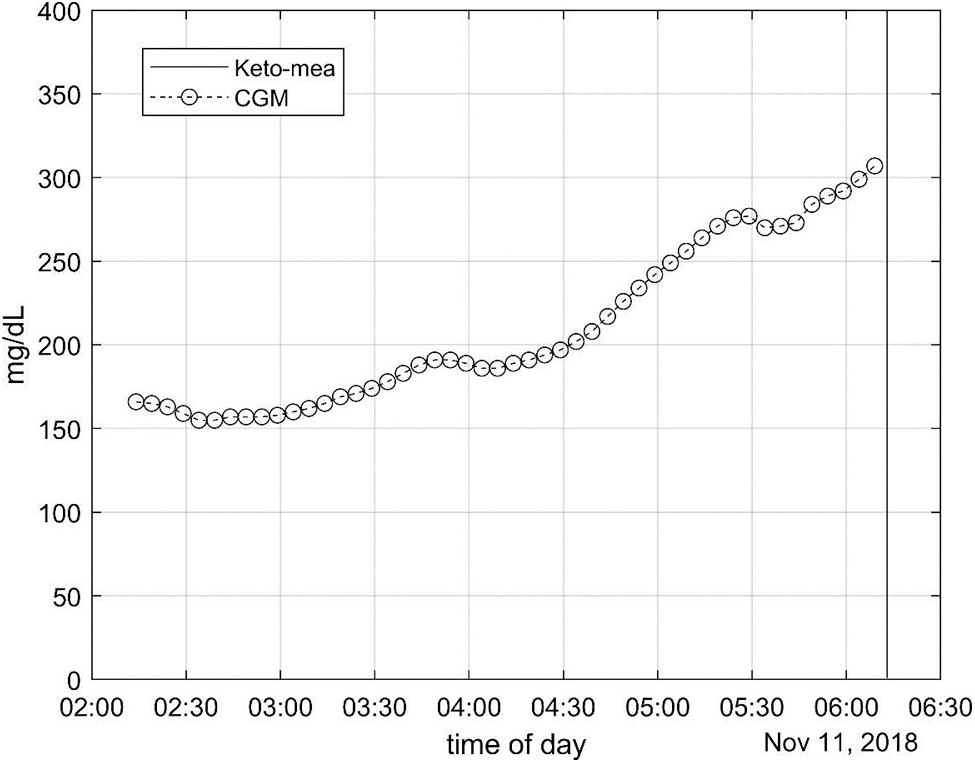
Illustrates a ketone measurement with adjacent CGM measurement for 4 h prior.
The Equations Show How the Features Are Extracted from the Continuous Glucose Monitoring Window
CGM, continuous glucose monitoring.
Choice of machine learning algorithm
Simple linear classifier, logistic regression (LR), and a more complex nonlinear classifier random forest (RF) were compared. LR was used due to the simplicity of the model with a linear combination of features, which gave an easily interpretable model.
Given the binary outcome and the need for a nonlinear approach, prediction model(s) using RF classification were developed. RF is a versatile and robust machine learning method 36 that uses a collection of decision trees to make predictions. RF has several benefits, including low variance, high accuracy, relative robustness to overfitting, ability to handle nonlinear relationships, and interpretability using feature importance.
Hyperparameter tuning (estimators, learn rate, leaf size, and max splits) was determined using grid search and threefold cross-validation on the training dataset. 37 The final model was then tested on the test dataset. In this study, the model was not recalibrated after training the classifier.
Performance metrics
Several common performance metrics for binary classifiers were calculated. 38 To evaluate the general performance of the model, the area under the receiver operating characteristic (ROC) curve (ROC-AUC) was used for comparison. 39 Confidence intervals were estimated using bootstrap replicates (n = 10,000). 40
The performance for specific thresholds from the ROC-AUC to compare in clinical use situations for the patients was also calculated. Every sample in a testing procedure has a real class label and a predicted class label. The real label indicates the class to which the testing sample truly belongs. The predicted label is the output of the classifier at a specific threshold. Let Sk (k = 1, 2, …, n) be the test samples, y(Sk) be the true label of Sk and yp (Sk) be the class prediction of Sk. Thus, the performance assessing true positives (TP), true negatives (TN), false positives (FP), and false negatives (FN) were calculated:
The number of predicted episodes with elevated ketone levels out of the total number of true episodes is important from a clinical perspective. However, patients with diabetes are also prone to device alarm fatigue.
41
Hence, the percentage of true alarm is an important consideration. Hence, the sensitivity (Sen), positive predictive value (PPV) as well as the specificity (Spe), and negative predictive value (NPV) in the reporting of performance metrics were calculated:
Results
In total, 138 patients were included in the analysis. Thirty patients did not have qualified ketone measurements with a CGM window. Among the included patients, 913 ketone samples were eligible for modeling, including 273 event samples with ketone levels ≥0.6 mmol/L. The patients had over 9 million CGM measurements combined corresponding to over 30,000 days with full-time monitoring.
Performance
Random forest
The ROC-AUC from the training dataset was 0.836 (confidence interval [CI] 90%, 0.809–0.862) and 0.836 (CI 90%, 0.783–0.886) for the test dataset. The ROC curves for the training/test dataset are plotted in Figure 3.
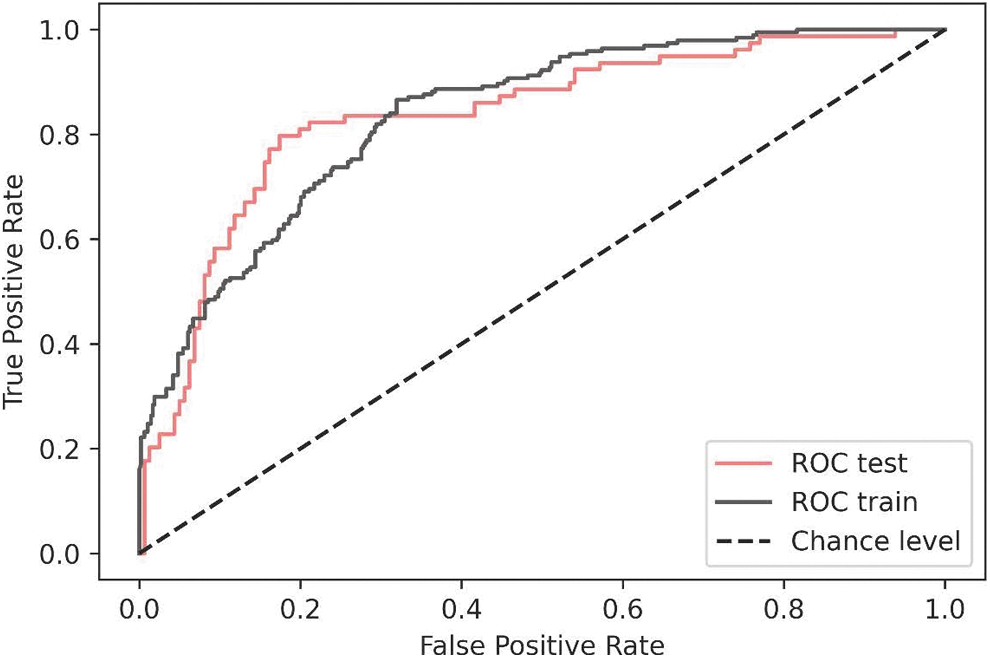
ROC curve(s) from the training/test dataset of the RF model. RF, random forest; ROC, receiver operating characteristic.
As concrete examples: based on the ROC-AUC, Table 2, if a sensitivity of 70% (identifying ∼3/4 elevated ketone levels) were chosen that would correspond to a PPV of 57%. This means that ∼3/4 of elevated ketone levels could be predicted, and among episodes predicted as potentially elevated ketone levels, ∼6/10 would be true and ∼4/10 would be false predictions. If a lower sensitivity of 49% (predicting ∼1/2 elevated ketone levels) would be acceptable, that would yield a PPV of 67%. This means that if a lower sensitivity could be accepted, the amount of false elevated ketone level prediction would be substantially reduced.
Performance Measures for the Two Models, One Cutoff with High Sensitivity and One Cutoff with Low Sensitivity
LR, logistic regression; NPV, negative predictive value; PPV, positive predictive value; RF, random forest.
Feature importance is illustrated in Figure 4, the five most important features are the following: maximum value, mean value, summation, last value, and hour of day.

Feature importance of the included features (MDI). MDI, mean decrease in impurity.
Logistic regression
The ROC-AUC from the training dataset was 0.725 (CI 90%, 0.687–0.762) and 0.710 (CI 90%, 0.646–0.77) for the test dataset. The difference between the ROC-AUC (RF vs. LR) models was significant (P < 0.001).
As concrete examples based on the ROC-AUC, Table 2, if a sensitivity of 68% (identifying ∼3/4 elevated ketone levels) were chosen that would correspond to a PPV of 44%. This means that ∼3/4 of elevated ketone levels could be predicted, and among episodes predicted as potentially elevated ketone levels, ∼4/10 would be true and ∼6/10 would be false predictions. If a lower sensitivity of 48% (predicting ∼1/2 elevated ketone levels) would be acceptable that would yield a PPV of 60%.
Discussion
The aim of this study was to develop and test a prediction model that could alert about their risk of developing DKA in the form of elevated ketone bodies. The results demonstrate that patterns from CGM collected in patients with type 1 diabetes have the potential to be utilized to identify and alarm patients at risk of elevated ketone levels. Elevated ketone levels are a precursor for the development of a dangerous and life-threatening condition, DKA. To our knowledge, this study is the first to investigate the potential of using these types of data for the prediction of acute increased levels of ketone bodies.
The performance of the LR was low, and the ROC-AUC of 0.71 makes it less unfeasible in practice, as more FP would need to be accepted. However, the performance of the RF algorithm was acceptable, with an ROC-AUC of 0.83. The most important features of elevated ketone levels were maximum value, mean value, summation, last value, and hour of day. These features indicated that patterns from the dynamics, distribution, extreme values of the CGM signal and diurnal patterns could be used for the identification of elevated ketone levels.
Implications
The goal of intensive diabetes management is to obtain optimal glycemic control to prevent and reduce diabetes complications such as hypoglycemia, hyperglycemia, and diabetic ketoacidosis. 42 CGM has been demonstrated to help improve glycemic control while reducing the incidence of hypoglycemia and DKA when compared to regular capillary self-measurement of blood glucose. 43 –45 Hence, the adoption of CGM is increasing rapidly among people with diabetes. 46 While CGM as an independent system has proven beneficial, it also opens for layering enhancing algorithms on top of the system. Such an enhancing algorithm could be a model and an alarm for identifying elevated ketone levels.
In the daily life of people using CGM, an alarm for the risk of elevated ketone levels, could notify the user on the need for subsequent testing with a blood or urine ketone testing kit and even starting early on preventing measures for developing DKA. It is likely that such measures may help reduce the number of DKA events and decrease insecurity in this group. A group of users who would be interested in the prediction model is parents to children having type 1 diabetes. Moreover, literature shows how these parents constantly worry/fear about their children or adolescents experiencing hypoglycemia or anything else related to the disease. 47,48
Strengths and limitations
Living a life with type 1 diabetes prescribes a life of several restrictions to avoid complications. Therefore, initiatives who help the patients to live a normal life as possible, may have a large impact on quality of life. In this study, we utilized patterns from CGM to identify increased levels of ketone bodies. To our knowledge, this is the first study that aims to do so. Data used in the study were derived from a large sample of the studied population, patients with type 1 diabetes.
Even though our study has a strong design with a large data material and clear separation between training and testing, there are some limitations that are important to mention. Despite the inclusion of a large sample with many episodes, the number of outcome events was rather small. Over 30,000 days with full-time CGM were analyzed, and only 273 events with ketone levels ≥0.6 mmol/L were found. This is also seen from the test sample results, where the ROC-AUC had a broad CI. This means that the expected performance on new data is not yet reliable, even though the results evidently indicate that the data hold valuable information. An attempt to improve the performance could be to conduct the analysis on a larger dataset.
The included population in the study covers adolescents and adult patients with ketone measurements during hyperglycemic ranges, which gives us an indication of performance in that population. However, the performance in subgroups is not covered and could potentially be subject to intervariability. Noteworthy, DKA can also appear during euglycemic ranges and the CGM patterns are potentially significantly different than the patterns observed during hyperglycemia.
Also, the study's participant cohort comprised individuals engaged in a technological investigation, introducing a potential limitation associated with their inherent characteristics. Specifically, participants involved in device-centric studies often exhibit reduced HbA1c levels compared to the broader population, demonstrating increased adherence to diabetes management protocols, including the vigilant execution of pump site changes, insulin administration, and prompt treatment of hyperglycemic episodes. Consequently, the glycemic patterns observed preceding and during ketone development in this study may deviate from those of populations less proactive in diabetes management.
To enhance the comprehensiveness of the findings and their potential applicability, a valuable avenue for future research involves comparing the model's performance with cohorts characterized by previous admissions for DKA or elevated HbA1c levels. Such cohorts represent individuals with a higher likelihood of benefiting from DKA prediction. In addition, it is noteworthy that the model's evaluation focused on pump users, and the outcomes may not be directly extrapolated to injection users relying on long-acting insulin, potentially influencing the glucose-ketone relationship as monitored by CGM systems. This consideration underscores the importance of diversifying the study population to encompass various diabetes management modalities for a more comprehensive understanding of the model's generalizability.
It is not possible to compare the results from our proposed novel approach to existing research since this is the first study to investigate the potential of utilizing CGM patterns to identify elevated ketone levels. The pathophysiology of DKA is well known. 10 It involves the complex combination of insulin deficiency, lack of exogen-administered insulin and increased counterregulatory hormones such as glucagon, growth hormone, catecholamines, and cortisol. This can lead to altered glucose production and consumption and to increased lipolysis and subsequent production of ketone bodies. 49,50
Future research
Future work includes validating the results in patients with different characteristics such as children, high DKA risk groups, individuals with high HbA1c and relying on insulin injections. It would also be interesting to add additional information to the models such as meal intake, insulin administration, insulin-on-board estimation, and demographic information—which all have an important physiological role in carbohydrate and lipid metabolism. 51
However, a notable concern arises with the utilization of insulin data obtained from pump devices. It is imperative to acknowledge the inherent risk of deriving inaccurate assessments of the actual insulin present in the body when relying on pump-collected data. This concern emanates from a prevalent issue in pump users, wherein one of the significant causes of DKA is attributed to infusion set malfunctions. In such cases, the pump may erroneously indicate the presence of insulin on board, when, in reality, the intended insulin delivery might not have reached the patient. This potential source of misinformation underscores the necessity for cautious consideration and validation when incorporating pump-derived insulin data into models.
There are many alternative machine learning algorithms for binary classification, including but not limited to ensemble methods, K-nearest neighbors, support vector machines, and neural networks. We have recently shown on large datasets, including CGM, that neural networks have good performance for predictive modeling. 52,53 Future research could compare the performance of more algorithms simultaneously.
Finally, the clinical impact of the proposed model needs to be evaluated before the implications can be fully understood.
Conclusion
The novel approach for identifying elevated ketone levels during hyperglycemia in patients with type 1 diabetes utilized in this study indicates that CGM could be a valuable resource for the early prediction of patients at risk of developing DKA. Future studies are needed to validate the results further and to explore the potential improvement of adding information from the insulin regime and dosing in the models.
Footnotes
Authors' Contributions
S.L.C. had access to all data analyzed in this study. S.L.C. takes responsibility for the integrity and accuracy of the study data analysis and results. S.L.C. and C.B. were involved in the study design, concept, analysis, and interpretation of the data. S.L.C. drafted the article and performed the statistical analysis. C.B. were involved in critical revision of the article.
Disclaimer
The source of the data is from the DCLP3 trial, but the analyses, content, and conclusions presented herein are solely the responsibility of the authors and have not been reviewed or approved by DCLP3 group.
Author Disclosure Statement
The research was funded by i-SENS, Inc. (Seoul, South Korea) and S.L.C.'s involvement with the company did not influence the design, implementation, or interpretation of the study. S.L.C. have received research funding from i-SENS, Inc. (Seoul, South Korea), which manufactures some of the product types discussed in this article. However, the study was conducted independently, and the authors declare that their involvement with i-SENS, Inc. (Seoul, South Korea) did not influence the findings or conclusions of the study.
Funding Information
The study was funded by i-SENS, Inc. (Seoul, South Korea).