




Abstract
Aim:
The aim of this study was to develop and validate a prediction model based on continuous glucose monitoring (CGM) data to identify a week-to-week risk profile of excessive hypoglycemia.
Methods:
We analyzed, trained, and internally tested two prediction models using CGM data from 205 type 1 diabetes patients with long-term CGM monitoring. A binary classification approach (XGBoost) combined with feature engineering deployed on the CGM signals was utilized to predict excessive hypoglycemia risk defined by two targets (time below range [TBR] >4% and the upper TBR 90th percentile limit) of TBR the following week. The models were validated in two independent cohorts with a total of 253 additional patients.
Results:
A total of 61,470 weeks of CGM data were included in the analysis. The XGBoost models had an area under the receiver operating characteristic curve (ROC-AUC) of 0.83–0.87 (95% confidence interval; 0.83–0.88) in the test dataset. The external validation showed ROC-AUCs of 0.81–0.90. The most discriminative features included the low blood glucose index, the glycemic risk assessment diabetes equation (GRADE), hypoglycemia, the TBR, waveform length, the coefficient of variation and mean glucose during the previous week. This highlights that the pattern of hypoglycemia combined with glucose variability during the past week contains information on the risk of future hypoglycemia.
Conclusion:
Prediction models based on real-world CGM data can be used to predict the risk of hypoglycemia in the forthcoming week. The models showed good performance in both the internal and external validation cohorts.
Introduction
Type 1
Hypoglycemia, defined as a blood glucose level less than the normal range (<70 mg/dL), is a frequent and serious concern in individuals with type 1 diabetes. 3 It can lead to immediate adverse effects such as confusion, impaired cognition, loss of consciousness, and, in extreme cases, seizures or coma. Moreover, recurrent hypoglycemia has been associated with reduced hypoglycemia awareness and increased cardiovascular morbidity, imposing a substantial burden on the quality of life and overall health of individuals with diabetes. 4,5
In traditional clinical practice, the management of hypoglycemia has typically been reactive, meaning that interventions, such as adjusting the insulin dosage or timing, are taken after a low blood sugar event has already occurred. On the contrary, adopting proactive approaches to address hypoglycemia offers an opportunity to implement preventive strategies to reduce the frequency of hypoglycemic episodes. The development and use of predictive models for this purpose can empower health care providers and individuals with diabetes to take preemptive actions during periods when the risk of hypoglycemia is increased. 6
In recent years, numerous statistical analyses have been performed, predominantly centered on self-monitoring of blood glucose, to identify individuals with diabetes at risk of both hypoglycemic and hyperglycemic events. 7,8 The evaluation of glucose profiles has yielded several metrics, many of which exhibit significant intercorrelations and associations with the duration of hypoglycemic episodes. 9 Notably, the low blood glucose index (LBGI) has emerged as a particularly promising metric for mitigating subsequent severe hypoglycemia. 10
Continuous glucose monitoring (CGM) is a valuable tool in diabetes management. This technology provides real-time glucose readings and trends. 11 The advent of CGM technology has revolutionized diabetes management by providing continuous, high-resolution glucose data, enabling a more comprehensive understanding of glucose dynamics. 11 These data-rich profiles can be leveraged by including them in the development of prediction models that capture the interplay of various physiological and behavioral factors that contribute to hypoglycemia. 6,11 With their ability to extract complex patterns and nonlinear relationships from large datasets, machine learning algorithms offer powerful tools for building accurate and robust predictive models. 12,13 By combining CGM data and machine learning models, the potential for accurate prediction of hypoglycemic events has become a promising avenue for research. 14 –20
Many studies have shown promise in predicting hypoglycemia occurrence within a short timeframe (2 hours to 15 minutes). 20,21 While these predictions help patients prevent or mitigate hypoglycemia, a drawback is the increased stress on patients when their glucose levels are constantly monitored. The development of accurate week-to-week prediction models for hypoglycemia risk could assist health care providers in implementing timely interventions and tailoring treatment plans for individuals with type 1 diabetes. In addition, empowering patients with knowledge about their individual risk profiles, including temporal dynamics and forecasting of high-risk periods, can facilitate proactive self-management, leading to improved glycemic outcomes and enhanced quality of life.
The aim of this study was to develop and validate two prediction models based on CGM data to forecast the week-to-week risk of excessive hypoglycemia.
Materials and Methods
Discovery cohort
We developed, trained, and internally validated a prediction model using CGM data from the Wireless Innovation for Seniors with Diabetes Mellitus (WISDM) study to predict the risk of hypoglycemia in the forthcoming week. 22 The WISDM study investigated whether CGM was more effective at reducing hypoglycemia than was standard blood glucose monitoring in older adults with type 1 diabetes.
A total of 206 patients with type 1 diabetes were enrolled in the WISDM study and utilized CGM (Dexcom G5) for a period of up to 6 months. The cohort's median age was 68 (interquartile range [IQR], 65–71) years, with a diabetes duration of 36 (IQR, 25–48) years and a mean HbA1c of 7.5% (standard deviation [SD], 0.9%). In the present study, we used CGM data from all the enrolled participants to train and validate the prediction model.
Two consecutive weeks of CGM usage ≥70% of the time were included as a prediction case. The first week was used to extract features to predict the outcome of the second week. Participants with no cases included in the analysis were excluded. The cases were split into a training dataset (70%) and a test dataset (30%) at the individual level. This procedure ensured that cases from one individual could not be present in either the training or test datasets. The general modeling approach is illustrated in Figure 1.

Training, prediction, and validation of hypoglycemia risk from weekly CGM. The general ML workflow starts by partitioning the data into a training set (Train) and a test set (Test). The trajectories for training input are generated by sampling continuous subsequences of weekly CGM data with adjacent weekly outcomes. A range of features are extracted from the weekly input CGM, and the binary outcome is defined in the following week in accordance with the defined criteria for hypoglycemia. The training datasets are used for training to minimize the model's prediction error. The ability of each model to predict excessive hypoglycemia using the test dataset and the two validation datasets was assessed by performance, uncertainty estimates, interpretability, and at-risk characteristics. CGM, continuous glucose monitoring; CITY, CGM Intervention in Teens and Young Adults with T1D; LOCF, last observation carried forward; ML, machine learning; REPLACE-BG, replace blood glucose; TBR, time below range; WISDM, Wireless Innovation for Seniors with Diabetes Mellitus.
External validation cohorts
Two additional independent datasets (from the REPLACE-BG trial 23 and from the CITY [CGM Intervention in Teens and Young Adults with T1D]) 24 were used to externally validate the final prediction model. The purpose of using these two study populations in conjunction with the WISDM population was to pool a large heterogeneous population that could reflect the differences in the general population of type 1 diabetes patients from young to old.
Replace Blood Glucose
The cohort consisted of individuals who participated in the replace blood glucose (REPLACE-BG) trial, 23 an initiative aimed at evaluating the safety and efficacy of CGM without blood glucose confirmation (from self-monitoring blood glucose devices). Specifically, the study included adults with type 1 diabetes who were using an insulin pump, had baseline HbA1c levels <8.5%, and did not have hypoglycemia unawareness or a history of severe hypoglycemia. A total of 225 patients with type 1 diabetes were enrolled in the study and utilized CGM (Dexcom G4). The cohort's mean age was 44 years (SD, 14), and her diabetes duration was 23 years (SD, 12). The average body mass index of the participants was 27.7 (SD, 4.1) kg/m2. In the present study, we used CGM data from all the enrolled participants with adequate data to validate the prediction model.
CGM intervention in teens and young adults with T1D
The cohort consisted of individuals who participated in the CITY trial. 24 The original aim was to determine the effect of CGM on glycemic control in adolescents and young adults with type 1 diabetes. A total of 153 participants were included; the mean age was 17 (SD, 3) years, the mean duration of diabetes was 9 (SD, 5) years, and the mean HbA1c was 8.9% at baseline. In the present study, we used CGM data from all the enrolled participants with adequate data to validate the prediction model.
Outcome
The primary outcome of the prediction models was excessive hypoglycemia (eHypo) versus nonexcessive hypoglycemia (nHypo). Hypoglycemia was measured using CGM and was based on the time below range (TBR; <70 mg/dL). We defined eHypo by two binary endpoints: - Endpoint 1: Weeks with TBR >90th percentile, based on the training dataset. - Endpoint 2: Weeks with TBR >4%. The latter has been recommended as a potential treatment target.
25
Feature engineering
To capture the various aspects of glucose dynamics measured by CGM, we calculated and assessed multiple clinical, 26 time-domain, 27 statistical, 28 waveform shape, 29 and frequency-domain features 27 as potential predictors of excessive hypoglycemia risk. 18 Features were calculated based on 1 week of CGM measurements with the objective of predicting eHypo the following week. A total of 26 features were assessed:
Clinical features
- Time in range (TIR), %: Time above range 2 (TAR2), %: Time fraction spent at glucose levels 70–180 mg/dL.
- TAR level 1 (TAR1), %: Time fraction spent at glucose levels above 180 mg/dL.
- TAR level 2 (TAR2), %: Time fraction spent at glucose levels above 250 mg/dL.
- TBR level (TBR_total), %: Time fraction spent at glucose levels below 70 mg/dL.
- TBR level 1 (TBR1), %: Time fraction spent at glucose levels between 54 and 70 mg/dL.
- TBR level 2 (TBR2), %: Time fraction spent at glucose levels below 54 mg/dL.
Statistical features
- Mean, mg/dL: average value of the glucose level;
- variance, mg/dL: measure of the spread or dispersion of the glucose signal;
- skewness, no unit: measure of the asymmetry of the glucose signal distribution;
- kurtosis, no unit: measure of the peakedness of the glucose signal distribution;
- root mean square (RMS), mg/dL: square root of the average of the squared values of the glucose signal.
- Coefficient of variation (CV), %: the standard deviation divided by the mean value of the glucose signal.
- LBGI, no unit: measure of the risk of severe hypoglycemia. 30
- Glycemic risk assessment diabetes equation hypoglycemia (GRADEhypo), no unit: Contribution to GRADE from glucose levels below 70 mg/dL. 31
- Glycemia risk index hypocomponent (GRI_hypo), no unit: the hypoglycemia component of the GRI. 32
Time-domain features
- Zero Crossing Rate, n: Number of times the signal crosses the hypoglycemia axis (70 mg/dL).
- Signal Energy, mg/dL 2 : Sum of squared values of the glucose signal.
- Autocorrelation, mg/dL 2 : Measure of the similarity between the signal and its delayed versions.
- Entropy, bits: Measure of the signal's complexity or uncertainty.
Frequency-domain features
- Power spectral density, mg/(dL 2 ·Hz): Distribution of power over various frequencies.
- Spectral centroid, Hz: Center of mass of the glucose signal's power spectrum.
- Spectral entropy, no unit: Measure of the spectral complexity or uncertainty.
- Spectral roll-off, Hz: Frequency below which a specified percentage of the signal's energy is contained.
Waveform shape features
- Peak-to-peak amplitude, mg/dL: difference between the maximum and minimum values of the glucose signal;
- crest factor, no unit: ratio of the peak value to the RMS value of the glucose signal;
- slope sign change, n: number of times the slope of the signal changes its sign;
- waveform length, mg/dL: sum of absolute differences between consecutive samples of the signal.
Model development
Given the binary outcome (eHypo vs. nHypo) and the need for a nonlinear approach, we developed a prediction model using the XGBoost classification. 33 XGBoost, or extreme gradient boosting, is a powerful machine learning algorithm known for its ability to handle complex datasets. Multiple weak prediction models, called decision trees, are combined to create a strong ensemble model. XGBoost excels at capturing nonlinear relationships, handling missing data/imbalanced data, and preventing overfitting, leading to high predictive performance. XGBoost has demonstrated significant success in the development of clinical prediction models across various medical applications. 34 –36
To attain optimal performance, careful tuning of the XGBoost model is necessary. However, tuning can be challenging due to the numerous hyperparameters involved. In this study, a grid search was used for parameter optimization. 37 Given the high dimensionality of the parameters, managing the grid search was facilitated by selecting smaller parameter combinations with reasonable value ranges. Model selection was evaluated using K-fold cross-validation (fivefold) to assess the model performance effectively. 38
The final model was then tested on the test dataset and the validation datasets. We did not recalibrate the model after the training procedure.
Last observation carried forward
To estimate the potential benefit of using a machine learning approach versus a conventional statistical approach, we also compared the prediction models with a last observation carried forward (LOCF) approach. The LOCF used the observed class (eHypo or nHypo) from the current week to predict the risk of hypoglycemia in the forthcoming week.
Model assessment
The discrimination of the model was evaluated using the area under the receiver operating characteristic curve (ROC-AUC). 39 The confidence intervals (CIs) for the ROC-AUC were estimated using 1000 bootstrap replicates. The distribution of the predicted probabilities for the classes (eHypo vs. nHypo) was assessed using a normalized frequency plot. To evaluate the clinical implications of using the model, we calculated the relative risk (RR) for decision boundaries spanning from 1% to 100% of the patients, considering patients at risk (positive predictions). In addition, the determination of the cutoff between excessive hypoglycemia and nonexcessive hypoglycemia is not deterministic. Hence, we calculated the TBR for false-positive predictions and true-negative predictions to provide a nuanced understanding of the model's performance and clinical implications.
Feature importance and model explainability
One of the challenges with complex machine learning models, such as XGBoost, is their lack of interpretability, which makes it difficult to understand how and why they make specific predictions. To address this, SHapley Additive exPlanations (SHAP) 40 values can be used to provide explainability for XGBoost models. SHAP values offer a unified framework to explain the predictions of any machine learning model. These methods are based on the concept of Shapley values from cooperative game theory. SHAP values assign an importance value to each feature in a prediction, indicating how much each feature contributes to the overall prediction. The SHAP framework was utilized to assess feature importance in the proposed model.
Furthermore, to investigate the features' intercorrelations, a triangle correlation heatmap plot was constructed based on Pearson correlation coefficients.
All analyses were performed using MATLAB (R2021b), Python (v3), the scikit-learn package (v0.23.2) for machine learning utilities, and the XGBoost package (v1.7.5).
Results
We enrolled 205 (out of 206) patients from the WISDM study for a total of 27,829 case weeks for training and testing the model. The characteristics of the patients included are presented in Supplementary Table S1.
Endpoint 1: TBR >90th percentile
The proportion of people who met the definition of eHypo based on the TBR >90th percentile criteria was 9.6% (n = 2669). The median TBR was 2.2% (IQR; 0.9%; 4.2%), and the upper TBR 90th percentile limit was 7.2%.
The XGBoost model had an ROC-AUC of 0.87 (95% CI = 0.86–0.88) in the test dataset. Figure 2 illustrates the normalized predicted probabilities for eHypo versus nHypo (Fig. 2, upper left); it is observable that there is a difference in the distributions. For a proposed decision boundary of 0.4, it is possible to obtain a true positive rate of 0.37 with a low false-positive rate of 0.04 (Fig. 2, upper right). This translates to an accurate prediction of ∼4/10 of eHypo events, with a positive predictive rate of 0.50. Furthermore, the analysis showed (Fig. 2, lower right) that the false-positive cases have a higher (∼twofold) TBR than the true-negative cases independent of the chosen decision boundary and percentages of cases at risk. This points toward false-positive cases could also be a target of clinical interest. The RRs associated with the patients at risk are illustrated in Figure 2 (lower left).
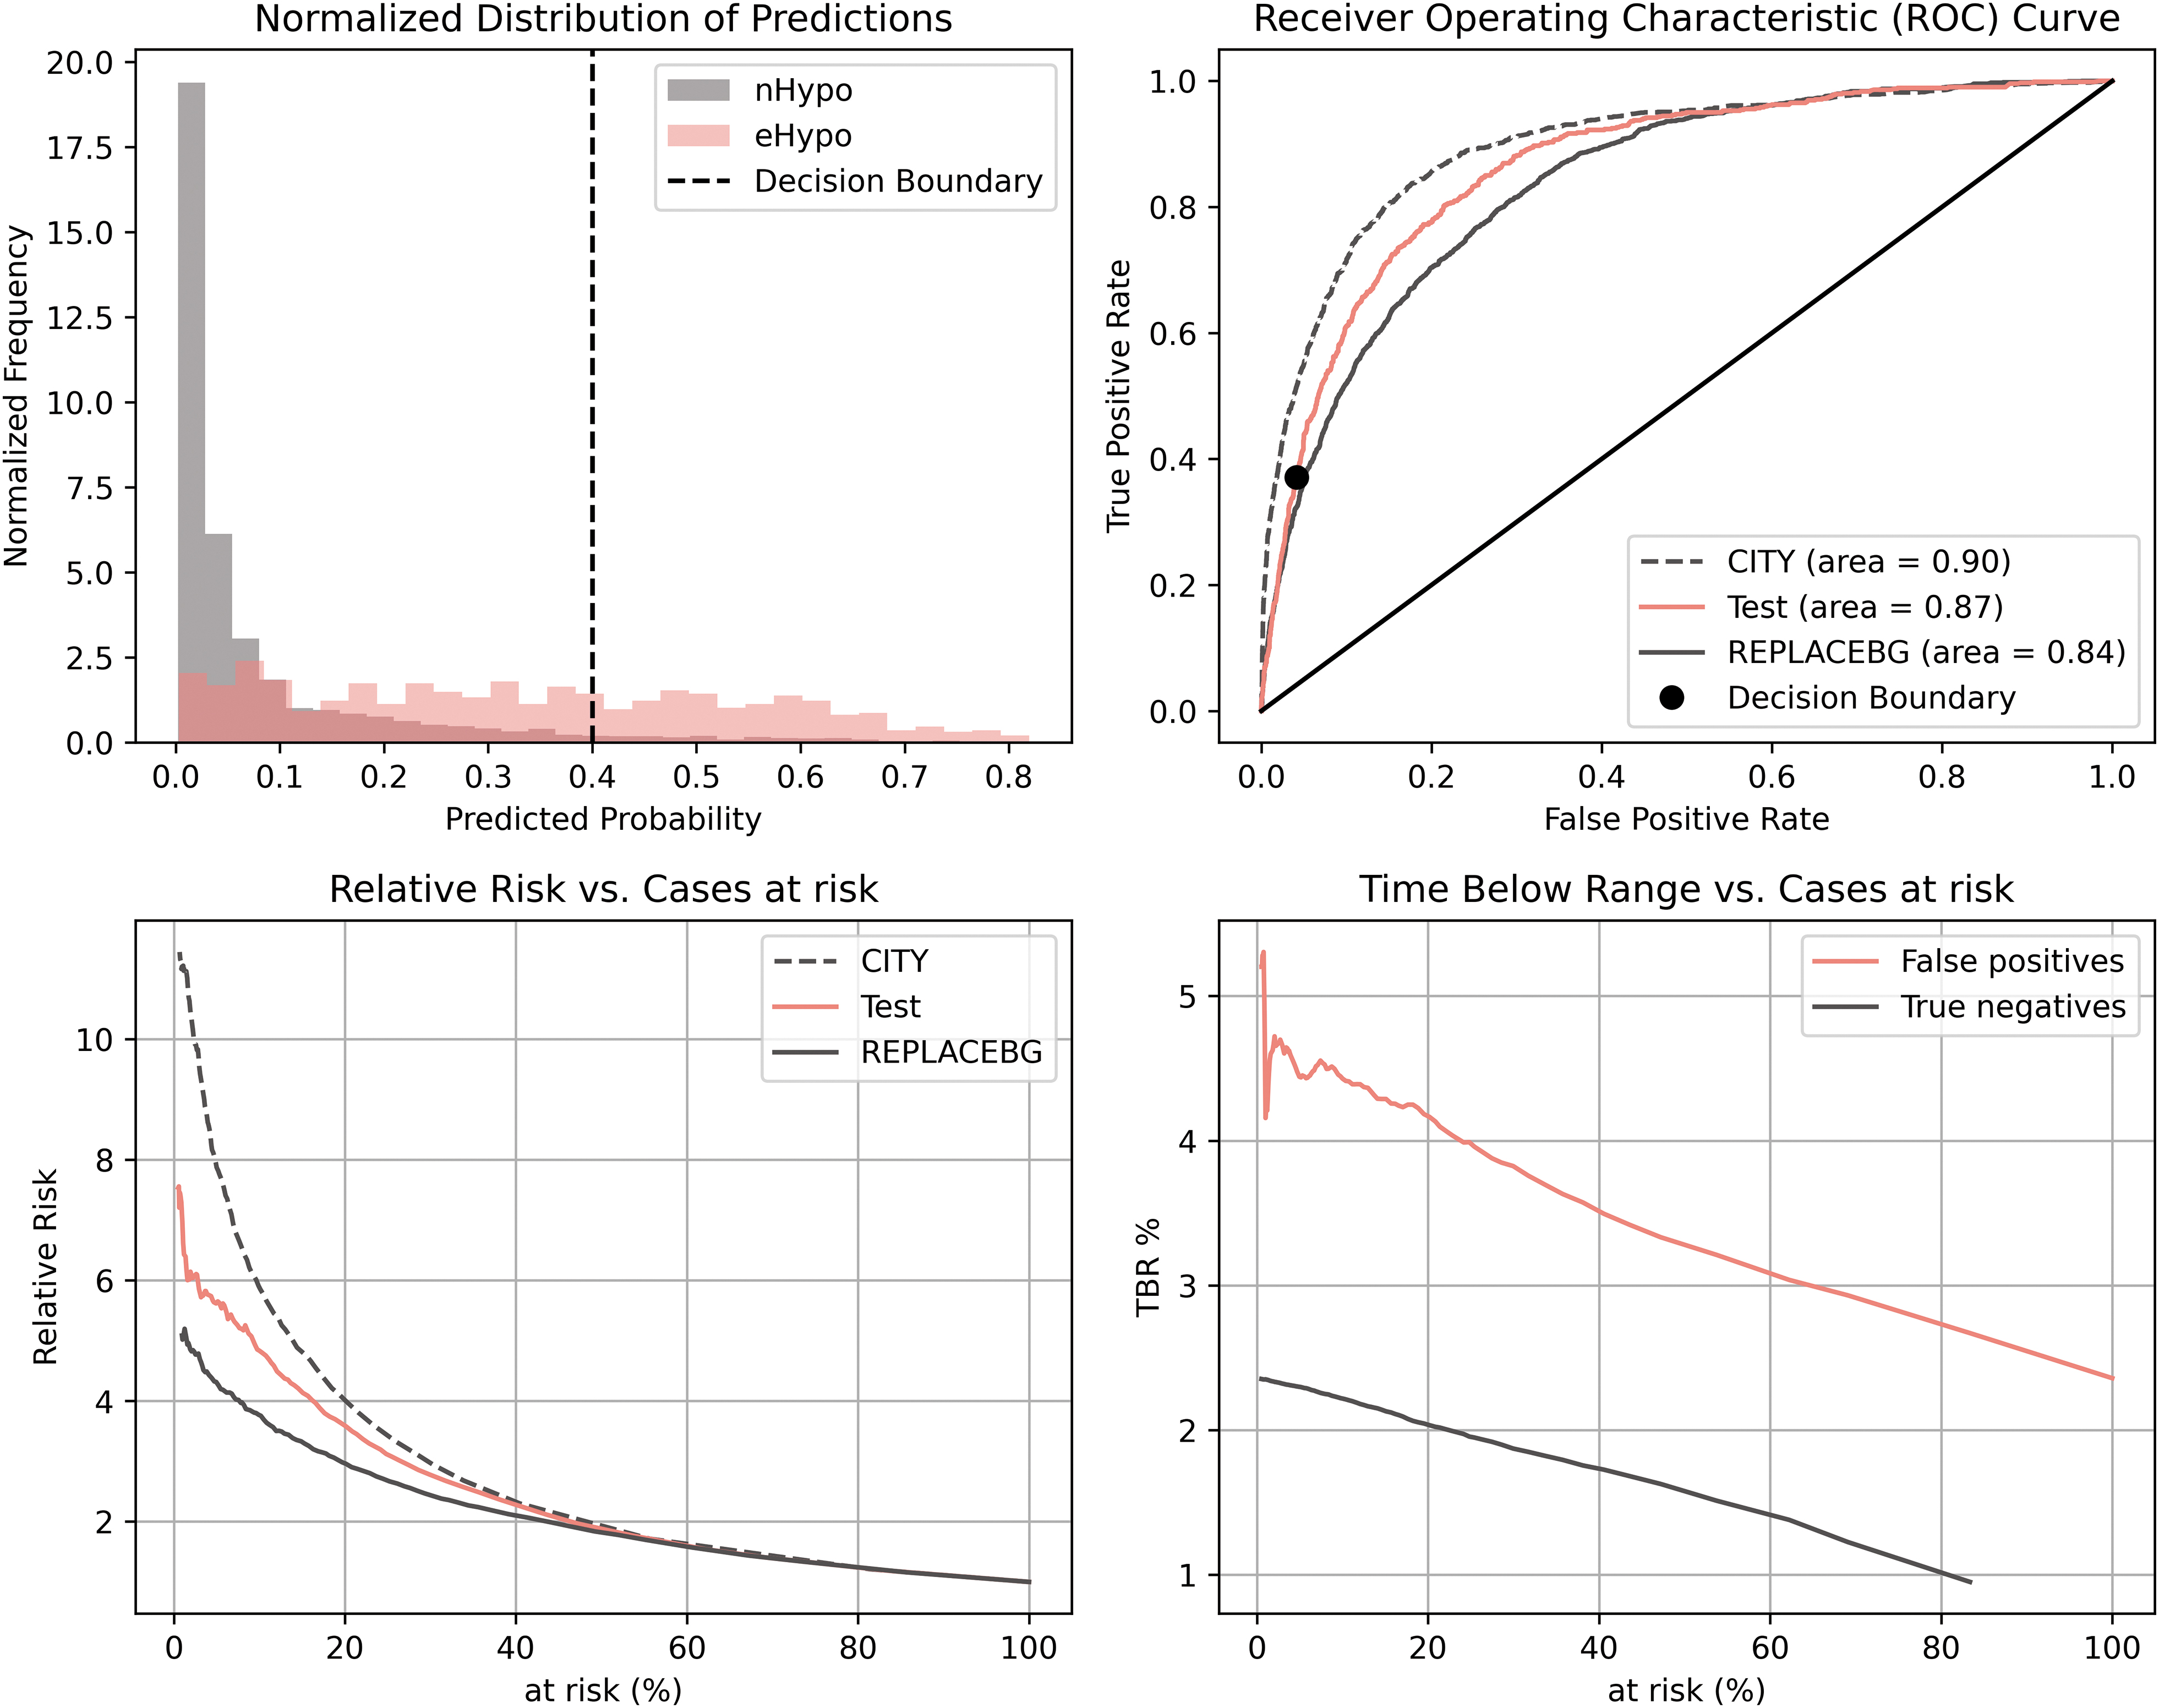
Diagnostic performance characteristics of the prediction model based on endpoint 1 (TBR >90th percentile [eHypo]). The upper left plot shows the normalized predicted probabilities for eHypo and nHypo. The histogram shows the models probabilistic output for the two classes. Subjects with excessive hypoglycemia has higher values which indicate that the model can separate between subjects with and without excessive hypoglycemia. The upper right plot shows the ROC curve for the test dataset and the two validation datasets. The curve illustrates the model's ability to predict excessive hypoglycemia in a trade-off between sensitivity true positive rate (TPR) and specificity false positive rate (FPR). The lower left plot shows the relative risk for the test and validation datasets as a function of individuals predicted as at-risk. The relative risk is calculated between the group predicted to have eHypo versus the group predicted to have nHypo. The lower right plot shows the time spent in hypoglycemia as a function of the proportion of individuals predicted to be at risk. This illustrates that in the group predicted as eHypo, the false-positive subjects have higher time spent in hypoglycemia than true negatives (predicted as nHypo)—this implicate that many false-positive subjects could still benefit from clinical intervention even though they do not need the definition for eHypo. ROC, receiver operating characteristic.
The conservative LOCF approach yielded an ROC-AUC of 0.70 (95% CI = 0.69–0.71) in the test cohort. The ROC-AUC of the LOCF approach was significantly lower than that of the machine learning (ML) approach (P < 0.001).
Endpoint 2: TBR >4%
The proportion of people meeting the definition of eHypo based on a weekly TBR >4% was 27.7% (n = 7720). The XGBoost model had an ROC-AUC of 0.83 (95% CI = 0.82–0.84) in the test dataset. The LOCF approach yielded a ROC-AUC of 0.74 [95% CI; 0.73–0.75]. The ROC-AUC of the LOCF approach was significantly lower than that of the ML approach (P < 0.001).
Supplementary Figure S1 illustrates the diagnostic performance of the model on the test and validation datasets.
External validation
Endpoint 1: TBR >90th percentile
We enrolled 149 (out of 153) patients from the CITY study, for a total of 21,205 case-weeks, for external validation of the model. The proportion of people meeting the definition of eHypo based on the TBR >90th percentile according to the primary model was 7.7% (n = 1647). The median TBR was 1.3% (IQR; 0.4%; 3%). The model had an ROC-AUC of 0.90 (95% CI = 0.89–0.91) in the CITY validation dataset. The LOCF approach yielded a ROC-AUC of 0.74 [95% CI; 0.73–0.75]. The ROC-AUC of the LOCF approach was significantly lower than that of the ML approach (P < 0.001).
We enrolled 104 (out of 226) patients from the REPLACE-BG study, for a total of 12,436 case weeks, for external validation of the model. The large number of patients excluded was due to inadequate CGM measurements (two consecutive weeks with CGM usage ≥70% of the time). The proportion of people meeting the definition of eHypo based on the TBR >90th percentile according to the primary model was 14.7% (n = 1829). The median TBR was 2.8% (IQR; 1.2%; 5.4%). The model had an ROC-AUC of 0.84 (95% CI = 0.83–0.85) in the REPLACE-BG validation dataset. The LOCF approach yielded a ROC-AUC of 0.70 [95% CI; 0.69–0.71]. The ROC-AUC of the LOCF approach was significantly lower than that of the ML approach (P < 0.001).
Endpoint 2: TBR >4%
According to the CITY validation dataset, the proportion of people with eHypo based on a TBR >4% according to the primary model was 19.2% (n = 4066). The model had an ROC-AUC of 0.86 (95% CI = 0.85–0.87) in the validation dataset. The LOCF approach yielded an ROC-AUC of 0.76 (95% CI; 0.75–0.76). The ROC-AUC of the LOCF approach was significantly lower than that of the ML approach (P < 0.001).
According to the REPLACE-BG validation dataset, 36.7% (n = 4569) of the people with eHypo based on the TBR >4% criterion were included in the primary model. The model had an ROC-AUC of 0.82 (95% CI = 0.81–0.83) in the validation dataset. The LOCF approach yielded a ROC-AUC of 0.72 [95% CI; 0.71–0.73]. The ROC-AUC of the LOCF approach was significantly lower than that of the ML approach (P < 0.001).
Feature importance
Feature importance analysis revealed that the LBGI was the most important single feature for discriminating weeks with excessive versus nonexcessive hypoglycemia. Moreover, GRADEhypo, a TBR <70 mg/dL, the waveform length, the CV, the mean glucose concentration, and the change in the slope sign also had significant impacts on the diagnostic performance characteristics of the models for endpoint 1 (Fig. 3). The feature importance analysis for endpoint 2 is presented in Supplementary Figure S2. LBGI also appeared to be the most important single feature for this endpoint, while additional features had an impact on the prediction (GRI_hypo, TBR <54 mg/dL). These findings highlight that the past week's information on hypoglycemia combined with glucose variability holds information on the risk of the forthcoming week's risk of excessive hypoglycemia.

SHAP violin plot illustrating the 20 features with the most importance to the diagnostic performance characteristics of the model (endpoint 1). CV, coefficient of variation; LBGI, low blood glucose index; SHAP, SHapley Additive exPlanations; TAR, time above range; TIR, time in range.
Individual features ability to predict eHypo is illustrated in Supplementary Figure S3. Several features (i.e., LBGI, GRADEhypo, TBR_total, GRIhypo, zeroCorssingRate70) have substantial predictive power in isolation for forecasting the risk of excessive hypoglycemia in the subsequent week. However, our findings reveal a noteworthy enhancement in predictive ability (ROC-AUC) when amalgamating these predictors through machine learning.
Figure 4 illustrates the correlation between the features included in this analysis. Not surprisingly, several of the features had a high correlation. However, the analysis showed that the proposed features were able to capture different dynamics of the CGM signal. Notably, the LBGI and GRADEhypo were strongly correlated with the total time (%) spent in hypoglycemia, while the CV and slope sign change were weakly correlated with the other features.

Correlation (Pearson's correlation coefficient) heatmap between the proposed features of the model. GRADEhypo, glycemic risk assessment diabetes equation hypoglycemia; GRI_hypo, glycemia risk index hypocomponent.
Discussion
Within a cohort of people ≥60 years of age with type 1 diabetes, we developed and internally validated two novel machine learning models to predict the risk of excessive hypoglycemia in the upcoming week. The models used CGM data and utilized two distinct definitions of hypoglycemia based on the TBR. The models were further externally validated in two independent cohorts of people with type 1 diabetes spanning from adolescents to adults. The models were based on CGM device dynamics from the past week to predict the risk of hypoglycemia in the upcoming week. The final models were shown to have good discrimination ability (AUC-ROC 0.83–0.87), which was confirmed in the external validation datasets (AUC-ROC 0.82–0.90).
The main drivers for the prediction models were features measuring the time spent in hypoglycemia, LBGI, GRADEhypo, and measures of glucose variability. The machine learning modeling approach showed better discriminative ability for all the targets than did the conservative LOCF approach.
Our data also showed that in addition to the binary discriminative ability of the models, false positives in the at-risk groups still had a greater duration of hypoglycemia than true negatives. This emphasizes the model's ability to identify individuals at high risk of hypoglycemia.
Comparison to the literature
We utilized a machine learning-based modeling approach for predicting the risk of excessive hypoglycemia on a week-to-week basis, which, to our knowledge, has not been investigated before. Numerous studies have been conducted with the aim of predicting near-occurring incidences of hypoglycemia within the timeframe of 2 h to 15 min. 20,21 The results of these studies are very promising and enable individuals to take countermeasures to avoid or reduce hypoglycemia. Nevertheless, the shortcoming of short-term prediction models of hypoglycemia is the stress induced by the patient, which results in a constant focus on glycemic control. Patients may experience hypoglycemia several times a week or even daily. Most of these proposed models 21 are also based on input from both CGM and several other parameters, including diet, physical activity, heart rate, ECG, and insulin administration, and this information is often not feasible for continuous use in a real-world environment.
Other investigators have also studied the medium-term (up to 24 h) prediction of hypoglycemia with different applications. Mathioudakis et al. 41 reported a model for predicting the risk of iatrogenic hypoglycemia within 24 h after each blood glucose measurement during hospitalization using a machine learning model. The results were very promising (AUC-ROC of 0.90) and could help to reduce in-hospital hypoglycemia. However, these findings await external validation. A similar approach for in-hospital hypoglycemia diagnosis was reported by Ruan et al., who reported that XGBoost had the highest predictive performance (AUC-ROC 0.96). 42
Furthermore, Kronborg et al. 43 proposed a model to predict nocturnal hypoglycemia using CGM data obtained daily at bedtime among people with type 2 diabetes receiving insulin treatment (AUC-ROC 0.82). Sampath et al. 44 investigated the potential for predicting nocturnal hypoglycemia using glucose control indices such as GRADEhypo and LBGI; both indices have predictive capability in patients with type 1 diabetes. Cox et al. 10 found that the LBGI increased within the 24-h period preceding severe hypoglycemic episodes in individuals diagnosed with both type 1 and type 2 diabetes.
Our proposed approach involving weekly risk prediction based on CGM alone could enable patients, in cooperation with their clinician, to take general measures to ensure more stable blood glucose regulation with reduced episodes of hypoglycemia.
Strengths and limitations
A strength of our study is the external validation of the model using large heterogeneous diabetes populations that reflect the differences in the general type 1 population from young to old. Another strength is the high degree of model interpretability linking predictor variables to the outcome.
However, a number of limitations must be mentioned. We cannot generalize our findings to patients using closed-loop systems. In addition, we observed both an increase and a decrease in the performance when validating the model in the two validation datasets. This could be due to diverse sensitivities in the underlying glucose dynamics from the different datasets, meaning that a calibration of the model could be preferable in the groups of patients intended for usage. We proposed two different definitions of excessive hypoglycemia characterized by the TBR, as this metric has recently been recommended as a treatment target. 25 However, patients at risk of hypoglycemia could also be characterized by the severity of hypoglycemia or the number of hypoglycemic episodes, which are both clinically important targets.
Moreover, the assessment of future hypoglycemia was calculated based on both daytime and nighttime hypoglycemia during the following week. A clinically relevant way to characterize hypoglycemia could be to stratify the targets for prediction into nighttime hypoglycemia and daytime hypoglycemia. As a design feature of the models, we included only input from a CGM system. However, alternative input modalities, such as insulin type and units, as well as information on physical activity from wearable devices, may provide additional relevant features to further enhance the predictive performance of the models.
Conclusion
We developed and externally validated two machine learning models to predict the long-term risk of hypoglycemia on a week-to-week basis among people with type 1 diabetes. The models were based on predictors derived from feature engineering on CGM data. The most discriminative features included the LBGI, GRADEhypo, time spent in hypoglycemia, and measures of glucose variability.
Footnotes
Authors' Contributions
S.L.C. had access to all the data analyzed in this study. S.L.C. takes responsibility for the integrity and accuracy of the study data analysis and results. S.L.C., M.H.J., and S.S.O. were involved in the study design, concept, analysis, and interpretation of the data. S.L.C. drafted the article and performed the statistical analysis. S.S.O. and M.H.J. were involved in critical revision and preparation of the article.
Disclaimer
The source of the data is from the WISDM/ERPLACE-BG/CIISTY trial, but the analyses, content, and conclusions presented herein are solely the responsibility of the authors and have not been reviewed or approved by trial group(s).
Ethics Statement
The present study is a reanalysis of existing and anonymized data from the WISDM/RELPACE-BG/CINY clinical trials. The present study did not require any approval from institutional or/or licensing committees; cf. Danish law on “Bekendtgørelse af lov om videnskabsetisk behandling af sundhedsvidenskabelige forskningsprojekter og sundhedsdatavidenskabelige forskningsprojekter” (Komitéloven, kap. 4, § 14, stk. 3). We confirm that all methods were carried out in accordance with relevant guidelines and regulations. The original WISDM/REPLACE-BG/CINY protocols and informed consent forms were approved by the Institutional Review Boards. Written informed consent was obtained from each participant before enrollment. Independent data and safety monitoring boards provided trial oversight, reviewing unmasked safety data during the execution of the study.
Author Disclosure Statement
This research was funded by i-SENS, Inc., (Seoul, South Korea), and S.L.C.'s involvement with the company did not influence the design, implementation, or interpretation of the study. S.L.C. has received research funding from i-SENS, Inc., (Seoul, South Korea), which manufactures some of the product types discussed in this article. However, the study was conducted independently, and the authors declare that their involvement with i-SENS, Inc., (Seoul, South Korea), did not influence the findings or conclusions of the study.
Funding Information
The study was funded by i-SENS, Inc., (Seoul, South Korea).
Supplementary Material
Supplementary Figure S1
Supplementary Figure S2
Supplementary Figure S3
Supplementary Table S1
References
Supplementary Material
Please find the following supplemental material available below.
For Open Access articles published under a Creative Commons License, all supplemental material carries the same license as the article it is associated with.
For non-Open Access articles published, all supplemental material carries a non-exclusive license, and permission requests for re-use of supplemental material or any part of supplemental material shall be sent directly to the copyright owner as specified in the copyright notice associated with the article.
