




Abstract
Introduction:
This study examined associations between hypoglycemia awareness status and hypoglycemia symptoms reported in real-time using the novel Hypoglycaemia—MEasurement, ThResholds and ImpaCtS (Hypo-METRICS) smartphone application (app) among adults with insulin-treated type 1 (T1D) or type 2 diabetes (T2D).
Methods:
Adults who experienced at least one hypoglycemic episode in the previous 3 months were recruited to the Hypo-METRICS study. They prospectively reported hypoglycemia episodes using the app for 10 weeks. Any of eight hypoglycemia symptoms were considered present if intensity was rated between “A little bit” to “Very much” and absent if rated “Not at all.” Associations between hypoglycemia awareness (as defined by Gold score) and hypoglycemia symptoms were modeled using mixed-effects binary logistic regression, adjusting for glucose monitoring method and diabetes duration.
Results:
Of 531 participants (48% T1D, 52% T2D), 45% were women, 91% white, and 59% used Flash or continuous glucose monitoring. Impaired awareness of hypoglycemia (IAH) was associated with lower odds of reporting autonomic symptoms than normal awareness of hypoglycemia (NAH) (T1D odds ratio [OR] 0.43 [95% confidence interval {CI} 0.25–0.73], P = 0.002); T2D OR 0.51 [95% CI 0.26–0.99], P = 0.048), with no differences in neuroglycopenic symptoms. In T1D, relative to NAH, IAH was associated with higher odds of reporting autonomic symptoms at a glucose concentration <54 than >70 mg/dL (OR 2.18 [95% CI 1.21–3.94], P = 0.010).
Conclusion:
The Hypo-METRICS app is sensitive to differences in hypoglycemia symptoms according to hypoglycemia awareness in both diabetes types. Given its high ecological validity and low recall bias, the app may be a useful tool in research and clinical settings. The clinical trial registration number is NCT04304963.
Introduction
Hypoglycemia is the most common side effect of insulin therapy in diabetes management. 1 The fall in glucose levels occurring during a hypoglycemic episode leads to physiological changes, including the development of an array of symptoms which prompt corrective action such as carbohydrate ingestion to prevent severe hypoglycemia. 2,3 Hypoglycemia symptoms are often grouped into autonomic symptoms such as heart palpitations, shaking, and sweating, resulting from the activation of the autonomic nervous system 4,5 and neuroglycopenic symptoms, including headache, confusion, and dizziness, typically considered to manifest as a result of a significant reduction in glucose supply to the cerebral cortex. 6
It is known that the experience of hypoglycemia symptoms varies between and within individuals. 5,7 This can reflect underlying factors such as type of diabetes, awareness of hypoglycemia, actual blood glucose level, age or diabetes duration, as well as the situation during which the hypoglycemic episode occurs. 6,8 For example, people with impaired awareness of hypoglycemia (IAH) typically report hypoglycemia symptoms less frequently 9 and at lower glucose concentrations 10,11 than those with normal awareness of hypoglycemia (NAH). However, such studies reporting on hypoglycemia symptoms have commonly been limited by the use of controlled experimental conditions to induce hypoglycemia 11 or retrospective methods based on participants' recollection of a “typical” episode of hypoglycemia. 10,12 –14 While the use of ecological momentary assessment and smartphone technologies could address those limitations, 15 to the best of our knowledge, no such methods have been commonly used to record hypoglycemia symptoms in the hypoglycemia field.
In that respect, the Hypoglycaemia—MEasurement, ThResholds and ImpaCtS (Hypo-METRICS) smartphone application (app) is novel and overcomes previous limitations by allowing users to record episodes of hypoglycemia experienced in daily life and describe the glucose range and intensity of eight hypoglycemia symptoms at, or shortly after, an episode. 16 Recent quantitative evidence has demonstrated promising results in terms of its acceptability and validity with high completion rates (91%) and adequate psychometric properties (e.g., internal consistency, test-retest reliability) among participants with type 1 diabetes (T1D) or insulin-treated type 2 diabetes (T2D). 17
Qualitative evidence further supports this as the app was found to be “engaging,” “well designed,” and “easy to use” by study participants, with hypoglycemia-related questions and content deemed relevant and comprehensive. 18 While this is promising evidence, as the Hypo-METRICS app is a novel tool, it is essential to further validate it by examining whether differences in hypoglycemia symptoms experiences detected among people with diabetes using the app are consistent with previous evidence.
This study examined the validity of the Hypo-METRICS app by assessing the relationships between hypoglycemia awareness status, measured with the Gold questionnaire, and hypoglycemia symptoms, reported using the app, among adults with T1D or insulin-treated T2D.
Methods
The Hypo-METRICS study
The Hypo-METRICS observational study was conducted in five countries (United Kingdom, Austria, The Netherlands, Denmark, France) and across nine sites between October 2020 and August 2022, as part of the Hypo-RESOLVE project. 19 The study protocol detailing recruitment and data collection methods in full has been previously published. 20 Six hundred and two adults (18–85 years of age) with T1D or insulin-treated T2D who had at least one episode of hypoglycemia in the 3 months before the study were recruited. For 10 weeks, participants continuously wore a blinded continuous glucose monitor (CGM) device (Abbott Freestyle Libre 2™) and a sleep and activity tracking device (Fitbit Charge 4™). During the 10-week study period, participants also used the bespoke Hypo-METRICS app to record all episodes of hypoglycemia and report (1) whether they experienced hypoglycemia symptoms and (2) the intensity of these symptoms (see more detailed description in section ‘The Hypo-METRICS app: hypoglycemia symptom tracker’).
Full details of the design of the Hypo-METRICS app have been previously published. 16 Ethical approval for the study was granted by Oxford B Research Ethics Committee (United Kingdom), Commissie Mensgebonden Onderzoek (CMO) Region Arnhem-Nijmegen (Netherlands), Ethikkommission der Medizinischen Universität Graz (Austria), Videnskabsetisk Komite for Region Hovedstaden (Denmark), and Comite De Protection Des Personnes SUD Mediterrannee IV (France). All participants provided informed written consent for the study.
The Hypo-METRICS app: hypoglycemia symptom tracker
Hypo-METRICS participants were instructed to record episodes of hypoglycemia at, or shortly after the event, using the app hypoglycemia symptom tracker. This was any episode that participants identified as hypoglycemia where they had to take corrective action. This was defined as symptomatic episodes that resolved on carbohydrate ingestion and/or a measured glucose below 72 mg/dL. While using the app and blinded study CGM, participants continued their usual form and frequency of glucose monitoring.
The symptom tracker consists of a flower motif with 10 petals as shown in Figure 1. Each petal offered different options to indicate (1) the timing of the hypoglycemic episode (“Now,” “15 minutes ago,” “30 minutes ago,” “1 hour ago,” or “>1 hour ago”), (2) the glucose range at which participants were experiencing a hypoglycemic episode (“<36 mg/dL,” “36–53 mg/dL,” “54–70 mg/dL” or “ >70 mg/dL,” and (3) the intensity (“Not at all,” “A little bit,” “Somewhat,” “Quite a bit” or “Very much”) of eight hypoglycemic symptoms, described in the next section. Blood glucose range was further categorized into three groups: >70 mg/dL, 54–70 mg/dL, and <54 mg/dL. The <54 mg/dL category included events reported at 36–53 mg/dL and <36 mg/dL, which were collapsed due to the small proportion of hypoglycemic episodes reported at the lowest glucose range (2% of episodes reported <36 mg/dL).

The Hypo-METRICS symptom tracker.
Study sample
Hypo-METRICS participants were included in the present analysis if they reported at least one episode of hypoglycemia during the 10-week period using the symptom tracker and recorded a corresponding glucose range.
Outcome: hypoglycemia symptoms
Two categories of hypoglycemic symptoms were considered: autonomic (sweating, heart palpitations, shaking, and hunger) and neuroglycopenic (headache, difficulties in movement and coordination, difficulties speaking, and confusion). 21 For each hypoglycemia episode reported, autonomic and/or neuroglycopenic symptom presence was coded as “yes” if the intensity reported by the participant for any of the autonomic and/or neuroglycopenic symptoms was “A little bit,” “Somewhat,” “Quite a bit” or “Very much,” and “no” if the intensity reported for any of the autonomic and/or neuroglycopenic symptoms was “Not at all.”
Exposure: hypoglycemia awareness
The exposure variable was hypoglycemia awareness status, assessed at the first study visit using the validated Gold questionnaire. 22 Participants could respond using a Likert scale ranging from 1 (always aware) to 7 (never aware). Participants were categorized as having IAH if their Gold score was ≥4 and NAH if their Gold score was <4.
Statistical analysis
Descriptive analysis was used to describe participants' baseline characteristics. Categorical variables are presented as frequencies and percentages. Continuous variables are presented as median and interquartile range as data were skewed.
As there were repeated measurements for each participant (i.e., multiple hypoglycemia episodes reported), mixed-effects binary logistic regression models adjusted for diabetes duration (in years) and glucose monitoring method (Flash/CGM vs. capillary blood glucose monitoring) were used to estimate the associations between hypoglycemia awareness and the presence of autonomic and neuroglycopenic symptoms. Further, the results were stratified by hypoglycemia awareness status to investigate the relationships between glucose monitoring method and symptoms reporting. Finally, in a subanalysis of symptomatic episodes, mixed-effects multinomial logistic regression models were used to examine the associations between hypoglycemia awareness and blood glucose ranges reported. All analyses were conducted separately for participants with T1D and T2D using R (R V.4.2.2 and R Studio V. 2023.06.2 for Windows).
Results
There were 602 participants recruited in the Hypo-METRICS study. Five hundred and fifty-two participants submitted at least one episode of hypoglycemia using the Hypo-METRICS app symptom tracker. Of those, 531 reported a glucose range for their hypoglycemia episodes and were included in the present analyses (Fig. 2).
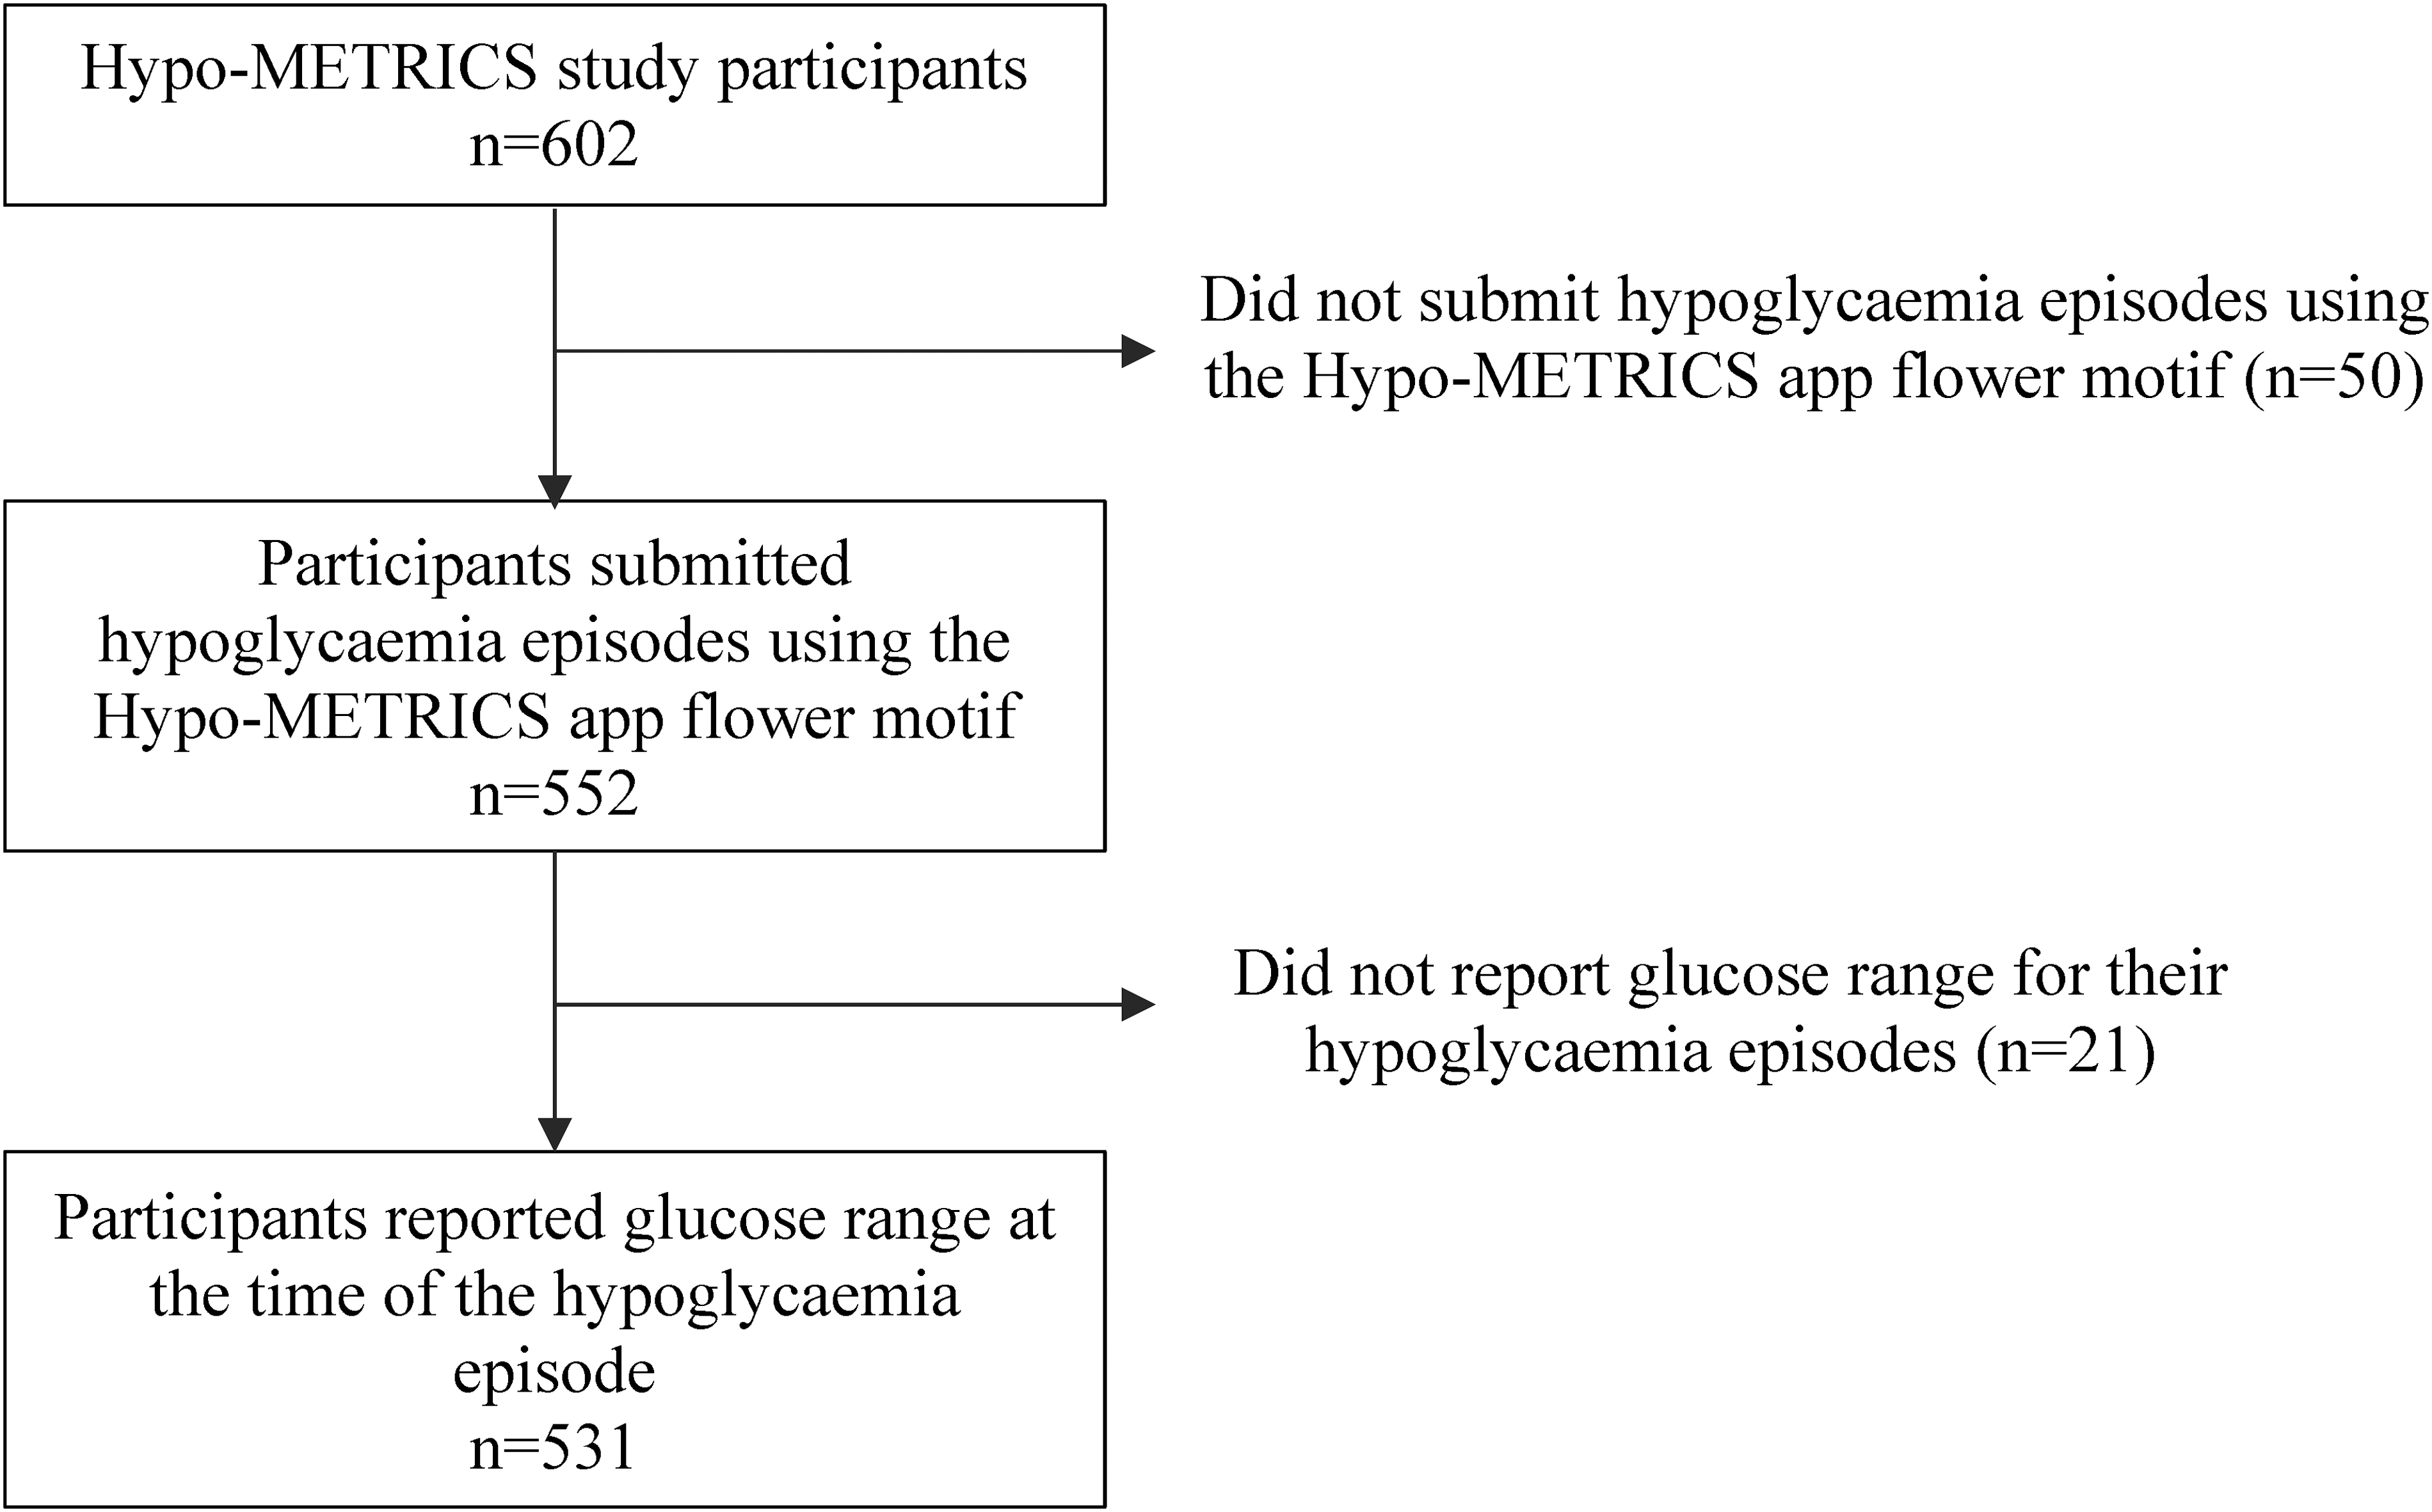
Flowchart of study participation.
Participants' characteristics
Baseline characteristics of participants are shown in Table 1. Over a fifth of those with T1D or T2D had IAH. The majority of participants with T1D were women and in full-time employment, while most with T2D were men and retired. In both T1D and T2D, participants were predominantly white. Participants with T1D were mainly using Flash or CGM at baseline (and continued its use alongside the study CGM) while those with T2D mainly used capillary blood glucose monitoring.
Participants' Baseline Characteristics
HbA1c, hemoglobin A1c; IAH, impaired awareness of hypoglycemia; IQR, interquartile range; NAH, normal awareness of hypoglycemia.
Characteristics of hypoglycemic episodes
Overall, there were 11,011 hypoglycemic episodes reported using the symptom tracker (Table 2). Of those, most (56%) were reported by participants with T1D and NAH. Most hypoglycemic episodes reported during the study were symptomatic (81%) and experienced at the 54–70 mg/dL glucose range (62%). Of all episodes recorded, the most commonly reported symptoms were autonomic: hunger (50%), shaking (47%), sweating (37%), and heart palpitations (33%).
Characteristics of Hypoglycemia Episodes Recorded During the Study
IAH, impaired awareness of hypoglycemia; NAH, normal awareness of hypoglycemia.
Associations between hypoglycemia awareness and hypoglycemia symptoms
IAH was associated with lower odds of reporting autonomic symptoms compared to NAH in both T1D and T2D, as shown in Table 3. Analysis of individual symptoms showed that IAH compared to NAH was associated with lower odds of shaking (odds ratio [OR] 0.57 [0.32, 1.01], P = 0.05) and hunger (OR 0.48 [0.27, 0.85], P = 0.012) in T1D and shaking (OR 0.47 [0.27, 0.84], P = 0.011) and sweating (OR 0.49 [0.27, 0.88], P = 0.017) in T2D. No differences were found in the odds of reporting neuroglycopenic symptoms according to hypoglycemia awareness in either diabetes type (Table 3).
Associations Between Hypoglycemia Awareness and Hypoglycemia Symptoms in Type 1 and Type 2 Diabetes
Bold values refer to the OR for the reference group (i.e. NAH).
Models adjusted for method of glucose monitoring and diabetes duration.
CI, confidence interval; OR, odds ratio.
In T1D, for both IAH and NAH groups, there were no differences in autonomic symptoms reported by method of glucose monitoring. In T2D, in NAH but not IAH, using Flash/CGM was associated with lower odds of reporting autonomic symptoms compared to capillary blood glucose monitoring (Supplementary Table S1). A similar pattern was observed for neuroglycopenic symptoms, as shown in Supplementary Table S1.
At glucose >70 mg/dL, T1D with IAH was associated with lower odds (0.14 [0.05–0.43], P < 0.001) of reporting autonomic symptoms compared to NAH. When autonomic symptoms were reported, IAH was associated with higher odds (2.18 [1.21–3.94], P = 0.010) of recording a glucose <54 than >70 mg/dL compared to NAH in participants with T1D (Table 4). In T2D, there were no differences in the odds of reporting autonomic symptoms at glucose >70 mg/dL. IAH was associated with higher odds of reporting a glucose <54 than >70 mg/dL for autonomic symptoms in T2D but this did not reach statistical significance (P = 0.18). There were no differences in the blood glucose ranges reported for neuroglycopenic symptoms according to hypoglycemia awareness in either type of diabetes.
Associations Between Hypoglycemia Awareness and Glucose Range Reported for Autonomic Symptoms in Type 1 and Type 2 Diabetes
Bold values refer to the OR for the reference group (i.e. NAH).
Models adjusted for method of glucose monitoring and diabetes duration.
>70 mg/dL is the Reference Glucose Range.
Discussion
The Hypo-METRICS app allowed adults with insulin-treated diabetes to provide information about glucose values and symptoms experienced during hypoglycemia in real time. This study has shown that most episodes reported using the app were symptomatic and that autonomic symptoms were the most frequently reported in both T1D and T2D. Participants with IAH were significantly less likely to report autonomic symptoms (shaking and hunger in T1D and shaking and sweating in T2D) compared to those with NAH. Moreover, when autonomic symptoms were reported, participants with T1D and IAH were more likely to report them at a lower glucose concentration than those with NAH. No differences were found in neuroglycopenic symptoms reporting according to hypoglycemia awareness in either T1D or T2D.
This study shows that the vast majority of episodes of hypoglycemia recorded using the Hypo-METRICS app symptom tracker were symptomatic, even among participants with IAH. This may reflect the fact that app data were collected when participants knew they were experiencing an episode of hypoglycemia and, by collecting data at the time of episodes, this is likely to enhance reporting of symptomatic episodes. Nevertheless, results of the present study are in line with previous evidence that hypoglycemia awareness is a continuum and that total loss of symptomatic response is rather uncommon. 10,23,24
The most commonly reported symptoms in the overall sample were autonomic: hunger and shaking followed by sweating and heart palpitations. The predominance of autonomic symptoms is consistent with previous research in T1D 5,25 and T2D. 13,26 This aligns with the evidence that autonomic symptoms are typically the first ones to manifest as early warning signs of hypoglycemia, before the onset of neuroglycopenic symptoms, 3,23 thus more likely to be recognized first by people with diabetes and reported more commonly than their neuroglycopenic counterparts.
Data from the app demonstrate that participants with IAH were less likely to report autonomic symptoms than those with NAH, with no differences in neuroglycopenic symptoms in both T1D and T2D. This finding is consistent with previous studies that have shown a lower proportion of hypoglycemic episodes with autonomic symptoms in IAH than NAH, 9 lower mean autonomic symptom intensity score in IAH than NAH, 27,28 and no differences in neuroglycopenic symptoms between groups. 27 –29 However, those studies used overall autonomic and neuroglycopenic scores or percentages and did not examine the odds of individual symptoms nor did they investigate the impact of glucose monitoring method.
The present study therefore adds to the understanding by showing that differences in autonomic symptoms between IAH and NAH may be driven by differences in shaking and hunger for T1D and shaking and sweating for T2D, as suggested by the analysis of individual symptoms. The results also suggest that in T2D, the relationships between Flash/CGM use and hypoglycemia symptom reporting vary according to awareness status.
Finally, it was shown that, relative to participants with T1D and NAH, those with IAH were more likely to report lower glucose concentrations for their autonomic symptoms. No such significant differences in the glucose ranges were observed in participants with T2D, which may be reflective of the lower number of hypoglycemic episodes in that group. Nevertheless, our results in adults with T1D are in keeping with the findings of a retrospective questionnaire study conducted by Hendrieckx et al., 10 showing that 30% of participants with T1D and IAH recognized autonomic symptoms when glucose was <45 mg/dL while 47% of those with NAH recognized autonomic symptoms when glucose was ≥63 mg/dL. Overall, our findings not only align with previous research but also with the pathophysiology of IAH involving a decreased autonomic response and a shift toward lower glucose concentrations before symptoms are recognized. 2,30
The main strength of this study is that the symptoms examined were based on clinical episodes of hypoglycemia reported at, or shortly after the episode, using the Hypo-METRICS app, thus minimizing the risk of recall bias and reflecting more accurately real-time clinical hypoglycemia experience. Further, the results were based on robust data as an overall large number of episodes of hypoglycemia were reported (n = 11,011) over an extensive study duration (n = 10 weeks) and in a large study sample (n = 531). Finally, the use of a multilevel design for the present study allowed to account for the fact that a participant could report multiple hypoglycemic episodes during the study and thus account for within-individual variability while adjusting for method of glucose monitoring and diabetes duration.
This study is, however, limited by the fact that only eight symptoms could be reported using the app, and while those were carefully selected in accordance with a patient advisory committee, previous literature, and expert consensus, they may not represent the full range of hypoglycemia symptoms that adults with diabetes experience in daily life. Future versions of the app will, however, allow users to have a greater variety of symptoms to select from. In addition, although the Hypo-METRICS study was conducted across five different countries, the predominant ethnic group was white, which may limit the generalizability of the results to other ethnic groups. Our study may also be limited by the fact that it was partly conducted during the COVID-19 pandemic, which may have impacted on daily life patterns and glycemic management and thus, the usage of the app and frequency of hypoglycemia episodes and symptoms reported.
To conclude, the Hypo-METRICS app, which allows real-time interactive recording of hypoglycemia episodes experienced in daily life, is sensitive to differences in hypoglycemia symptoms reporting according to hypoglycemia awareness and blood glucose range. The detected differences in hypoglycemia symptoms experiences were consistent with the pathophysiology of IAH and previous research evidence in people with IAH. This study thus further validates the use of the Hypo-METRICS app as a tool with potential research, educational and clinical applications.
Footnotes
Acknowledgments
We thank the people with diabetes who participated in the Hypo-METRICS study and the site personnel involved in participant recruitment at each of the clinical centers. We are grateful to the Hypo-RESOLVE Patient Advisory Committee for their support in the development of the Hypo-METRICS study. We also thank Abbott Diabetes Care for providing the CGM used in the study and uMOTIF Limited for providing the platform for the Hypo-METRICS app.
Authors' Contributions
Conceptualization: G.M.-E., P.D., N.Z., U.S., M.B., S.A., and P.C. Data curation: G.M.-E. and M.G. Formal analysis: G.M.-E. Funding acquisition: B.d.G., U.P.-B., R.J.M., E.R., S.H., M.E., J.K.M., S.A.A., J.S., F.P., and P.C. Investigation: G.M.-E., N.Z., and P.D. Methodology: G.M.-E., P.D., N.Z., P.M.B., U.S., M.B., S.A., and P.C. Project administration: G.M.-E., N.Z., P.D., U.S., M.B., B.d.G., U.P.-B., R.J.M., E.R., S.H., M.E., J.K.M., S.A.A., J.S., F.P., and P.C. Resources: B.d.G., U.P.-B., R.J.M., E.R., S.H., M.E., J.K.M., S.A.A., J.S., and F.P., P.C. Software: G.M.-E. and M.G. Supervision: S.A., P.C. Validation: G.M.-E., N.Z., P.D., S.A., P.C. Visualization: G.M.-E. Writing–original draft: G.M.-E. Writing–review and editing: G.M.-E., N.Z., P.D., U.S., M.B., P.M.B., Z.M., M.G., N.A., E.J.A., B.d.G., J.B., U.P.-B., A.A., R.J.M., E.R., S.H., M.E., M.C., J.K.M., S.A.A., J.S., F.P., and P.C.
Author Disclosure Statement
G.M.E.'s position at King's College London is funded by a research grant from Novo Nordisk as part of their contribution to the Hypo-RESOLVE consortium. S.A.A. has served on advisory boards for Novo Nordisk and Medtronic and has spoken at an educational symposium sponsored by Sanofi. M.L.E. has served on advisory boards and/or received lecture fees and/or research support from Novo Nordisk, Eli Lilly, AstraZeneca, Medtronic, Dexcom, Ypsomed, Abbott Diabetes Care, Roche, NGM Pharma, Zucara, and Pila Pharma. U.P.B. has served on advisory boards and has received lecture fees from Sanofi and Novo Nordisk.
J.K.M. is a member of RM and has served on advisory boards of Abbott Diabetes Care, Becton-Dickinson, Boehringer Ingelheim, Eli Lilly, Embecta, Medtronic, Novo Nordisk A/S, Roche Diabetes Care, Sanofi-Aventis, and Viatris and has received speaker honoraria lecture fees from A. Menarini Diagnostics, Abbott Diabetes Care, AstraZeneca, Boehringer Ingelheim, Dexcom, Eli Lilly, Medtrust, MSD, Novo Nordisk A/S, Roche Diabetes Care, Sanofi, Servier, Sanofi, and Ypsomed. She is shareholder of decide Clinical Software GmbH and elyte Diagnostics where she also serves as CMO Novo Nordisk. B.D.G. has received research support from Novo Nordisk. E.R. has served as consultant/advisor for Abbott, Air Liquide SI, Astra-Zeneca, Boehringer-Ingelheim, Dexcom, Eli-Lilly, Hillo, Insulet, Medirio, Novo-Nordisk, Roche, Sanofi-Aventis, and Tandem, and received research support from Dexcom and Tandem.
J.S. has served on advisory boards for Janssen, Medtronic, Roche Diabetes Care, and Sanofi Diabetes; her research group (Australian Centre for Behavioural Research in Diabetes [ACBRD]) has received honoraria for this advisory board participation and has also received unrestricted educational grants and in-kind support from Abbott Diabetes Care, AstraZeneca, Medtronic, Roche Diabetes Care, and Sanofi Diabetes. JS has also received sponsorship to attend educational meetings from Medtronic, Roche Diabetes Care, and Sanofi Diabetes, and consultancy income or speaker fees from Abbott Diabetes Care, AstraZeneca, Medtronic, Novo Nordisk, Roche Diabetes Care, and Sanofi Diabetes. P.C. has received personal fees Abbott Diabetes Care, Insulet, Dexcom, Novo Nordisk, AstraZeneca, Medtronic, Roche Diabetes Care, and Sanofi Diabetes. Research funding support from Abbott Diabetes Care, Medtronic, and Novo Nordisk.
Funding Information
Hypo-RESOLVE has received funding from the Innovative Medicines Initiative 2 Joint Undertaking (JU) under grant agreement No 777460. The JU receives support from the European Union's Horizon 2020 research and innovation program and EFPIA and T1D Exchange, JDRF, International Diabetes Federation (IDF) and The Leona M. and Harry B. Helmsley Charitable Trust. The industry partners supporting the JU include Abbott Diabetes Care, Eli Lilly, Medtronic, Novo Nordisk and Sanofi-Aventis. The funder had no role in the design of the project or its WPs, the collection or analysis of data, the writing of the article or the decision to submit for publication. This study represents independent research supported by the National Institute for Health and Care Research (NIHR) King's Clinical Research Facility and the NIHR Biomedical Research Centers at South London and Maudsley NHS Foundation Trust and King's College London and Cambridge.
The University of Cambridge has received salary support for MLE through the National Health Service in the East of England through the Clinical Academic Reserve. The views expressed are those of the author(s) and not necessarily those of the NHS, the NIHR or the Department of Health and Social Care.
Supplementary Material
Supplementary Table S1
References
Supplementary Material
Please find the following supplemental material available below.
For Open Access articles published under a Creative Commons License, all supplemental material carries the same license as the article it is associated with.
For non-Open Access articles published, all supplemental material carries a non-exclusive license, and permission requests for re-use of supplemental material or any part of supplemental material shall be sent directly to the copyright owner as specified in the copyright notice associated with the article.
