
Abstract
Background:
Despite new pharmacotherapy, most patients with long-term type 2 diabetes are still hyperglycemic. This could have been solved by insulin with its unlimited potential efficacy, but its dynamic physiology demands frequent titrations which are overdemanding. This report provides a real-life account for a scalable transformation of diabetes care in a community-based endocrinology center by harnessing artificial intelligence-based autonomous insulin titration.
Methods:
The center embedded the d-Nav® technology and its dedicated clinical support. Reported outcomes include treatment efficacy/safety in the first 600 patients and use of cardiorenal-risk reduction pharmacotherapy.
Findings:
Patients used d-Nav for 8.2 ± 3.0 months with 82% retention. Age was 67.1 ± 11.5 years and duration of diabetes was 19.8 ± 11.0 years. During the last 3 years before d-Nav, glycated hemoglobin (HbA1c) had been overall higher than 8% and at the beginning of the program it was as high as 8.6% ± 2.1% with 29.3% of the patients with HbA1c >9%. With d-Nav, HbA1c decreased to 7.3% ± 1.2% with 5.7% of patients with HbA1c >9%. During the first 3 months, d-Nav reduced total daily dose of insulin in one of every five patients due to relatively low glucose levels to minimize the risk of hypoglycemia. Glucagon like peptide 1 (GLP-1) receptor agonists or dual GLP-1 and Glucose-dependent insulinotropic polypeptide (GIP) receptor agonists were prescribed in about a half of the patients and sodium glucose cotransporter 2 inhibitor in a third. The frequency of hypoglycemia (<54 mg/dL) was 0.4 ± 0.6/month and severe hypoglycemia 1.7/100-patient-years.
Interpretation:
The use of d-Nav allowed for improvement in overall diabetes management with appropriate use of both insulin and noninsulin pharmacologic agents in a scalable way.
Introduction
Modern type 2 diabetes management encompasses two parallel treatment strategies, the glycemic-management focused, and the cardiorenal-risk focused. More than 10 different pharmacological classes are available now, targeting different pathways with clinical advantages in specific situations. Management algorithms have been put in place to guide the clinician in each situation. 1 The cardiorenal-risk strategy, however, has not resolved the glycemic-management challenge. Regardless of the pharmacological choices, glycemia is still a main predictor of prognosis. While the survival of a patient living with glycated hemoglobin (HbA1c) of 6.5%–7% (48–53 mmol/mol) is similar to individuals without diabetes, the survival of a patient who lives with HbA1c >9% (>75 mmol/mol) is similar to individuals with advanced colon or breast carcinomas. 2,3
Despite new pharmacological agents, the average HbA1c in patients with type 2 diabetes has only slightly improved. 4 For example, the average HbA1c in patients who use glucagon-like peptide receptor agonists (GLP-1RA) is about 8% (about 64 mmol/mol) and more than 15% live with HbA1c >9% (>75 mmol/mol). 5 This has been worse in patients with a long-term disease, due to the progressive nature of insulin deficiency and the finite efficacy of noninsulin agents.
Insulin therapy is typically used as a rescue drug. More than a quarter of patients with type 2 diabetes have been prescribed insulin and this proportion has not changed since the early 2000s. 6 Compared to other agents, it has a nearly unlimited potential efficacy. Therefore, in theory, insulin therapy should have rescued most patients with long-standing diabetes. But in reality, most patients who use insulin fail to achieve and maintain the therapy goals and live with significantly elevated HbA1c levels. 7
A major reason for the failure of insulin therapy in practice is the highly dynamic nature of the hormone's physiological requirements. Without frequent titration of doses, patients remain either underdosed or overdosed. 8,9 The most direct solution for this pharmacological constraint was found in harnessing artificial intelligence (AI) to deliver autonomous frequent insulin titration. The hybrid closed-loop system or automated insulin delivery (AID) autonomously titrates insulin as frequently as every 5 min and has transformed insulin pump therapy. 10 Despite the steady increase in use of AID, their cost and complexity may still be limiting implementation. Among patients with type 1 diabetes, who are more readily covered by insurance programs, only ∼35% use AID systems in United States, 11 and its use in patients with type 2 diabetes is just starting to be explored. 12
The d-Nav® insulin management technology allows for autonomous titration of doses as often as needed in patients who inject insulin. Thus, it offers a simple to use solution to the large population of patients who inject insulin with pens or syringes for type 2 diabetes. 8,13
This report provides a real-life account for a scalable transformation of type 2 diabetes care in a busy community-based endocrinology center in the United States by harnessing AI, in the form of d-Nav Insulin Management. In this report, we provide information from the first 600 patients who were prescribed with d-Nav.
Materials and Methods
Population and clinic processes
The Endocrinology, Diabetes and Metabolism Center, Physicians East PA, Greenville, North Carolina, USA, is staffed by four endocrinologists and two physician assistants. It serves as a regional referral center and provides care to a highly diverse population. The Endocrinology Center treats about 2000 patients with type 2 diabetes who use insulin.
The embedded d-Nav program includes the d-Nav technology as well as clinical support. Patients were prescribed d-Nav during their scheduled ambulatory appointments if they had type 2 diabetes and injected insulin with pens or syringes. Once a prescription was made, an onsite d-Nav specialist would set up the patient with the technology and provide training. Then, an offsite virtual clinical support team would monitor the patient's progress and communicate with them routinely. The marked improvement in glycemic control with the effective use of insulin has freed the clinicians to choose noninsulin antidiabetes pharmacotherapy based on nonglycemic indications. The time saved during appointments and incoming clinic phone calls, that would have been utilized to manage insulin, has allowed the providers to space out scheduled appointments and accept new referrals. In turn, the primary care service of the institution was notified about the program to promote new referrals.
We obtained de-identified data that had been generated from d-Nav users between October 2022 and September 2023. The data were acquired retrospectively and were limited to secondary use of nonidentifiable information previously collected during normal clinical care. Thus, the study was exempt from the approval of the Institutional Review Board.
The d-Nav insulin management technology
The d-Nav insulin management technology has been FDA cleared and in commercial use in the United States since 2019 and in Europe for more than a decade. Descriptions and validations of the technology as a standard of care for glycemic management and hypoglycemia prevention in patients with type 2 diabetes can be found elsewhere, 14 including data on long-term adherence. 13,15 In brief, patients prescribed with the d-Nav program are provided with a phone application (“app”) called d-Nav. Patients use their own glucometer or continuous glucose monitor (CGM) to measure glucose concentrations before each insulin injection, and d-Nav provides a recommended dose. The AI within d-Nav assesses each patient's responses to his or her current insulin doses by analyzing glucose patterns and titrates doses at least weekly.
The AI autonomously adjusts each patient's insulin doses to reach a clinically achievable balance between preventing hyperglycemia and preventing hypoglycemia. If insulin requirements drop or hypoglycemia ensues, d-Nav makes immediate recommendation for reduction of the relevant doses as often as needed, following the safety-first approach of prioritizing the avoidance of hypoglycemia. d-Nav supports four common insulin regimens, basal-only, premix insulin twice a day, and basal-bolus insulin therapy with or without carbohydrate counting.
The d-Nav program includes an implementation team and dedicated clinical support, performed by health care providers trained to become d-Nav specialists. 13 The implementation team handles onboarding of patients selected by their providers, and the support team follows-up with patients through telephone calls or in-person meetings, monitors the patient's progress, boosts user confidence, corrects usage errors, and answers questions related to insulin usage. Providers who prescribe the d-Nav program for their patients can review each patient's insulin doses and glucose data at any given time, allowing them to handle all other medications for diabetes and any comorbid conditions. The d-Nav program is covered by most health plans, including Medicare. The use of the d-Nav App is reimbursed via CPT codes 0740T and 0741T, while the clinical support time is reimbursed via Remote Physiological Monitoring CPT codes 99457 and 99458.
Outcomes
The primary outcome of this study was the average HbA1c changes during time on the d-Nav program. Additional outcomes included weekly mean glucose, the frequency of hypoglycemia events <54 mg/dL (<3 mmol/L), the frequency of severe hypoglycemia, total daily insulin, time-in-range (TIR)-based CGM data in the patients using CGM, the use of noninsulin antidiabetes medications, patients' withdrawal, and patients' satisfaction. The latter was achieved by a routine administration of established d-Nav satisfaction questionnaires 13 on 50 consecutive patients coming for routine follow-ups.
Statistical analyses
Results are presented as mean ± standard deviation (SD). A P-value <0.05 was defined as statistically significant. Standard error of mean was used in the HbA1c graph for clearer illustration of the results. The Kolmogorov-Smirnov test was used to assess the normality of distributions. The chi-square test was used to compare the distribution of patients with decrease in total daily insulin. The Kruskal-Wallis, coupled with the Dunn's multiple comparisons tests, was used to analyze between-group differences in HbA1c, mean weekly glucose, total daily insulin, hypoglycemia frequency, and TIR.
Results
In this report, we provide information from the first 600 patients who were prescribed d-Nav in the endocrinology clinic. Table 1 shows demographics and key clinical characteristics. Of the patients, 52.8% were men, mean age (±SD) was 67.1 ± 11.5 years, duration of diabetes was 19.8 ± 11.0 years, of which 11.9 ± 10.0 years was on insulin. The population was of diverse ethnicity with 46.2% non-Caucasians. Of the patients, 36.0% have had a cardiovascular disease and 20.5% have had nephropathy. Two hundred eighty-nine patients were enrolled in the program in its first 90 days, and 600 patients were enrolled by month 9.
Demographics and Key Clinical Differences
GIP, Glucose-dependent insulinotropic polypeptide; GLP-1, glucagon like peptide 1; SD, standard deviation; SGLT2, sodium glucose cotransporter 2.
On average, patients were followed on the d-Nav program for 8.2 ± 3.0 months, corresponding to about 21,300 autonomous insulin dose titrations (about weekly for each patient) and 384,000 individual autonomous dose recommendations (on average 2.6 dose recommendations per patient per day). For comparison, the average age of the 1,103 patients with type 2 diabetes on insulin, who were not on d-Nav during the time of the study (either not prescribed in the first 600, or not prescribed at all) was slightly younger than the d-Nav cohort (66.0 ± 12.0 vs. 67.1 ± 11.5; P = 0.04).
Retention was 82.0% while withdrawals on average occurred 4.8 ± 3.1 months from the d-Nav setup (median ± interquartile range 5.0 ± 2.1). Patient-related reasons, such as a patient choice to stop the program or stop using d-Nav, was the main reason and accounted for 65.7% of the withdrawals. Clinical reasons such as the initiation of insulin pump therapy accounted for 20.4% of the withdrawals. The coinsurance cost of the program accounted for 13.9% of the withdrawals. Of the 18% patients who withdrew, half had a follow-up HbA1c on d-Nav, which was incorporated in the HbA1c analysis below. Five patients died during the follow-up, corresponding to a mortality rate of 1.2 per 100 patient-years. One patient died of Hodgkin's lymphoma, one of myocardial infarction, one of pneumonia, one of stroke, and one of sudden death.
Latest insulin regimens while on d-Nav were basal-only in 25.7% of the patients, premix insulin in 32.0%, and basal-bolus in 42.3% (Table 1). Based on the d-Nav information, the endocrinology team decided to change insulin regimens in 88 patients (14.7% of the cohort). In 16 patients (2.9%), regimens were changed from basal-only to either basal-bolus (0.8%) or premix insulin (1.8%), since it was suspected that the patients had become too insulin deficient to respond to a basal-only regimen. 16 Of the patients starting d-Nav with basal-bolus insulin therapy, 37 (6.2%) were converted to premix insulin twice a day due to challenges in measuring glucose and injecting insulin four times a day. This regimen simplification was achievable due to the known equivalent safety and efficacy of the two regimens in d-Nav users, as also seen in this cohort (see HbA1c dynamics and Fig. 2C). 8
Initial HbA1c was available in 99.8% of the patients and in 80.2% during the first 6 months. During the last 3 years before d-Nav, HbA1c had been overall higher than 8%, and at the beginning of the program, it was as high as 8.6% ± 2.1% (70 ± 12.9 mmol/mol) with 29.3% of the patients with HbA1c >9% (>75 mmol/mol). During the first 3 months on d-Nav, HbA1c decreased to 7.5% ± 1.5% (58 ± 9.3 mmol/mol), and after 6 months, it was further decreased to 7.3% ± 1.2% (56 ± 7.5 mmol/mol; P < 0.0001), with only 5.7% having an HbA1c >9% (>75 mmol/mol) (Fig. 1A, C).
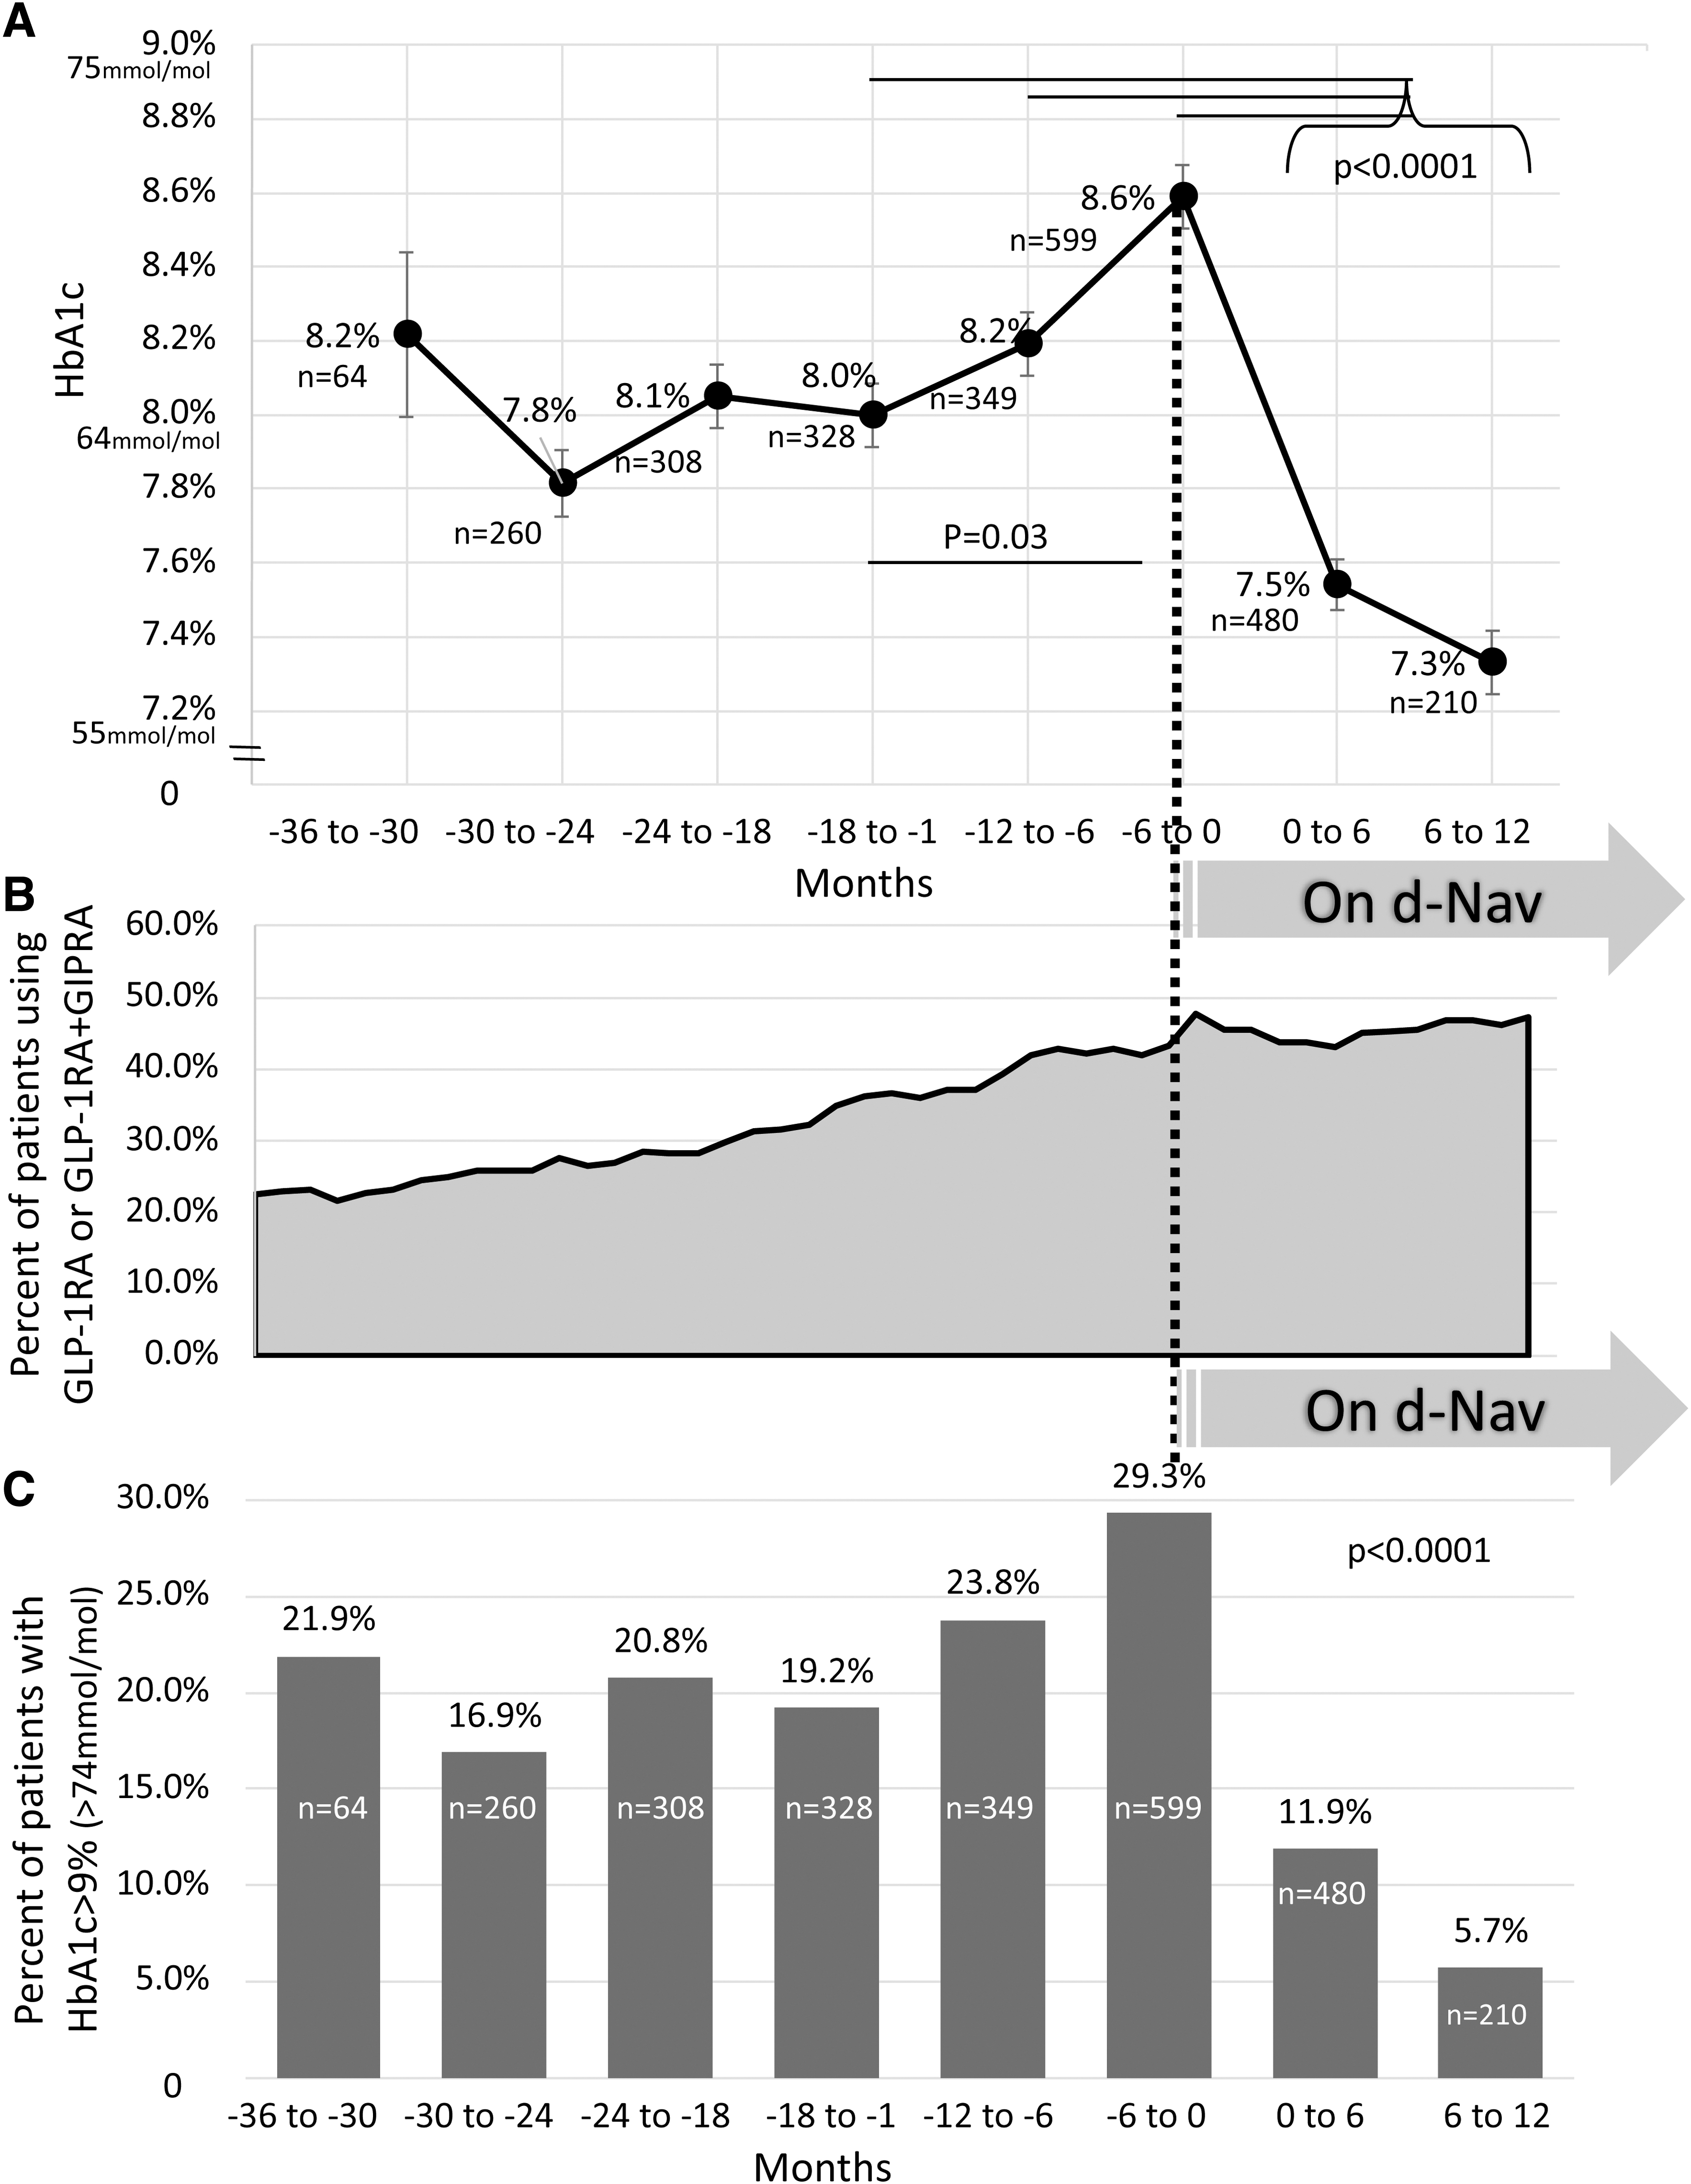
HbA1c history and background GLP-1RA and dual GLP-1RA+GIPRA prescriptions, in 600 patients using d-Nav®, during the 3 years before and during the use of d-Nav.
The initial (pre-d-Nav) HbA1c in the African American group (n = 223) was significantly higher than the Caucasian (n = 323) (9.2% ± 2.3% vs. 8.1% ± 1.8%, respectively; P < 0.0001). Given the expected gradual decrease in HbA1c over time in d-Nav users, 15 similar HbA1c reductions were seen in both groups at 0 to 6 months, 1.0% ± 1.6% versus 1.2% ± 12.1%, respectively (P = 0.6).
During the last 3 years before d-Nav, the percent of patients with HbA1c <8% (<64 mmol/mol) and <7% (<53 mmol/mol) had both deteriorated to 45.0% and 22.2%, respectively. On d-Nav, the percentage of patients with HbA1c <8% (<64 mmol/mol) and <7% (<53 mmol/mol) had both improved to 76.7% and 38.6%, respectively (Supplementary Fig. S1). Similar HbA1c improvements were seen in all regimens (basal-only, premix and basal-bolus; P = 0.6).
Weekly mean glucose decreased gradually from about 175 mg/dL (9.7 mmol/L) to about 150 mg/dL (8.3 mmol/L) (Fig. 2A). More significant reduction from about 200 mg/dL (11.1 mmol/L) to 155 mg/dL (8.6 mmol/L) was seen in patients who had weekly mean glucose of >150 mg/dL (>8.3 mmol/L) during the first week. As expected, in patients who started d-Nav with weekly mean glucose ≤150 mg/dL (≤8.3 mmol/L), weekly mean glucose did not change during the follow-up and remained at about 140 mg/dL (7.8 mmol/L). In the 18% patients who withdrew from the program, weekly mean glucose did not change significantly during their participation.
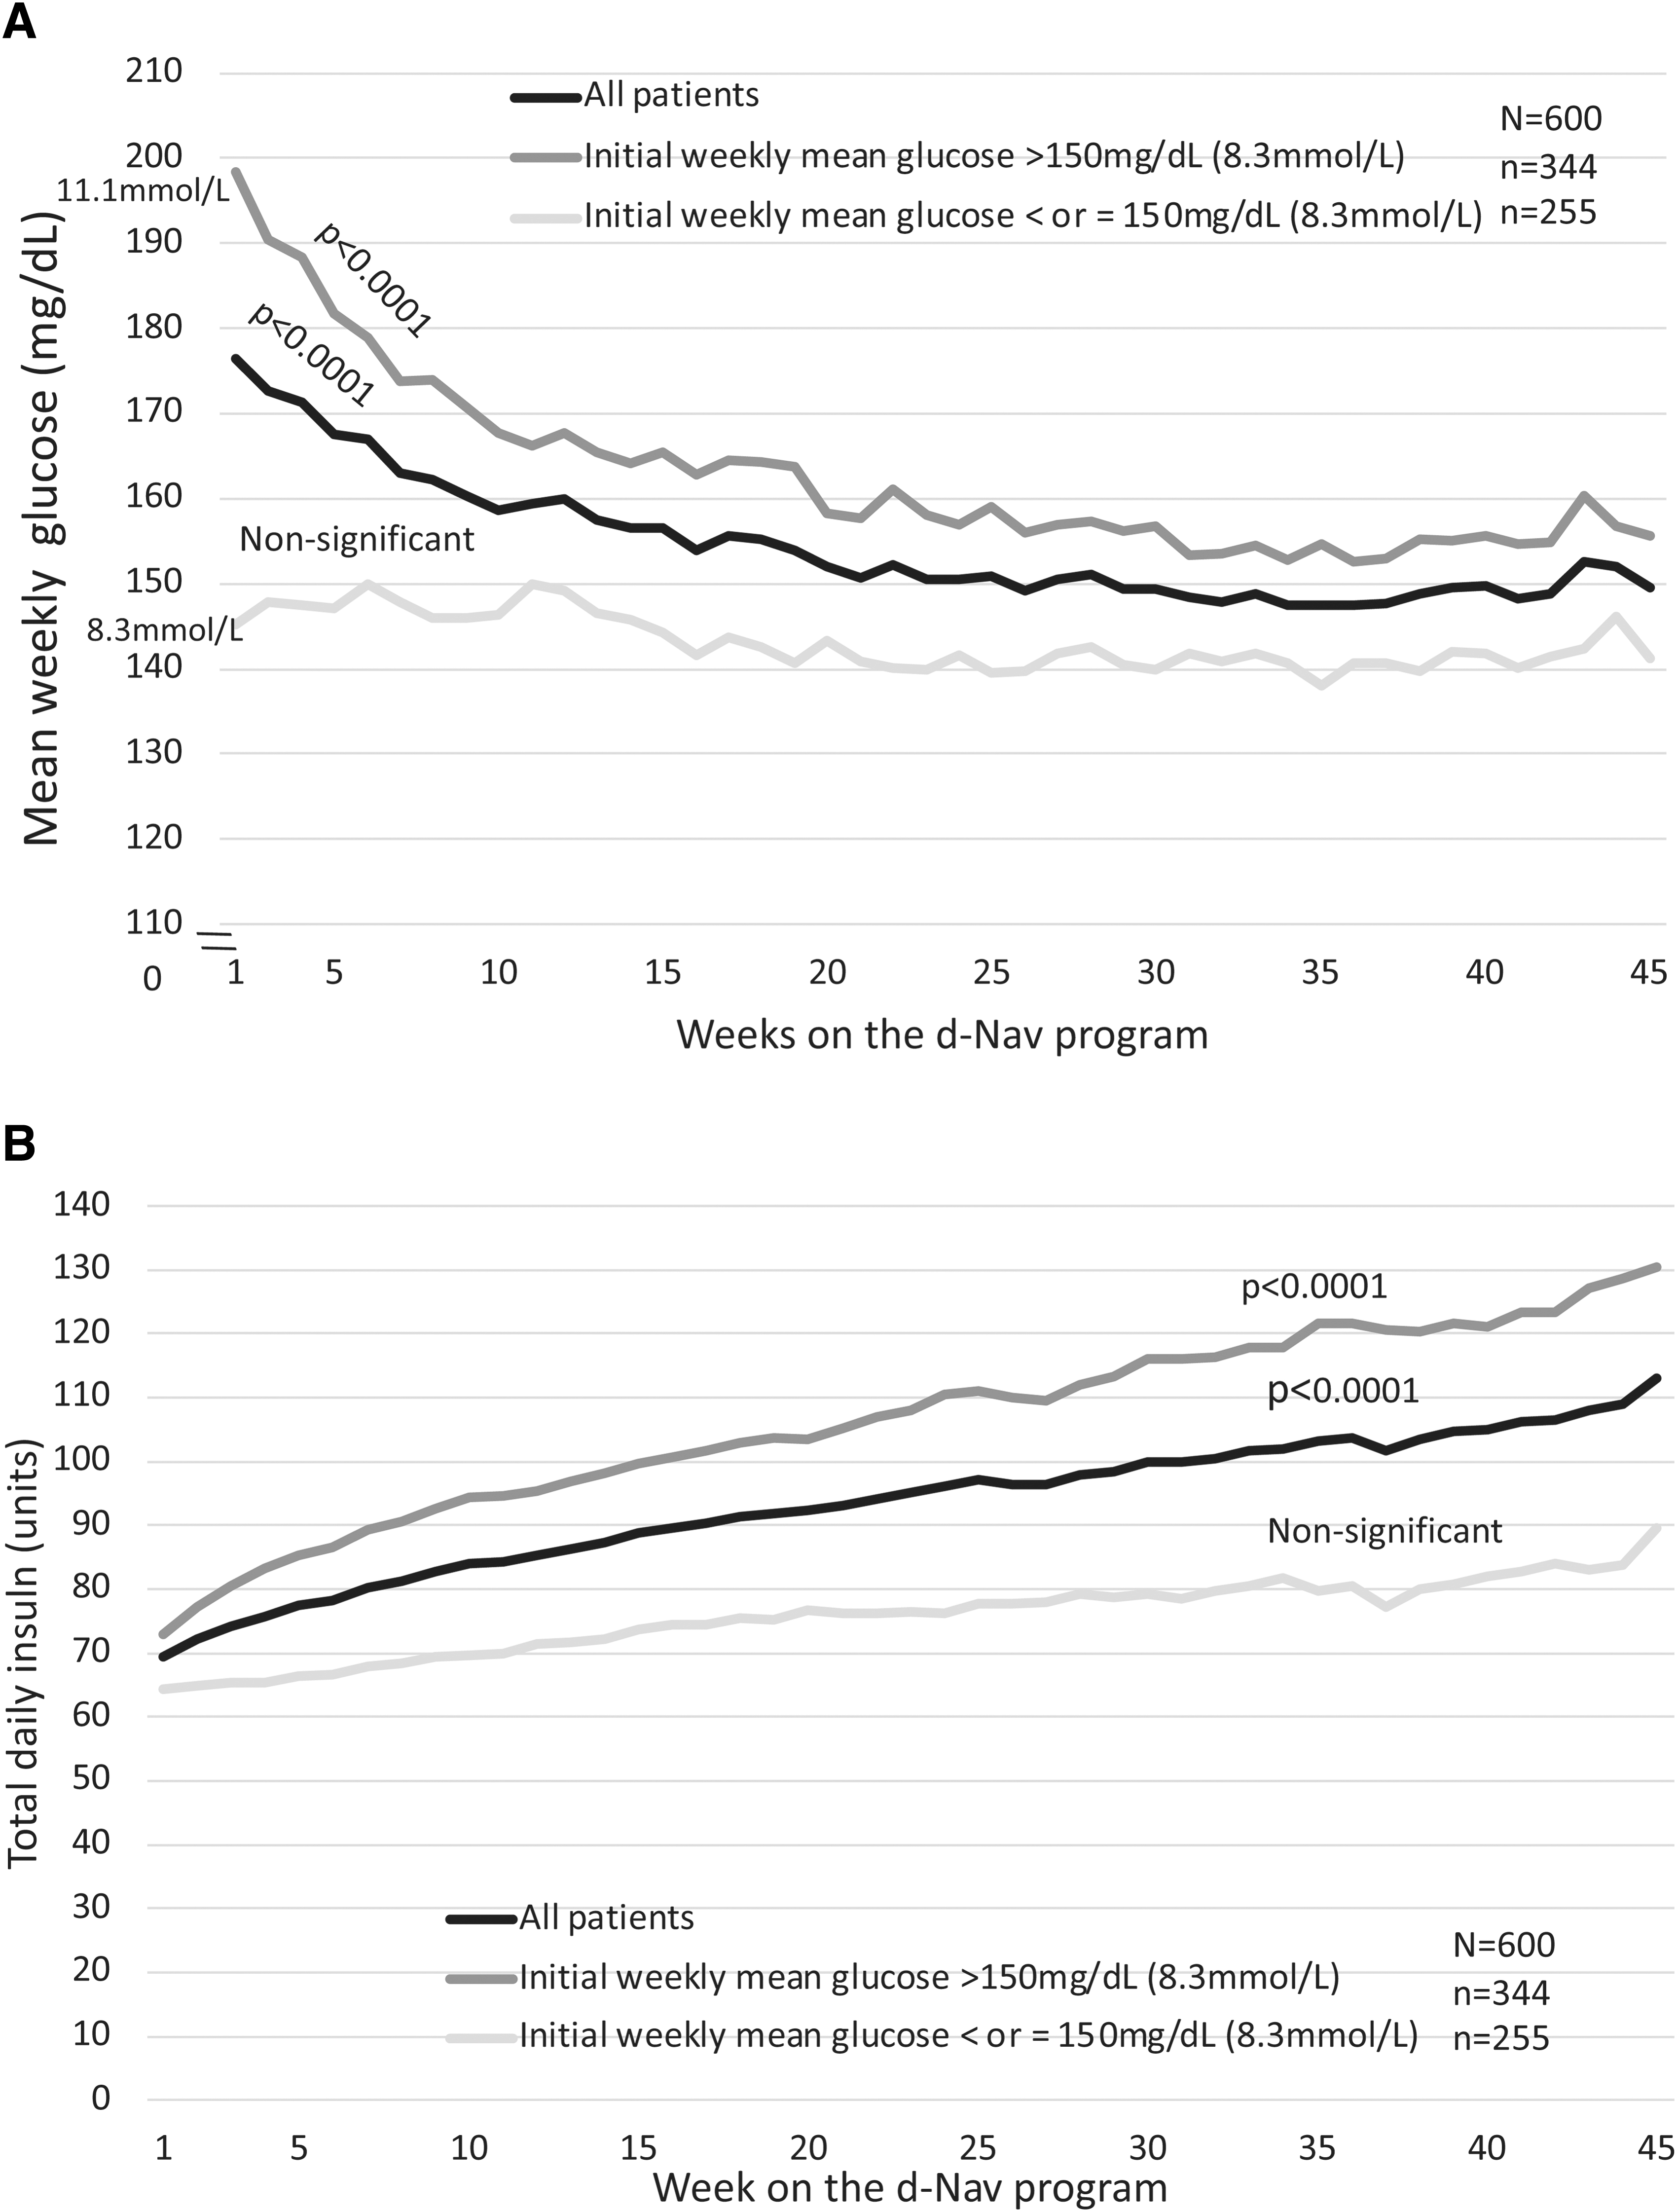
Glycemia and Insulin dynamics in d-Nav® users. The black lines denote the values in the entire population, the dark gray lines denote patients who started the program with weekly mean glucose >150 mg/dL (>8.3 mmol/L) and the light gray lines denote patients who started the program with weekly mean glucose ≤150 mg (≤8.3 mmol/L).
Total daily dose of insulin increased by the d-Nav program by 60.6%, from 69.3 units at baseline to 111.3 units (an increase of about 0.45 units/kg/day from 0.74 to 1.19 units/kg/day). In patients who started the program with weekly mean glucose >150 mg/dL (>8.3 mmol/mol) during the first week (n = 344), total daily dose of insulin increased by 67.7% from 73.0 units at baseline to 122.4 units (Fig. 2B). In patients who started the program with weekly mean glucose ≤150 mg/dL (≤8.3 mmol/L; n = 256), total daily dose of insulin remained largely stable. While the average total daily dose for the entire group was relatively stable over time, this consisted of many increases and decreases in insulin doses. Therefore, individual patients showed considerable insulin dose variations over time (see in the next paragraph).
As expected, considerable variations in total daily dose of insulin was seen during the entire follow-up. 8 In the entire cohort, total daily dose of insulin varied from baseline by 93.9% ± 114.2% throughout the time on the program (e.g., total daily dose of insulin which started at 70 units, ranged between a minimum of 50 units per day, and a maximum of 115 units throughout the period). In the group of patients who started d-Nav with weekly mean glucose ≤150 mg/dL (≤8.3 mmol/L), in whom average total daily dose of insulin did not change significantly during the follow-up, total daily dose of insulin varied in each patient by 65.0% ± 62.1% (e.g., a total daily insulin which started at 70 units, ranged between a minimum of 45 units and maximum of 91 units during the period).
In 21% of the patients, the total daily dose of insulin decreased during the first 3 months of the program to minimize the risk of hypoglycemia. As expected, reduction of total daily dose of insulin was seen more in patients who started the program with weekly mean glucose ≤150 mg/dL (≤8.3 mmol/L) (27.1% of the patients; P = 0.0003).
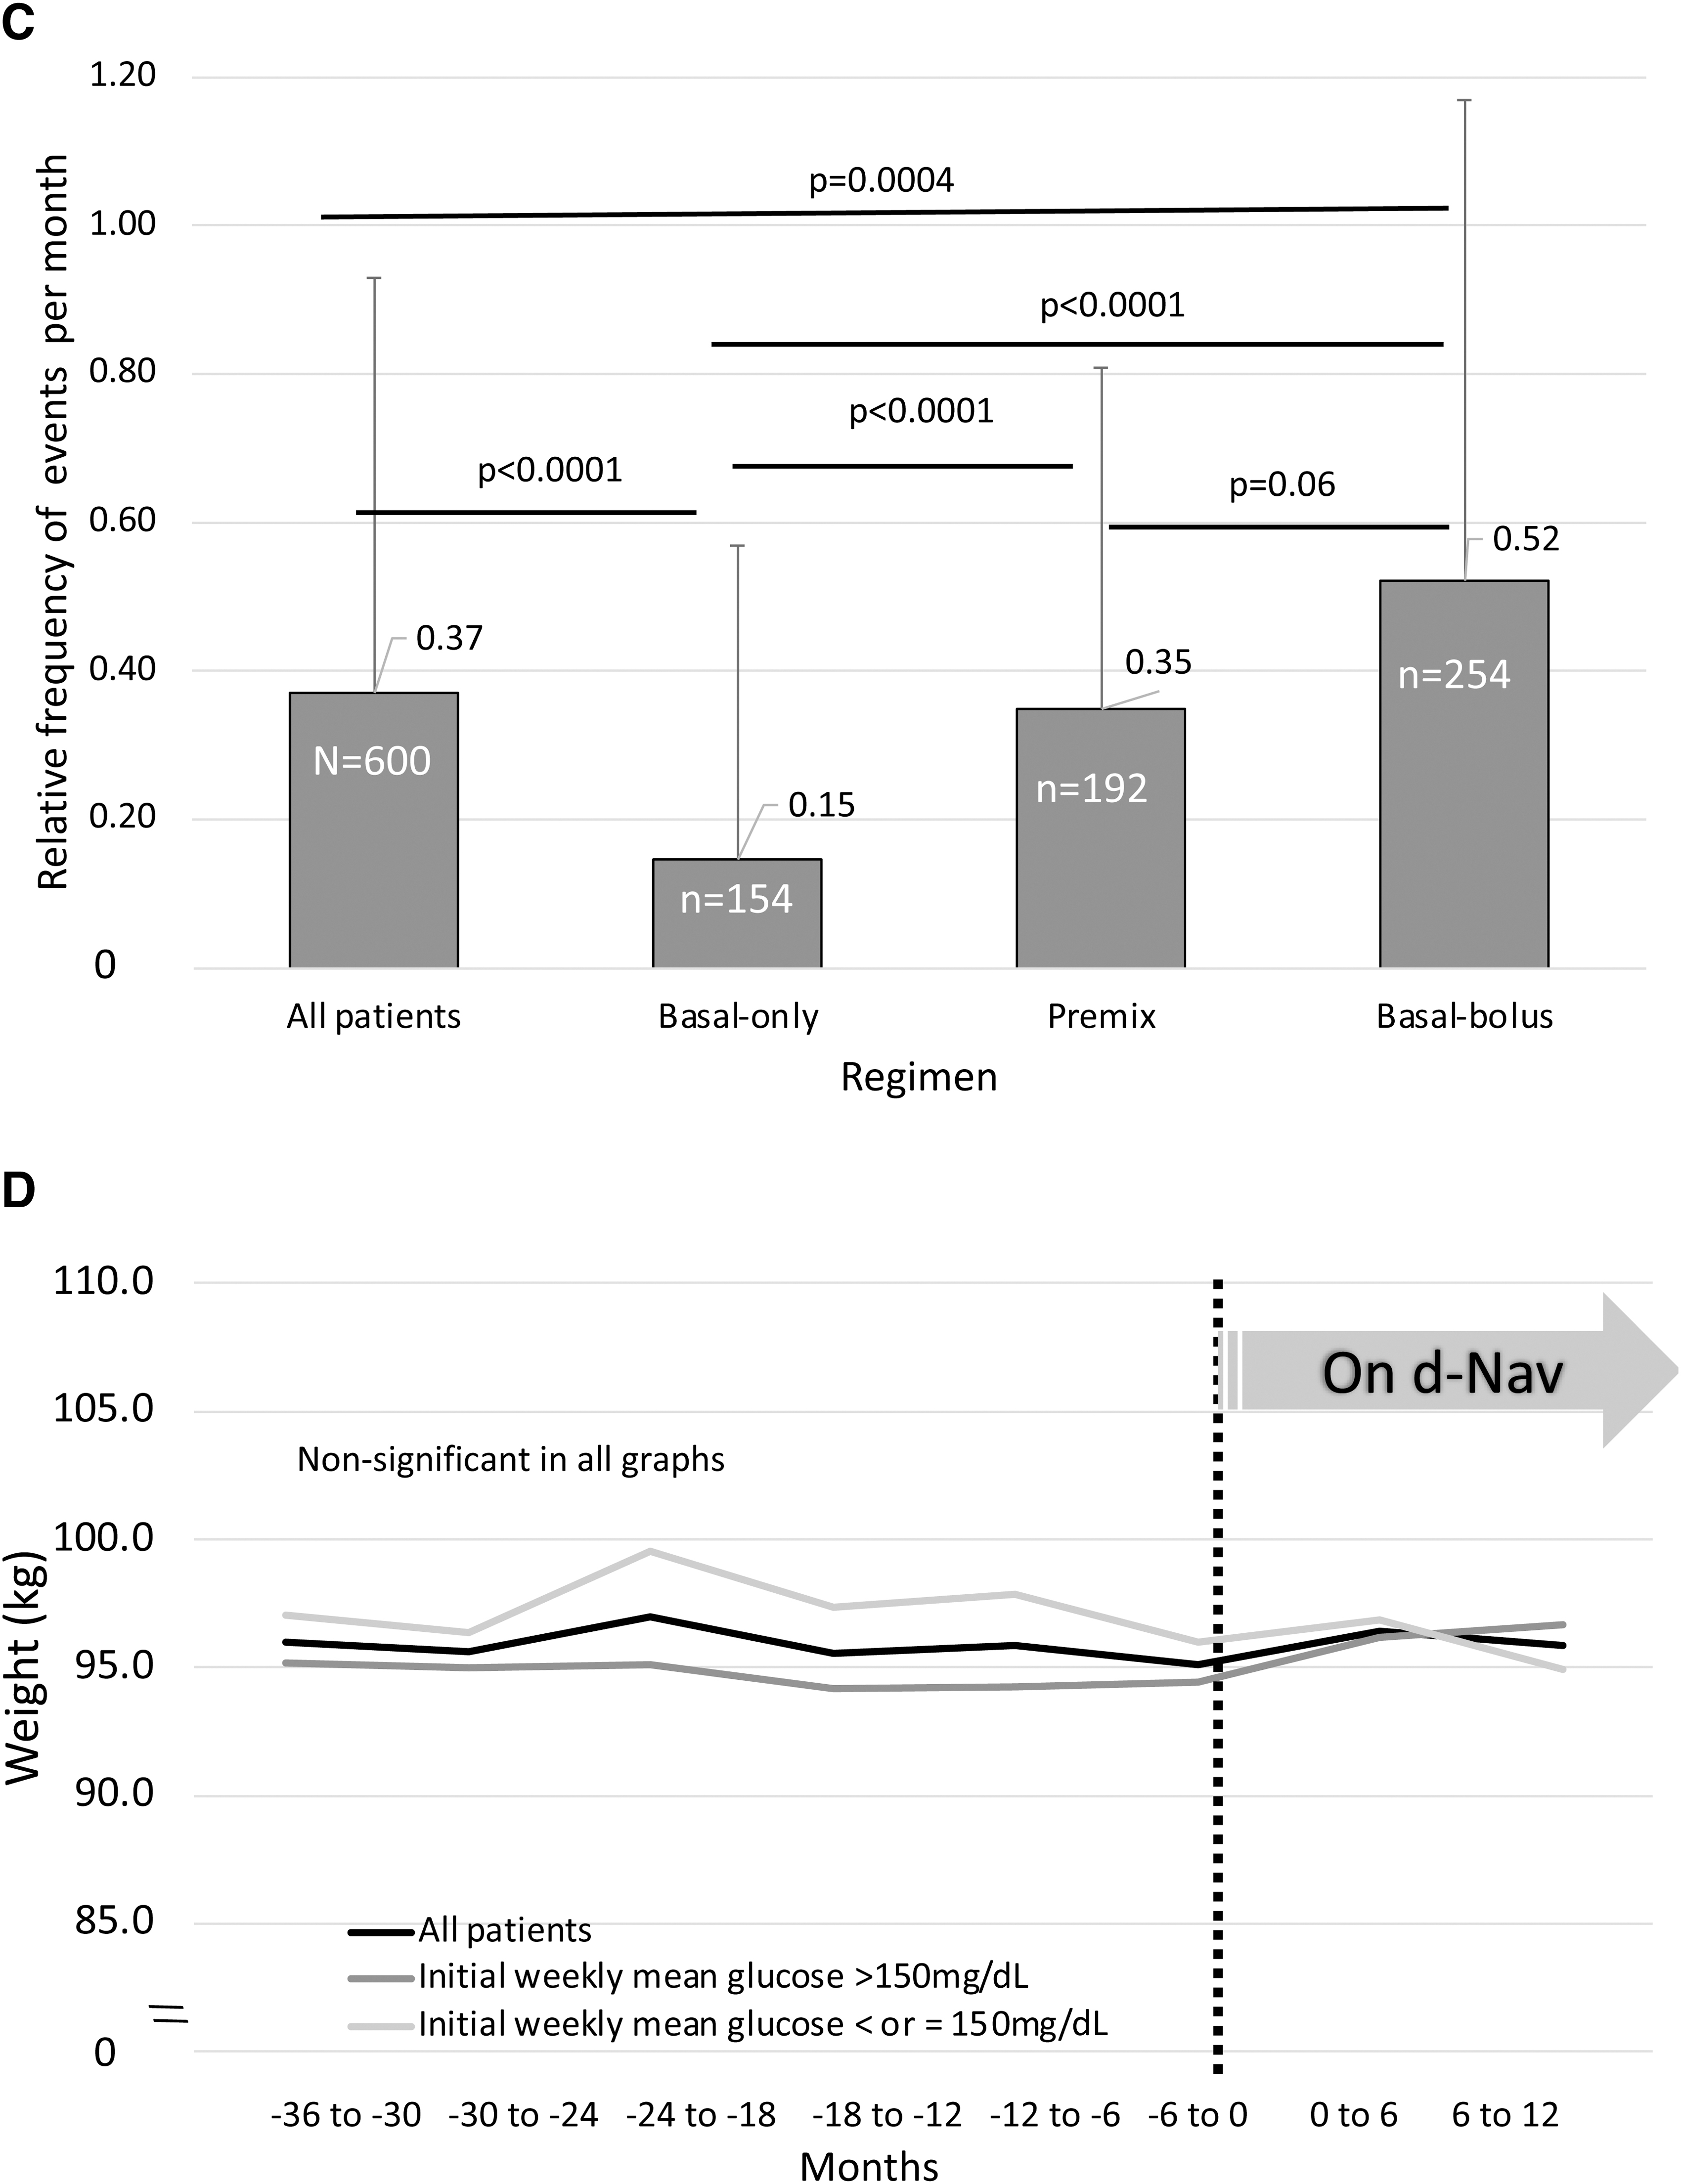
Patients' weight was stable during the last 3 years before d-Nav and during the d-Nav program (Fig. 2D). No weight differences were seen between patients who started the program with weekly mean glucose >150 or ≤150 mg/dL.
Concerning noninsulin anti-diabetes medications, by the end of the follow-up, 46.2% were treated with either GLP-1RA or dual GLP-1RA+GIPRA (Tirzepatide®) (Table 1). Of all patients, 38.2% were treated with biguanides and 33.0% with sodium glucose cotransporter 2 inhibitor (SGLT2i). Both SGLT2i and GLP-1RA/GLP-1RA+GIPRA were used by 19.2%. Patients who were using GLP-1RA/GLP-1RA+GIPRA by the end of the follow-up had higher initial HbA1c before starting d-Nav compared to patients who were not using these classes (8.8% ± 2.3% vs. 8.4% ± 1.9%; P = 0.03). This difference was not seen during the first 6 months on d-Nav (P = 0.2). Patients who were using SGLT2i during the d-Nav program had similar initial HbA1c than patients who were not using this class (P = 0.9).
We sought to learn about the use of GLP-1RA/GLP-1RA+GIPRA over time, before and during the d-Nav program. We performed a subanalysis on a sample of 200 of the 600 patients. Figure 1B depicts the percent of patients using GLP-1RA/GLP-1RA+GIPRA over time before and during the d-Nav program. In the 3 years before d-Nav, the use of these agents increased by more than twofold, yet, HbA1c did not improve (Fig. 1A, B). During the d-Nav program, the percent of patients using these agents was stable at about 45% of the patients. Of the patients who were using GLP-1RA/GLP-1RA+GIPRA at any time during the d-Nav program, 81.1.% were using the drugs during the first month on d-Nav, and 80.3% were using the drugs by the end of the follow-up, suggesting an overall stability in the use of these agents while on d-Nav.
Of the 600 patients, 215 (35.8%) were using CGM. Patients who were using CGM during the d-Nav program had similar initial HbA1c (before starting d-Nav) and 6-month HbA1c compared to patients who were not using CGM (P = 0.2 and P = 0.4, respectively). Eighty of these patients allowed online CGM access to the clinic for ongoing care. Figure 3 provides CGM-derived frequency of glucose ranges for the last 14 days of the observation. TIR (glucose 70–180 mg/dL or 3.9–10 mmol/L) 14 was 64.2%, and time below range (<70 mg/dL or <3.9 mmol/L) was 1.5%. TIR was similar in all insulin regimens (P = 0.3). A tendency toward spending less time below range was seen in patients who used premix insulin compared to basal-bolus (0.3% vs. 1.8%, respectively; P = 0.05).
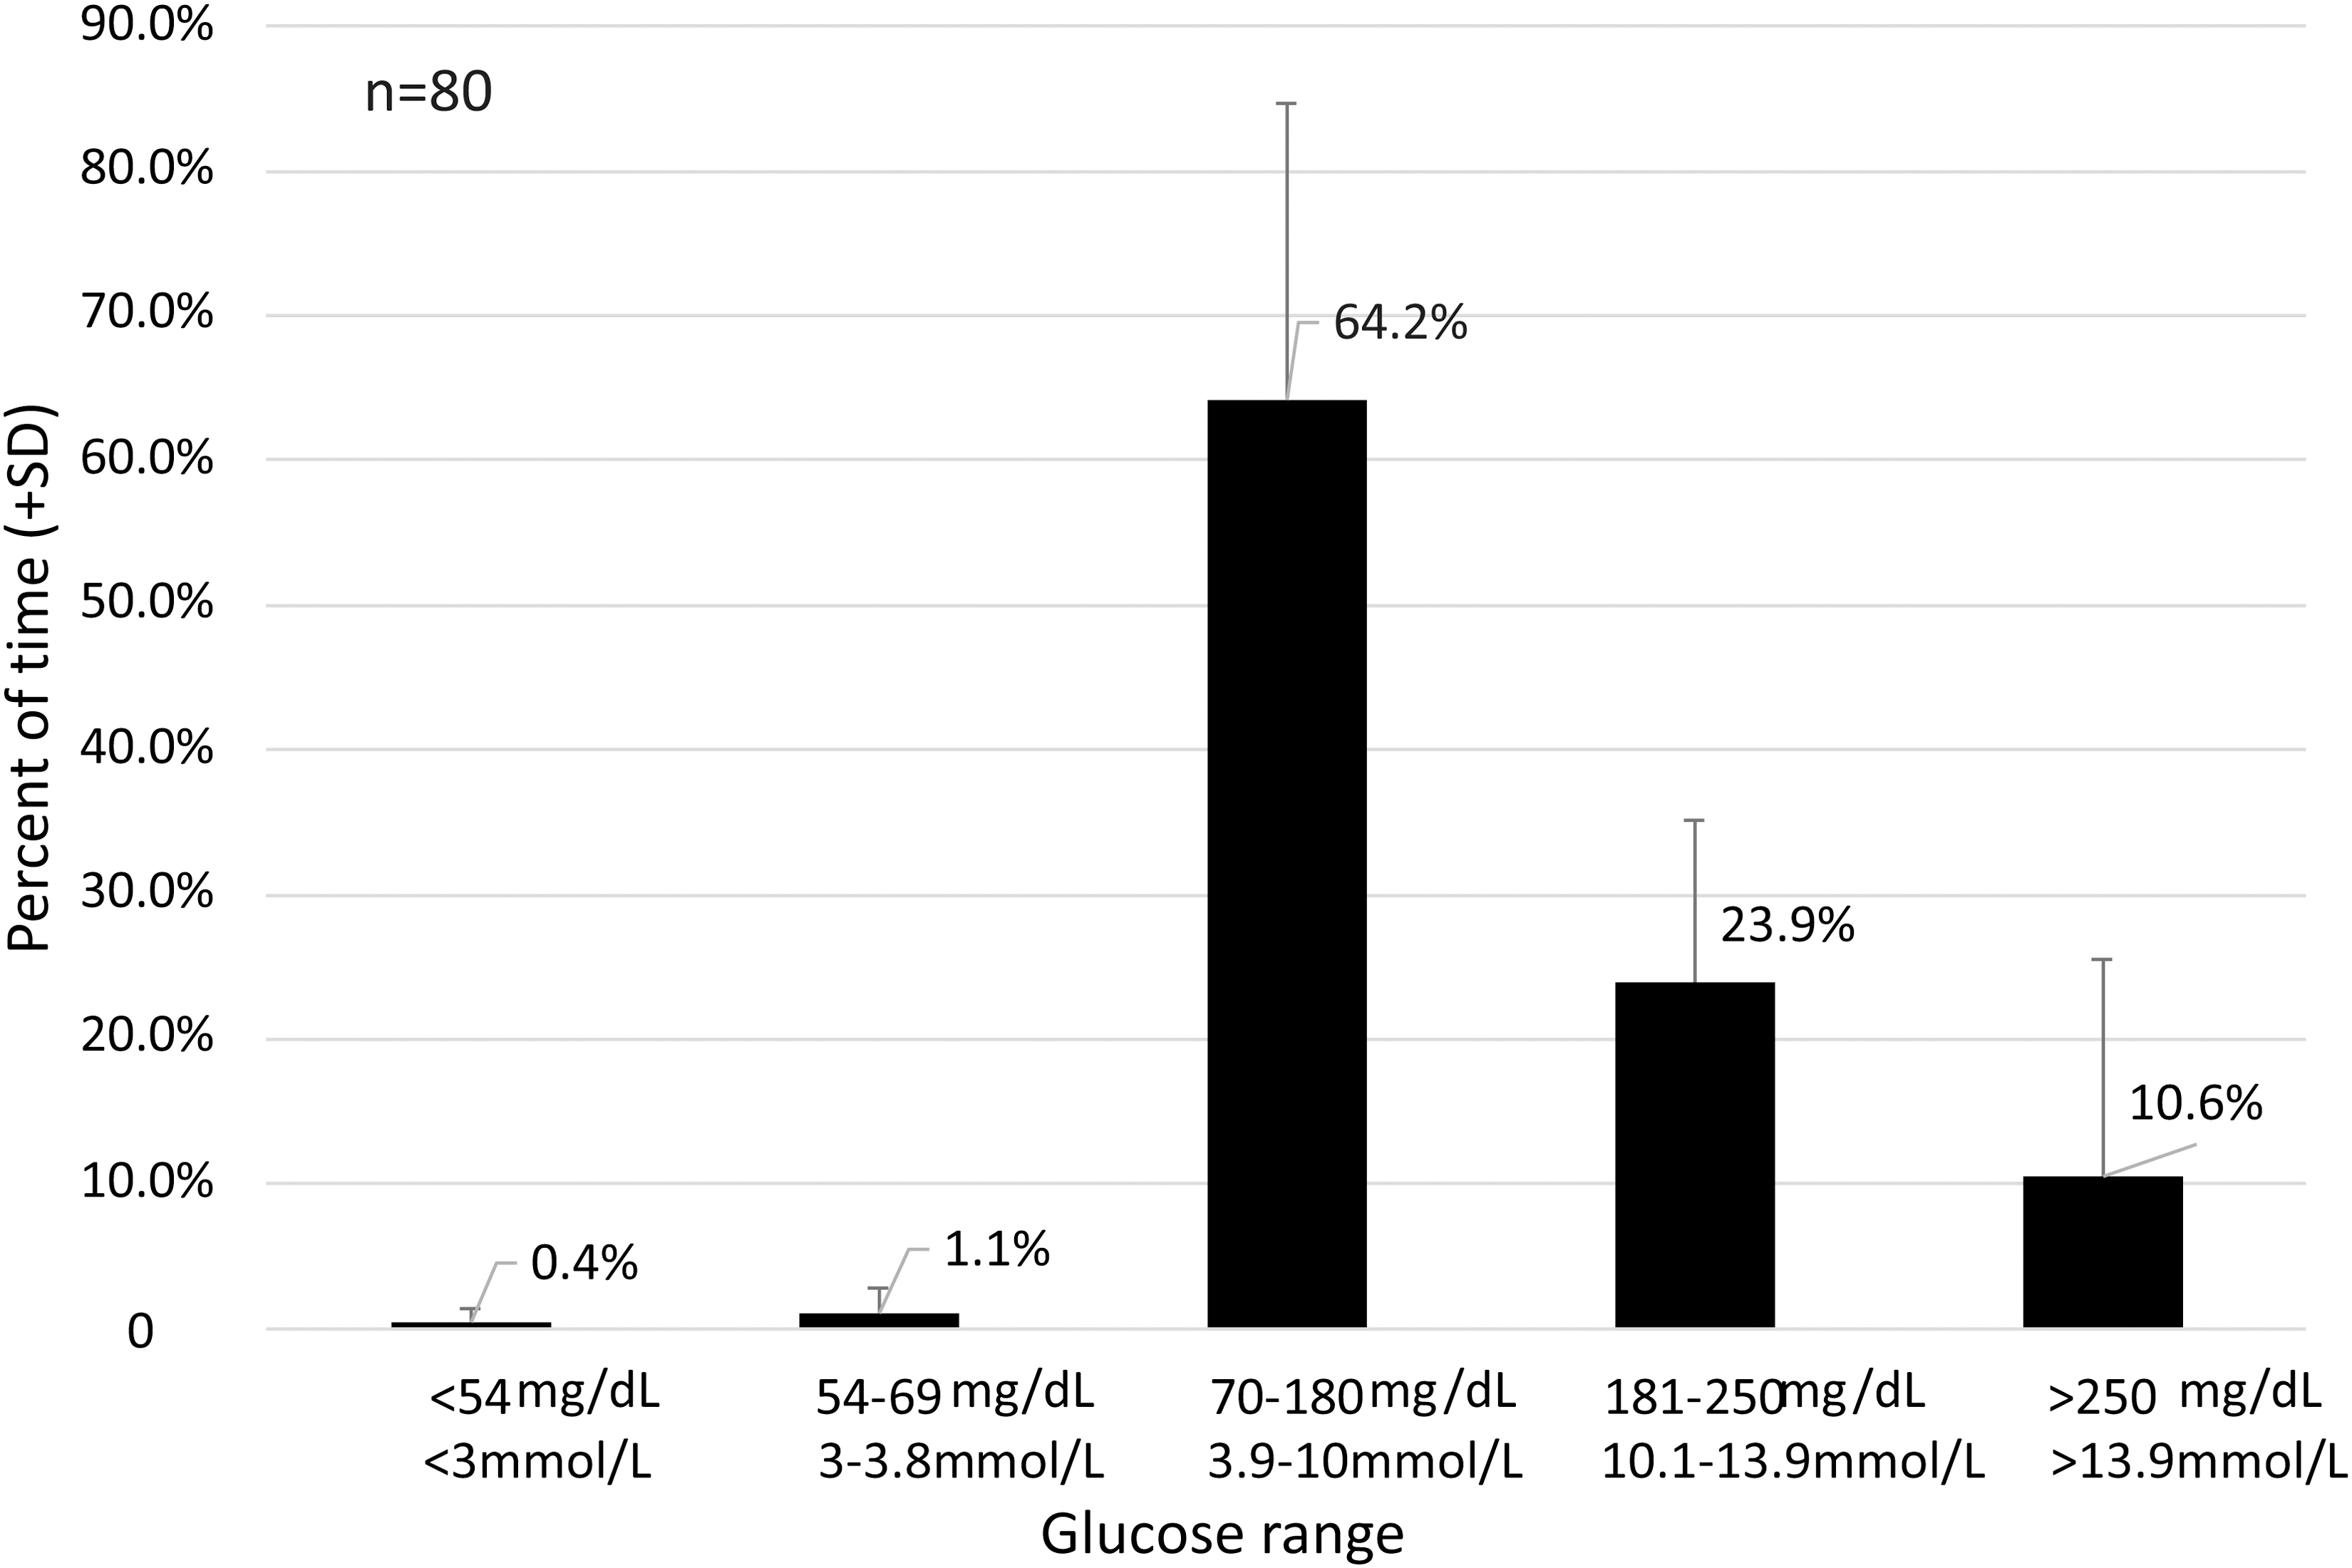
Percent of time spent in different glucose concentration ranges based on the most recent 14 days of CGM data in patients with type 2 diabetes who have been using d-Nav®. Glucose levels of 70–180 mg/dL (3.9–10 mmol/L) are defined as in range (TIR). CGM, continuous glucose monitor; TIR, time-in-range. 14
Of the 80 patients, 38 had CGM information during the last 2 weeks before starting d-Nav. In that group, pre-d-Nav TIR was 47.7% ± 25.5% and on d-Nav 65.4% ± 17.1% (P = 0.003). Time below range (<70 mg/dL or <3.9 mmol/L) was 0.4% ± 0.8% before d-Nav and 1.2% ± 1.9% on d-Nav (P = 0.004). Time <54 mg/dL (<3 mmol/L) was 0.03% ± 0.2% before d-Nav and 0.3% ± 0.4% on d-Nav (P = 0.004). On d-Nav, both time <70 mg/dL and time <54 mg/dL were well below the consensus targets for hypoglycemia of <4% of readings <70 mg/dL and <1% of readings <54 mg/dL.
The frequency of clinically relevant hypoglycemia (<54 mg/dL) 17 was as low as 0.4 ± 0.6 events per month. As expected, lower frequency of hypoglycemia was seen in patients using a basal-only insulin regimen (Fig. 2C). 8 Similar frequency of hypoglycemia was seen in patients who were using basal-bolus and premix regimens with a tendency for a lower rate in patients on premix insulin (P = 0.06). Seven patients experienced severe hypoglycemia with a single event in each patient, corresponding to a frequency of 1.7 per 100 patient-years. Three of the patients were treated at home by an ambulance team, three were treated at the emergency room and one at the endocrinology clinic. None of the events resulted in any lasting disability.
Concerning the 108 patients who withdrew from the program, half used d-Nav for at least 5 months. In these 54 patients, 41 patients (75.9%) had a follow-up A1c while on the d-Nav program, and in this group, HbA1c improved from 7.9% ± 1.8% at baseline to 7.2% ± 1.0% at the first follow-up postbaseline, P = 0.02. Despite the significant improvement in HbA1c with d-Nav, the program was discontinued for other reasons. For clarity, the A1c values for these patients are included in our complete cohort analysis (Fig. 1A).
For the 54 patients who withdrew during the first 5 months, we analyzed the first HbA1c available after d-Nav was discontinued. In these 54 patients, the HbA1c did not change (8.1% ± 1.9% at baseline to 8.0% ± 1.4%, P = 0.9). Nevertheless, including these data in the complete cohort analysis result in an HbA1c reduction from 8.6% ± 2.1% at baseline to 7.6% ± 1.5% at the first follow-up point P < 0.0001. This HbA1c reduction was similar to the one seen in the original cohort. The change in HbA1c was 1.0% ± 1.8% with these post-d-Nav values versus 1.1% ± 1.8% (P = 0.4) without. These data stand against survival bias.
We administered an established d-Nav satisfaction questionnaires 13 on 50 consecutive patients coming for routine follow-ups of whom 48 (96.0%) returned the forms. Supplementary Figure S2A denotes five selected representative questions and Supplementary Figure 2B the scores. Overall, the scores were high at 3.8 points in a scale of 1–4, indicating a high patient satisfaction.
Discussion
Effective type 2 diabetes management requires control of both the glycemic-management and cardiorenal-risk treatment strategies. Owing to the progressive nature of insulin deficiency, these two objectives may be detached. Insulin therapy has the potential for unlimited efficacy, and therefore, it is the major rescue choice for patients with overt insulin deficiency inadequately controlled on other therapies. Still, effective and safe insulin therapy requires frequent titration of doses which is a challenge for busy clinicians. The practice described in this report has implemented a potentially scalable AI-driven frequent insulin titration program to realize the glycemic-management objectives of their patients with type 2 diabetes, while choosing noninsulin antidiabetes therapy based on nonglycemic indications. The time saved allowed more referrals from primary care (data not shown).
The patients prescribed with d-Nav were of diverse ethnicity and clinically complex, with more than a half older than 65 and with a diabetes duration of about two decades. More than a third of the patients have had an established cardiovascular morbidity and more than one-fifth have had nephropathy.
The d-Nav-driven frequent insulin titration allowed for improved glycemic control while preserving treatment safety with low frequency of hypoglycemia. 18 Increase in total daily insulin dose was seen mainly in patients who started the d-Nav program with hyperglycemia or with weekly mean glucose >150 mg/dL during the first week. During the first 3 months, d-Nav reduced total daily dose of insulin in one of every five patients due to relatively low glucose levels to minimize the risk of hypoglycemia. As previously shown, the improvement in HbA1c was accompanied with favorable TIR. 19 Frequent titrations facilitated high efficacy and safety of the simple and inexpensive twice-daily premixed insulin regimen. 8
Patients were highly satisfied with the program, explaining the low attrition rate. The high HbA1c during the 3 years before beginning the program, had occurred despite a steady and significant rise in the percent of patients using GLP-1RA/GLP-1RA+GIPRA. This trend of higher HbA1c values over time in patients with type 2 diabetes has been previously reported. 20 Glycemic tachyphylaxis to GLP-1RA is well described in patients with long-standing diabetes. 5,21
The absence of a control group was the major limitation of the study. For example, although the mortality seen in the cohort was significantly lower than the mortality reported in patients with long-term diabetes, 22 we did not have a control group to validate it as being derived from the intervention.
Conclusions
This real-life clinical implementation strategy offers a practical solution to a major barrier in the provision of comprehensive type 2 diabetes management. A simple, effective, and safe approach to insulin therapy facilitates improved glycemic management, while appropriate cardiorenal protective pharmacotherapy is also being initiated as needed.
Footnotes
Acknowledgments
From Endocrinology, Diabetes and Metabolism, Physicians East PA, Greenville, North Carolina, USA: R. Dodis, MD, R. Azad, MD, Melissa Lewis PA-C, V. Glockzin PA-C, from Hygieia, Inc., Livonia, Michigan, USA: S. Sritharan, N. Rice, T. Gdowski.
From Hygieia PC., Livonia, Michigan, USA: L. Kessler, L. Johnson, R. Johnson, M. Bickers, S. Fhadima, H. Weaks, K. Hammoud, K. Kessler, A. Filhiol, R. Sanders, K. Bryant, J. Golembiewski, T. Cain, S. Strong, M. Spicer, P. McCloud, J. Richardson, M. Davis, T. Smith.
Authors' Contributions
M.W.—design, data collection, and writing the article; M.H.—data collection; R.M.B., E.B., and I.H.—data interpretation and writing the article. All authors confirm that they had full access to all the data in the study and accept responsibility to submit for publication.
Author Disclosure Statement
I.H. is a cofounder and medical director for Hygieia PC.; E.B. is a cofounder and CEO for Hygieia, Inc.; M.W. and M.H. are part of an institutional partnership with Hygieia PC; R.M.B.—has received research support, has acted as a consultant, or has been on the scientific advisory board for Abbott Diabetes Care, Ascensia, CeQur, DexCom, Eli Lilly, Embecta, Hygieia, Insulet, Medtronic, Novo Nordisk, Onduo, Roche Diabetes Care, Tandem Diabetes Care, Sanofi, United Healthcare, Vertex Pharmaceuticals and Zealand Pharma. Dr. Bergenstals's employer, nonprofit HealthPartners Institute, contracts for his services and he receives no personal income from these activities.
Funding Information
Hygieia, Inc.
Supplementary Material
Supplementary Figure S1
Supplementary Figure S2
References
Supplementary Material
Please find the following supplemental material available below.
For Open Access articles published under a Creative Commons License, all supplemental material carries the same license as the article it is associated with.
For non-Open Access articles published, all supplemental material carries a non-exclusive license, and permission requests for re-use of supplemental material or any part of supplemental material shall be sent directly to the copyright owner as specified in the copyright notice associated with the article.