




Abstract
Objective:
To predict hypoglycemia and hyperglycemia risk during and after activity for adolescents with type 1 diabetes (T1D) using real-world data from the Type 1 Diabetes Exercise Initiative Pediatric (T1DEXIP) study.
Methods:
Adolescents with T1D (n = 225; [mean ± SD] age = 14 ± 2 years; HbA1c = 7.1 ± 1.3%; T1D duration = 5 ± 4 years; 56% using hybrid closed loop), wearing continuous glucose monitors (CGMs), logged 3738 total activities over 10 days. Repeated Measures Random Forest (RMRF) and Repeated Measures Logistic Regression (RMLR) models were used to predict a composite risk of hypoglycemia (<70 mg/dL) and hyperglycemia (>250 mg/dL) within 2 h after starting exercise.
Results:
RMRF achieved high precision predicting composite risk and was more accurate than RMLR Area under the receiver operating characteristic curve (AUROC 0.737 vs. 0.661; P < 0.001). Activities with minimal composite risk had a starting glucose between 132 and 160 mg/dL and a glucose rate of change at activity start between −0.4 and −1.9 mg/dL/min. Time <70 mg/dL and time >250 mg/dL during the prior 24 h, HbA1c level, and insulin on board at activity start were also predictive. Separate models explored factors at the end of activity; activities with glucose between 128 and 133 mg/dL and glucose rate of change between 0.4 and −0.6 mg/dL/min had minimal composite risk.
Conclusions:
Physically active adolescents with T1D should aim to start exercise with an interstitial glucose between 130 and 160 mg/dL with a flat or slightly decreasing CGM trend to minimize risk for developing dysglycemia. Incorporating factors such as historical glucose and insulin can improve prediction modeling for the acute glucose responses to exercise.
Introduction
Physical activity often promotes a rapid change in glucose concentration in adolescents with type 1 diabetes (T1D). 1 While a strong glucose lowering effect is usually observed with most forms of prolonged moderate-intensity aerobic activity (e.g., walking, running, or cycling), 2 some forms of intense or competitive exercise (e.g., interval training, a running or cycling sprint, mixed martial arts, and so on) are often associated with a dramatic rise in glycemia, particularly if insulin-on-board (IOB) is low. 3 –5 Thus, predicting the directional change and the magnitude of change in glucose concentration in response to exercise is difficult in youth with T1D, particularly because of large patient variability 6 –8 and the sheer number of factors that appear to influence glucose rates of change during exercise. 9,10
The Type 1 Diabetes Exercise Initiative Pediatric (T1DEXIP) study identified several participant-level and activity-level factors that appear to influence the change in glucose level during 6 and after 11 free-living exercise. Among the factors identified, higher pre-exercise glucose levels, higher prandial IOB, higher percent time below 70 mg/dL the day before exercise, and decreasing glycemia prior to exercise all were associated with greater glucose drops during the activity, and change in glucose during exercise was associated with differences in postexercise mean glucose in the first 4 h following the end of exercise. Postexercise nocturnal hypoglycemia was more common in adolescents with longer disease duration, lower HbA1c levels, and if a nonhybrid closed-loop (HCL) insulin pump was used. However, it is unknown if these factors, or other factors, such as the exercise intensity, exercise time of day, and/or disease duration can be used to predict hypo- or hyperglycemia risk during the activity or in early recovery.
In highly controlled exercise studies conducted in research centers, the risk for activity-induced hypoglycemia in youth with T1D who have no protective strategies in place to limit the drop in glucose level, such as carbohydrate feeding or insulin dose reduction, is ∼30%–40%. 2,12 However, in outpatient settings the risk for exercise-associated hypoglycemia is less clear, since a variety of strategies may be in place to help limit risk. Some of these strategies might be associated with increased risk for activity-associated hyperglycemia, such as insulin dose suspensions and excessive carbohydrate intake. In prior work that focused on prediction of exercise-related glycemia, Hobbs et al. 13 demonstrated that the incorporation of exercise heart rate data, along with ingested carbohydrate and insulin delivery data, helped to predict the glycemic response to exercise in adolescents with T1D during a ski/snowboard camp study, but the prediction model did not extend to assessing risk for hypo- or hyperglycemia. Sensor-augmented pump therapy, which uses a predictive low glucose suspend (PLGS) in anticipation of hypoglycemia, offers some protection against activity-related hypoglycemia, albeit the risk is still high (∼35% with PLGS vs 90% with sensor-augmented pump therapy). 14 A preclinical hybrid closed loop insulin delivery system (HCL), augmented for exercise events using heart rate information and a prediction algorithm for a glucose value <140 mg/dL, appears to help manage postexercise glycemia in adolescents with T1D, by helping mostly to reduce postexercise time above range, but this system results in similar hypoglycemia events during exercise compared with sensor-augmented pump therapy. 15
Others have focused on modeling (predicting) hypoglycemia risk with exercise, using existing study datasets, which can be useful in offering general clinical guidance for hypoglycemia mitigation during activity. For example, Reddy et al. used a decision tree and random forest plot model to show that a baseline glucose less than 182 mg/dL and a heart rate higher than 120 beats per minute could predict exercise-associated hypoglycemia with good accuracy, ranging from 80%–87% accuracy, depending on model complexity in adults with T1D who had participated in highly controlled laboratory studies. 16 Prasanna et al. 17 used physical activity and continuous glucose monitor (CGM) data from 50 adults with T1D, extracted from the Tidepool diabetes data platform, to demonstrate that lower pre-exercise glucose concentrations and a lower 2-hour pre-exercise area under the glucose curve were strong predictors for exercise-associated hypoglycemia, but no threshold values were given to provide clinical guidance on what the target glucose should be before exercise to help mitigate hypoglycemia risk. Using real-world data, Bergford et al. 18 identified glucose level and glucose rate of change just before the start of exercise as the most important predictors of hypoglycemia risk during exercise in adults with T1D, but no information was provided for hyperglycemia risk or for the risk of either hypo- or hyperglycemia at the end of exercise. Moreover, several other participant-level and activity-level factors such as IOB, insulin modality, and activity type were also identified as being potential predictive factors for hypoglycemia during exercise, but it is unknown if these effects remain for adolescents.
The purpose of this study was to create predictive models for both hypo- and hyperglycemia and generate a composite “dysglycemia” risk score for adolescents with T1D. With this information, we provide new suggestions for both starting and ending glucose levels, based on CGM, for physical activity for youth with T1D so that glucose homeostasis may be better preserved during and after activity. To do this, we conducted analyses of all free-living activities from the recently published T1DEXIP study 6 to train and evaluate machine learning algorithms for predicting glucose outcomes surrounding physical activity.
Methods
Study cohort and design
The T1DEXIP study was an observational at-home study designed to collect a variety of data around free-living physical activity for adolescents with T1D. The study has been described elsewhere 6 and summarized herein. The protocol received institutional review board approval, and electronic informed parental consent and participant assent were obtained before screening. Eligible participants were between 12 and 17 years of age, diagnosed with T1D for at least 3 months, and followed intensive insulin therapy (using conventional pump therapy or low glucose suspend/predictive low glucose suspend systems [pump], hybrid closed loop [HCL] pump, or multiple daily injections [MDI]) for at least 1 month. HbA1c was collected by self-report. After completion of initial virtual training, participants were followed for approximately 10 days where they continued their typical forms of activity. Participants self-reported participation in any activity that lasted for at least 10 min through the BANT app (University Health Network, Toronto, ON). MDI users were asked to enter insulin data through the app. Current Dexcom G6 users continued to use their personal continuous glucose monitor (CGM) throughout the study; all other participants received a blinded Dexcom G6 Pro and were provided with instructions on the sensor insertion, use, and care of the CGM during the virtual training visit.
Statistical methods
For “start of activity” predictions of hypo- and hyperglycemia during activity, events included in the analysis met the following requirements: (1) no other activity occurring in the 2 h after start of activity, (2) activity duration between 20 min and 120 min, (3) ≥1.5 h of CGM data in the 2 h following the start of activity, and (4) nonmissing data for the predictors included in the model. For “end of activity” predictions of hypo- and hyperglycemia, events included in the analyses met the following requirements: (1) no other activity occurring in the 2 h after end of activity, (2) activity duration between 20 min and 120 min, (3) ≥1.5 h of CGM data in the 2 h following the end of activity, and (4) nonmissing data for the predictors included in the model. Participant-level predictors included age, sex, HbA1c, T1D duration, Body Mass Index (BMI) percentile, International Physical Activity Questionnaire metabolic equivalent minutes (IPAQ METs) per week, insulin modality, Physical Activity Questionnaire (PAQ) score, and minutes of activity per day during the study. Activity-level predictors for predictions made at the start of activity included type of activity, activity time of day, activity competition status, percent time >250 mg/dL during the 24 h before activity, percent time <70 mg/dL during the 24 h before activity, glucose at start of activity, glucose rate of change at start of activity, insulin on board at start of activity, and activity intensity. Activity-level predictors for predictions made at the end of activity included the same predictors except for glucose at start of activity and added activity duration, glucose at end of activity, glucose rate of change at end of activity, and change in glucose during activity. Type of activity was reported by participants through the BANT app and then categorized into the following groups: aerobic activity, anaerobic activity, mixed activity, physical labor, play, video games, walking, and undefined exercises. Descriptions of each predictor are located in Supplementary Table S1.
The objective was to predict whether a CGM-measured hypo- and/or hyperglycemic event occurred during each activity period. A hypoglycemic event was defined as ≥15 consecutive minutes with interstitial glucose <70 mg/dL; a hyperglycemic event was defined as ≥15 consecutive minutes of interstitial glucose >250 mg/dL; and a composite event was defined as having either a hypoglycemic or hyperglycemic event. The two activity periods began at the start and at the end of activity, and each activity period lasted 2 h. Descriptions of each CGM-measured event and activity period are located in Supplementary Table S2. Two models were trained to predict each combination of CGM-measured event and activity period: a Repeated Measures Random Forest (RMRF) model and a Repeated Measures Logistic Regression (RMLR) model. Activities in each activity period were split into “model training” and “model testing” datasets by participant: 70% of participants with all their activities in an activity period were included in the model training dataset, and the remaining 30% of participants with all their activities in an activity period were included in the model testing dataset. The composite outcome rate was approximately balanced between the model training and model testing datasets, and this was completed separately for datasets at the start and end of activity. The best RMRF and RMLR models for each CGM-measured event and activity period were chosen based on the performance on the training data. The predictive performance for the best RMLR model and the best RMRF model was assessed using the model testing dataset. Area under the receiver operating characteristic curve (AUROC; higher values representing better predictions), area under the precision recall curve Area under the precision recall curve (AUPRC; higher values representing better predictions), and Brier score (lower values representing better predictions) were calculated for the training and test data. Balanced accuracy (higher values representing better predictions) and positive predictive value (PPV, higher values representing better predictions) were also calculated for the test data when classifying activities as high or low risk using Youden’s index.
Repeated Measures Random Forest (RMRF) model
The RMRF model is an adaptation of the random forest model by Breiman 19 that can analyze binary outcomes that are correlated within a participant. An RMRF model fits classification trees by subsampling the participants and reiteratively splitting the predictors. Additional details of the RMRF model are provided in the Supplementary Material and further described in Calhoun et al. 20 The final set of predictors was selected by starting with all predictors, removing the predictor with the lowest variable importance, and then fitting a new RMRF. Predictors were removed until there was only one predictor remaining. The AUROC was calculated for each RMRF model, and the model with the greatest AUROC was selected. Only one final model for each event outcome and activity period was chosen, and the models were not reassessed after predicting the test data. Partial dependence plots (PDPs) were constructed to show how the predictors affected the probability of each CGM-measured event. PDPs were created for the variables in the final RMRF models and combined both the training and test datasets.
Repeated Measures Logistic Regression (RMLR) model
An RMLR model was fitted using a generalized estimated equation to estimate the parameters using an exchangeable correlation structure. A backward variable selection method was used to determine the optimal number of predictors in the RMLR model for each event and activity period. Every predictor was initially included, and the model was fitted. The predictor with the greatest robust Wald statistic P value was removed, and a new model was fitted. These steps were repeated until there was only one predictor remaining. The AUROC was calculated for each RMLR model using 5-fold cross-validation, and the model with the greatest AUROC was chosen as the final RMLR model.
Results
Cohort
The analysis included 225 participants with 1910 physical activity sessions to represent data and prediction modeling for the start of activity and 223 participants with 1876 activity sessions to represent the end of the activity. Median (quartiles) age of the study participants was 14 (13, 15) years; 60% were male; and 16% used MDI, 29% used pump, and 56% used HCL (Table 1). Median HbA1c was 7.0% (6.2%, 7.6%), median T1D duration was 4.3 (2.2, 7.8) years, and the mean (± SD) total daily active minutes per day were 84 ± 45 min/day. Median activity duration was 50 min (30, 90); walking was the most common activity type, representing 22% of all activities, and 31% of all activities were self-reported as low intensity, 56% as medium intensity, and 13% as high intensity. Within the time frame of 2 h from the start of any physical activity event, which would include variable recovery time because of the nonuniform nature of the activity duration in this observational study, 10% of events resulted in a hypoglycemic event, whereas 16% had a hyperglycemic event. Similarly, in the 2 h after the end of any activity, 10% of all activities had a hypoglycemic event, whereas 18% had a hyperglycemic event.
Participant Characteristics
The predictive performance for the activity-related composite risk was consistently higher for RMRF compared with RMLR. Specifically, the AUROC on the training dataset was higher for RMRF compared with RMLR for the composite outcome in both activity periods (Supplementary Fig. S1). The AUROC on the training dataset was generally higher for RMRF compared with RMLR for hypoglycemia and hyperglycemia in both activity periods.
Start of activity
Composite
The best RMRF model for the composite outcome at the start of activity used the following predictors (listed here by order of importance, as shown in Fig. 1): glucose at the start of activity, percent time <70 mg/dL during the 24 h prior to activity, glucose rate of change at the start of activity, percent time >250 mg/dL during the 24 h prior to activity, insulin on board (U/kg), HbA1c, diabetes duration, type of activity, and age. The AUROC for the model testing dataset for the composite outcome (i.e., hypo- or hyperglycemia) at the start of activity was higher for RMRF compared with RMLR (0.737 vs 0.661, difference in AUROC = 0.076 [95% CI: 0.026 to 0.126], P < 0.001; Table 2). In addition, AUPRC, balanced accuracy, and PPV were higher, and Brier score was lower with RMRF compared with RMLR for the composite outcome at the start of activity (Table 3, Supplementary Fig. S2). Supplementary Table S3 shows the performance on the training data for RMRF and RMLR. RMRF consistently had a higher AUROC than RMLR on the training data.

Variable importance with RMRF for the composite event. RMRF, Repeated Measures Random Forest.
Comparison of RMRF and RMLR AUROC Performance on Test Data
Difference is AUROC with RMRF minus AUROC with RMLR. Multiple comparisons were adjusted using the Benjamini–Hochberg adaptive false discovery rate correction method. RMRF, Repeated Measures Random Forest; RMLR, Repeated Measures Logistic Regression’.
Model Performance
Outcomes were predicted using either a RMLR model with an exchangeable correlation structure or a RMRF model with an exchangeable correlation structure.
Figure 2 shows the probability of having a composite outcome event (i.e., either hypo- or hyperglycemia) in the 2 h after the start of activity based on the glucose level and glucose rate of change at the start of the activity. For preactivity values, the minimum composite risk occurred when the glucose level was between 132 and 160 mg/dL and the glucose rate of change was between −0.4 and −1.9 mg/dL/min. Type of activity was included in the best RMRF model for the composite outcome at the start of activity, but not the best RMLR model. The probability of developing either hypo- or hyperglycemia (or both) ranged from 27% for aerobic activities and play to 24% for walking (Supplementary Fig. S3).
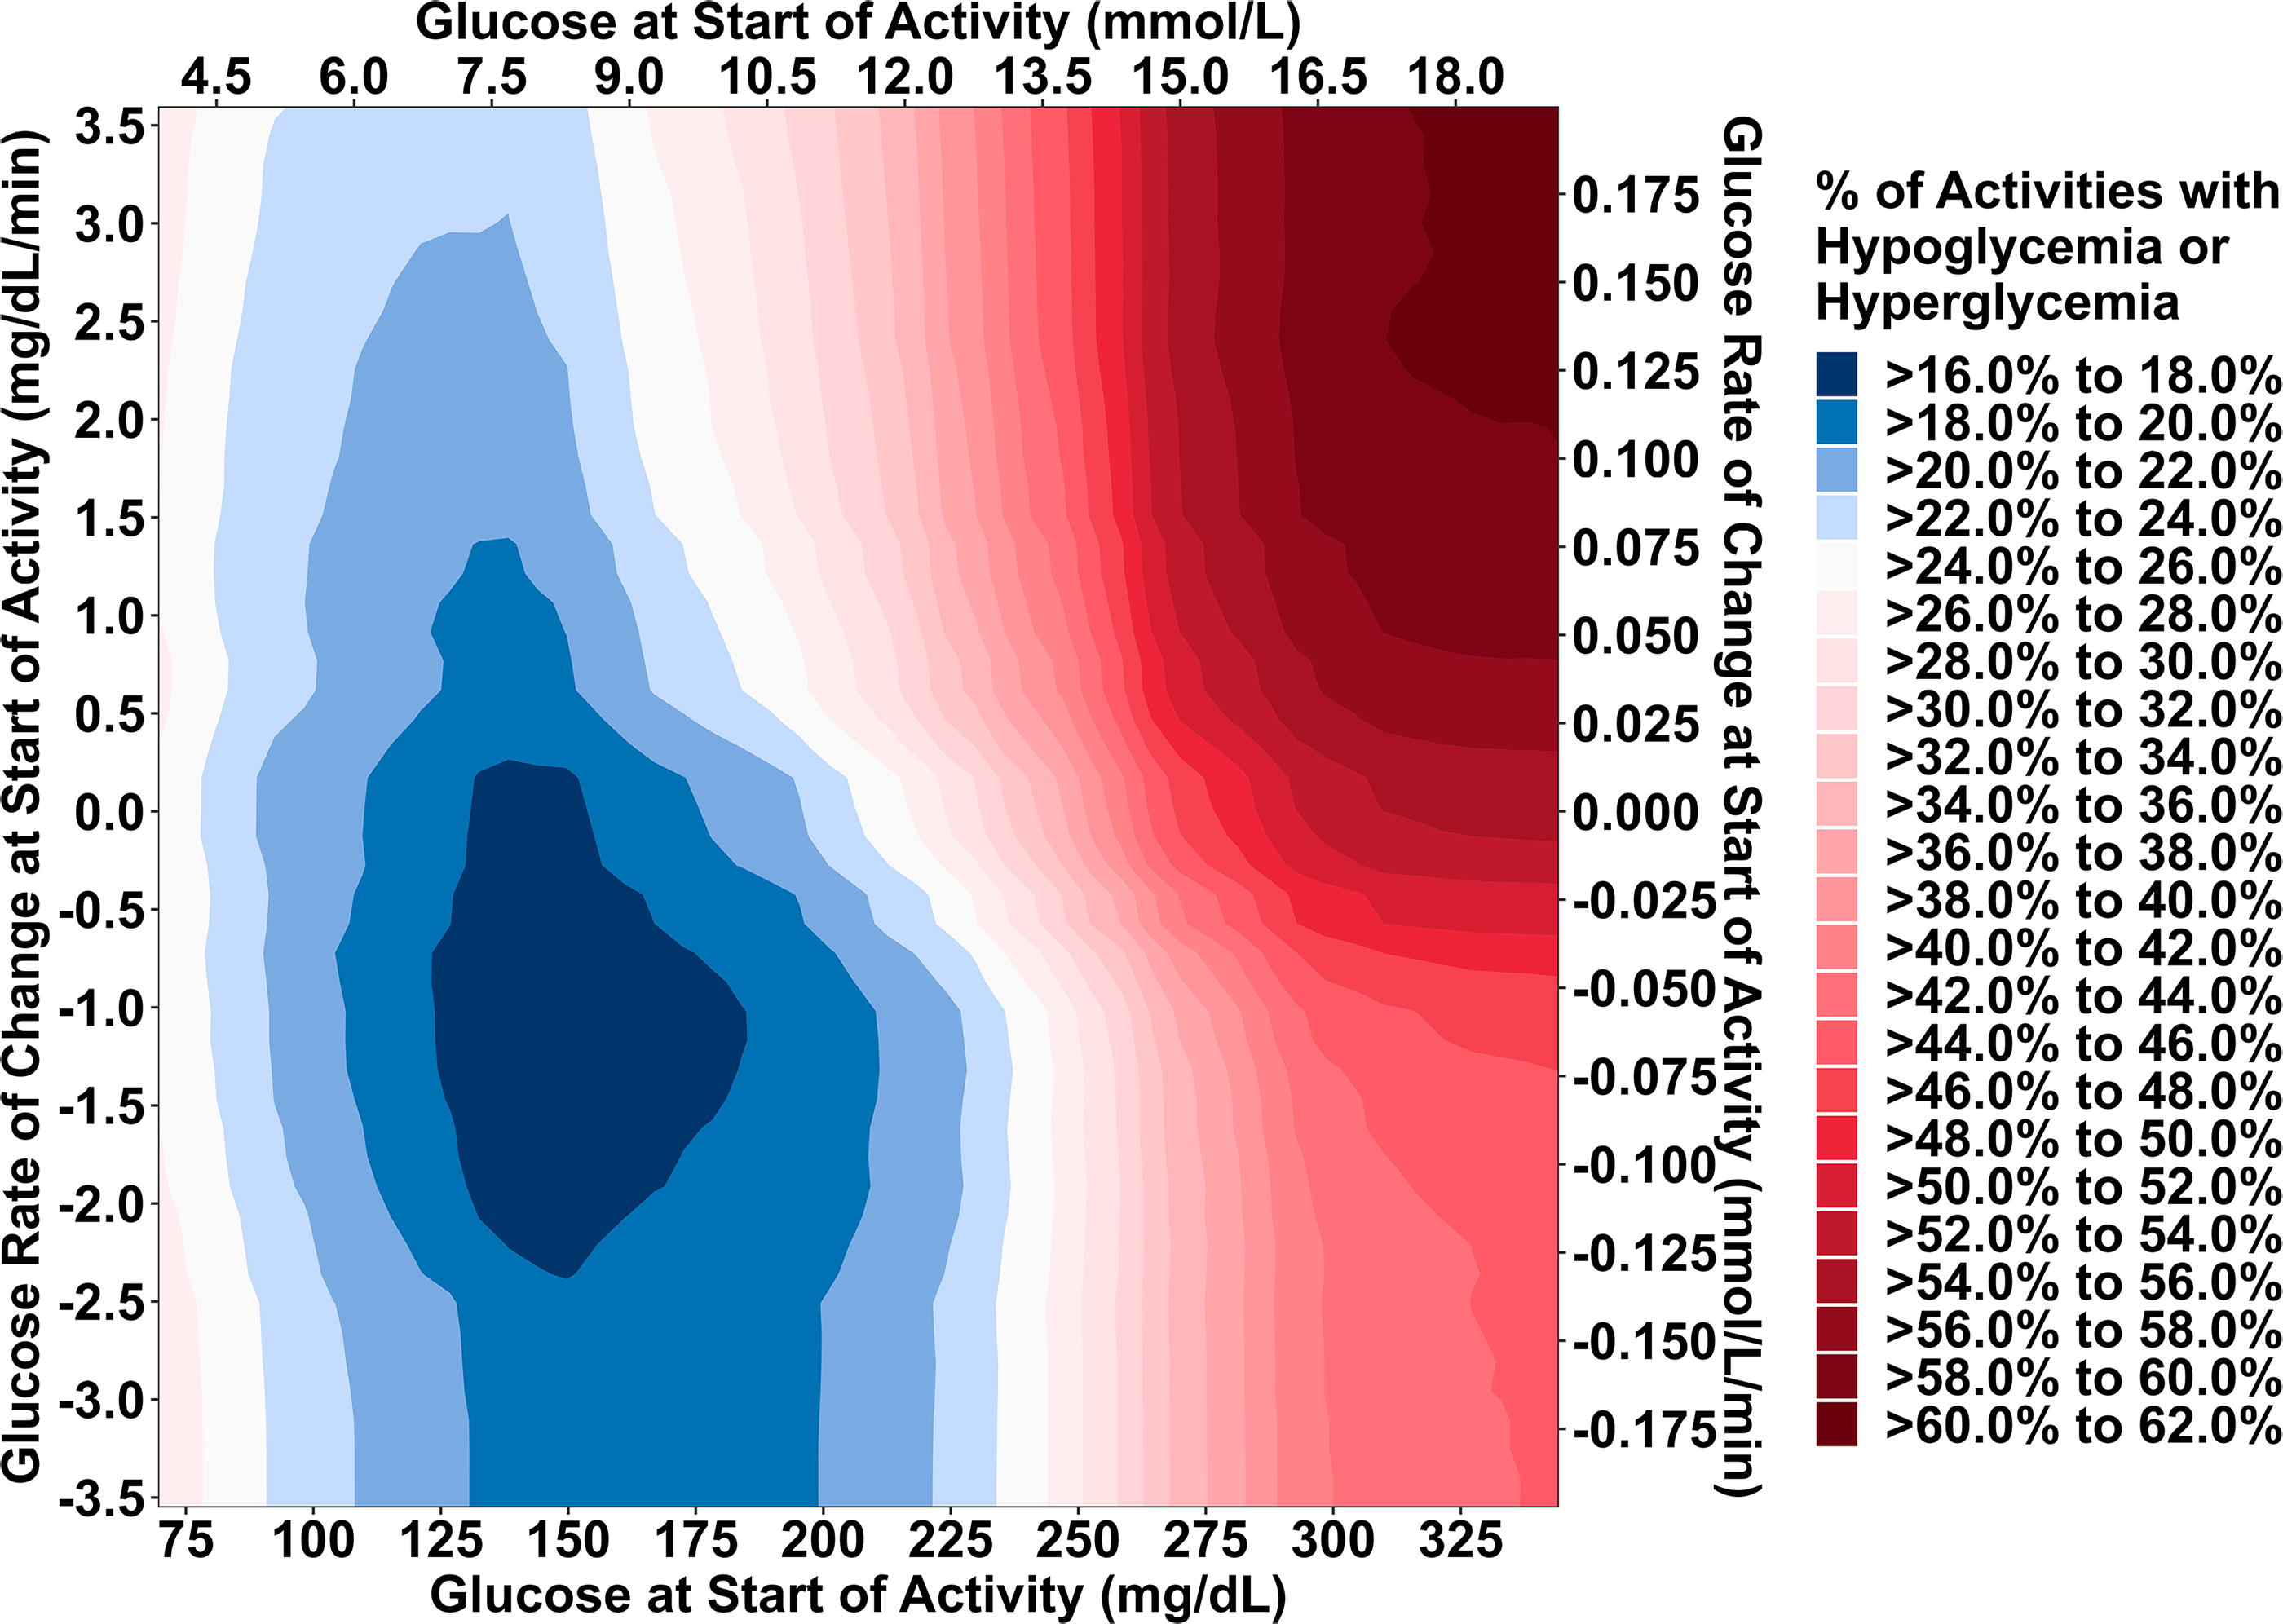
Heat map probability of hypoglycemia or hyperglycemia in the 2 h following start of activity based on glucose levels and glucose rate of change at the start of activity.
Hypoglycemia
The best RMRF model for hypoglycemia at the start of activity used the following predictors (listed here by order of importance, as shown in Supplementary Fig. S4): glucose at the start of activity, percent time <70 mg/dL during the 24 h prior to activity, insulin on board at start of activity (U/kg), glucose rate of change at the start of activity, HbA1c, type of activity, insulin modality, age, and activity intensity. For predicting hypoglycemia risk, the AUROC was similar for RMRF and RMLR (0.788 vs 0.757, difference in AUROC = 0.031 [95% CI:−0.011 to 0.074], P = 0.20; Table 2). The AUPRC and balanced accuracy were higher and Brier score was lower for RMRF (Table 3). The hypoglycemia risk was only relatively high (>20%) when glucose level at start of activity was ≤100 mg/dL and glucose rate of change was dropping by at least 1.0 mg/dL/min (Supplementary Fig. S5). IOB levels influenced hypoglycemia risk, with higher levels resulting in higher risk and the effects were influenced by preactivity glucose concentration (Supplementary Fig. S6). In other words, moderate IOB levels at activity start or end (0.050 to 0.150 U/kg) were not associated with unacceptable hypoglycemia risk (i.e., >10% risk), as long as the preactivity glycemia was also elevated (>180 mg/dL). The type of physical activity was included in the best RMRF model for hypoglycemia at the start of activity, but not the best RMLR model. Small differences in hypoglycemia risk, based on activity type, were found. Specifically, activities identified as “play” and mixed activities had the highest probability of hypoglycemia at 11%, and walking had the lowest hypoglycemia risk at 9% (Supplementary Fig. S3).
Hyperglycemia
The predictive performance of RMRF and RMLR was highest for assessing the risk of hyperglycemia following start of activity, with no significant difference in AUROC between the two models (0.896 vs. 0.901, difference in AUROC =−0.005 [95% CI:−0.027 to 0.017], P = 0.63; Table 2). The AUPRC and PPV were higher with RMRF, but balanced accuracy was higher and Brier score was lower with RMLR compared with RMRF (Table 3). Preactivity glucose concentration and glucose rate of change at the start of activity heavily influenced the risk of hyperglycemia (Supplementary Fig. S7). However, hyperglycemia risk was only relatively high (>30%) if the preactivity glucose was >250 mg/dL and glucose rate of change was neutral or positive (i.e., rising).
End of activity
Composite
The three variables included in the RMRF model for predicting composite risk during end of activity period in descending order of importance were glucose at the end of activity, glucose rate of change at the end of activity, and percent time >250 mg/dL during the 24 h prior to activity (Fig. 1). The AUROC for the composite outcome at the end of activity was also numerically higher for RMRF compared with RMLR, but this did not reach statistical significance (0.756 vs 0.710, difference in AUROC = 0.045 [95% CI:−0.021 to 0.112], P = 0.20). Figure 3 shows the probability of having a composite outcome event (i.e., either hypo- or hyperglycemia) in the 2 h after the end of activity based on the glucose level and glucose rate of change at the end of the activity. The minimum composite risk occurred when the glucose level was between 128 and 133 mg/dL and the glucose rate of change was between 0.4 and −0.6 mg/dL/min. Type of activity was not included in either model since it was not predictive of composite risk. Supplementary Table S4 shows the performance on the training data for RMRF and RMLR. Again, RMRF consistently had a higher AUROC than RMLR on the training data.

Heat map probability of hypoglycemia or hyperglycemia in the 2 h following end of activity based on glucose levels and glucose rate of change at the end of activity.
Hypoglycemia
The best RMRF model for hypoglycemia at the end of activity used the following predictors (listed here by order of importance, as shown in Supplementary Fig. S8): glucose at the end of activity, glucose rate of change at the end of activity, percent time <70 mg/dL during the 24 h prior to activity, percent time >250 mg/dL during the 24 h prior to activity, insulin on board at start of activity (U/kg), and change in glucose during activity. There was no difference between RMRF and RMLR for predicting hypoglycemia at the end of activity (0.838 vs. 0.819, difference in AUROC = 0.019 [95% CI:−0.027 to 0.065], P = 0.44; Table 2). Similar to the start of activity, the hypoglycemia risk was only relatively high (>20%) when postactivity glucose level was ≤100 mg/dL and glucose rate of change was dropping by at least 1.0 mg/dL/min (Supplementary Fig. S9). IOB levels had a small effect on hypoglycemia risk with higher levels resulting in higher risk (Supplementary Fig. S10).
Hyperglycemia
The predictive performance of RMRF and RMLR at the end of activity was highest for assessing the risk of hyperglycemia at the end of activity, with no significant difference in AUROC between the two models (0.882 vs. 0.884, difference in AUROC =−0.003 [95% CI:−0.022 to 0.016], P = 0.76; Table 2). Postactivity glucose concentration and glucose rate of change at the start and end of activity heavily influenced risk (Supplementary Fig. S11). However, similar to start of activity, hyperglycemia risk was only relatively high (>30%) if glucose at the end of activity was >250 mg/dL and the risk increased further if the glucose rate of change was neutral or positive.
Discussion
In this observational study of free-living activity in adolescents with T1D, we report a composite risk score for predicting the development of either hypo- or hyperglycemia (or both) during and immediately after activity based on several potential predictors, including pre- and postactivity glycemic trends such as glucose at the start of activity and glucose rate of change as measured by CGM and other modifying factors such as IOB and activity type. We observed that approximately 25% of all physical activity events are associated with developing either hypoglycemia (≥15 consecutive minutes <70 mg/dL; 10%) or hyperglycemia (≥15 consecutive minutes >250 mg/dL; 16%) in the time frame of 2 h after the start of activity, with the average activity duration lasting ∼50 min. Overall, having modestly elevated glycemia prior to activity (130–160 mg/dL), along with neutral or only slightly dropping glucose rates of change prior to activity (−0.4 to −1.9 mg/dL/min), results in lower composite risk. At the end of activity, glucose within a similar range (125–180 mg/dL), with glucose levels neutral or rising, also results in less composite risk. Surprisingly, the type of activity did not impact composite risk score much, but activities such as walking, physical labor, and anaerobic activities tended to have lower hypoglycemia risk. These findings are important since they support CGM-based consensus guidelines for elevated glucose concentrations prior to activity (i.e., 125–200 mg/dL) to help limit activity-induced hypoglycemia in those at low to moderate hypoglycemia risk. 21
The RMRF achieved higher precision than RMLR at predicting the composite risk of hypo- and hyperglycemia after starting activity (AUROC 0.737 vs 0.661, P < 0.001). Other accuracy metrics also demonstrated superior performance with RMRF over RMLR, including PPV, indicating that RMRF may help adolescents with T1D avoid treating hypo- or hyperglycemia unnecessarily. The RMLR model achieved lower AUROC than RMRF when predicting the composite outcome likely because the true relationship between predictors and response was nonlinear. For example, low glucose values have high risk of hypoglycemia, whereas high glucose values have high risk of hyperglycemia, so the effect of glucose on composite risk is nonlinear. In addition, RMRF can handle interactions and the effect of some predictors seemed to be interacting with other predictors as seen in the heat map figures. While interactions and higher-order variables could have been added to the RMLR model, there are too many possible two-way interactions and higher-order terms that make this option practically infeasible.
Glucose level at the start of activity was the most important predictor according to RMRF, which has been found previously by Midroni et al., 22 Ben Brahim et al., 23 and Bergford et al. 18 Interestingly, it can be acceptable for an adolescent with T1D to initiate an activity event with a negative glucose rate of change, as long as their glucose value is elevated >125 mg/dL, in slight contrast to current recommendations to target stable glucose and ideally to have a pre-exercise glucose concentration in the range of 125–200 mg/dL by Moser et al. 21 Based on the RMRF model presented here, adolescents should aim to have a glucose between 130 and 160 mg/dL and the rate of change was between −0.4 and −1.9 mg/dL when starting their activity to minimize the risk of both hypo- and hyperglycemia. Other factors such as an adolescent’s tendency to be above or below this target range had just as much impact as achieving stable glucose. In other words, both pre-exercise concentration and glucose rates of change before exercise should be considered to assess a composite risk score. Based on this risk assessment, which ideally could be automated, various clinical strategies could be suggested to ameliorate risk for either hypo- or hyperglycemia, such as carbohydrate feeding, activity choice, and/or activity delay.
It is important to note that the direction of glucose trend before exercise influences which outcome the adolescent will likely encounter; lower glucose values and negative rates of change are more likely to lead to hypoglycemia, while higher glucose values and positive rates are more likely to lead to hyperglycemia. While intuitive, the risk for each of these outcomes has not previously been estimated. We found similar results for hypoglycemia prediction based on pre-exercise factors as to what was recently published by Bergford et al. 18 based on the adult T1DEXI dataset. Glucose at start of activity was again found to be the most important predictor of hypoglycemia in our model, and glucose rate of change, IOB, percent time <70 mg/dL during the prior 24 h, and type of activity were also found to be strongly predictive of hypoglycemia. Cichosz et al. examined weekly risk of hypoglycemia and also identified previous time below range, as well as the low blood glucose index (LBGI) and the glycemic risk assessment diabetes equation (GRADE), as important predictors of future hypoglycemia. 24 In this study, it was again demonstrated that lower glucose values at the start of activity may not necessarily result in hypoglycemia during exercise if the glucose rate of change is positive, with glucose values as low as 120 mg/dL showing below average risk, similar to the results in Bergford et al. 18 and much lower than the threshold of 182 mg/dL found by Reddy et al. 16 In fact, RMRF predicts below average risk for glucose values below 182 mg/dL as long as glucose rate of change is greater than −2.0 mg/dL/min compared with the overall study risk of hypoglycemia. Riddell and Milliken also proposed a carbohydrate feeding algorithm to help prevent hypoglycemia during exercise based on glucose levels and glucose rate of change during the activity for adolescents and young adults with T1D. 25 They suggested carbohydrate feeding as soon as glucose dropped below 7.0 mmol/L (<140 mg/dL), with higher carbohydrate intake if the glucose concentration was trending down. The recommendations generally match the results observed in this study at the start of activity, except we found that glucose values as low as 120 mg/dL at the start of activity and 85 mg/dL at the end of activity can have below average risk of hypoglycemia if the rate of change was high enough. This may be because the participants in this real-world study were consuming carbohydrates during the activity without logging them into their digital study food intake logs. Overall, we suggest, based on these data here, that adolescents should also target lower insulin on board (IOB) prior to and during the activity, particularly if the pre-exercise glycemia is not elevated. While less important for hyperglycemia, higher IOB increases the risk of hypoglycemia, albeit the effect is modest, likely because a higher IOB often coincides with recent carbohydrate and or meal consumption (Supplementary Fig. S6). This finding is similar to Ben Brahim et al., 23 who found that higher IOB was associated with decreases in glucose concentrations during exercise. There was a slight but positive difference in hypoglycemia risk associated with IOB above 0.05 U/kg, but IOB below 0.05 U/kg tended to decrease the probability of hypoglycemia.
Ideal ending glucose concentration for low composite risk was between 128 and 133 mg/dL along with a glucose rate of change between 0.4 and −0.6 mg/dL/min. Surprisingly, glucose rate of change had less impact for hyperglycemia compared with hypoglycemia at the end of activity. IOB was included in both separate models for hyperglycemia and hypoglycemia at the end of activity, but it had little impact on the probability of either outcome (Supplementary Fig. S8). Remarkably, elevated IOB did not increase the risk of hypoglycemia much if glucose levels at the end were below 100 mg/dL, probably because risk was already elevated, but it did increase hypoglycemia risk if glucose levels were above this range. The probability of hyperglycemia did not change based on the IOB levels after adjusting for glucose at the end of activity.
A major strength of this study was the database of real-world activities used, with just under 2000 activities analyzed from 225 participants. While the risk for exercise-associated hypoglycemia has been reported in carefully conducted clinical studies, whereby the hypoglycemia risk rate approximates 30%–40% if no nutrition and or insulin dose adjustments are made for exercise in non HCL users, 2,12,26,27 this study is the first to estimate hypoglycemia risk in a large cohort of predominantly HCL users in a real-world setting. This study also made use of CGM data to allow for more accurate evaluation of the timing and duration of hypo- and hyperglycemia exposure associated with activity. Moreover, to help profile a composite dysglycemia risk score, a minimum of 1.5 h of CGM data was required for an activity period to be included in the analyses. However, a limitation is that the cohort may not be representative of the general pediatric T1D clinical population, whereby glucose management is typically less optimal. 28 In addition, the T1DEXI pediatric cohort was physically active, had low HbA1c levels, and there was a high proportion using CGM and HCL systems. However, the effect of each predictor was assessed within participants, so results should still be applicable to the general population of youth with T1D. There was a large computational burden to construct the models (each model took approximately one hour to compute), which limited the opportunity to optimize parameters and to formally test the significance of each predictor. Importantly, the error rate stabilized around 300 trees, indicating that the 500 used for each model were sufficient (Supplementary Fig. S12). Moreover, once a model was fitted, predictions could be returned quickly for a new observation. There may be other important factors that would be measured during activity such as percent of heart rate maximum, percent heart rate reserve, and carbohydrate feeding that we did not include as they would be measured after the start of activity and not enough activities had nonmissing data at the end of activity. The RMRF models are accurate even without these predictors, and the PDPs that were created from those models provide simple decision support systems at the start and end of activity.
In summary, accurate predictions of physical activity-associated hypoglycemia, hyperglycemia, and composite risk outcomes can be made for active adolescents with T1D using readily available information at the start and end of activity using RMRF and RMLR. This study identified important predictors that suggest various glycemia targets to reach before starting activity to minimize the risk of either hypoglycemia or hyperglycemia. This study also identifies factors that influence outcomes following activity, which can help youth with T1D to better manage the postactivity period. These findings can be implemented through decision support systems or HCL systems in order to make activity safer for youth with T1D.
Footnotes
Authors’ Contribution
S.B. and P.C. wrote/edited the article. S.B. performed statistical analysis. M.C.R., R.L.G., S.R.P., M.A.C., and J.L.S. reviewed, edited, and contributed to introduction and discussion.
Author Disclosure Statement
S.B. reports no conflicts of interest. M.C.R. serves on the following advisory panels: Zealand Pharma A/S, Zucara Therapeutics, Indigo Diabetes; acts as a consultant for the Jaeb Center for Health Research and has given lectures sponsored by Dexcom, Inc., Novo Nordisk, and Sanofi. He is also a shareholder, or holds stocks in, Supersapiens and Zucara Therapeutics. R.L.G. reports no conflict of interest. S.R.P. reports receiving grants from The Leona M. and Harry B. Helmsley Charitable Trust, the National Institutes of Health, and the Jaeb Center for Health Research; honorarium from the American Diabetes Association, outside the submitted work. M.A.C. is Chief Medical Officer of Glooko, Inc., and has received research support from Dexcom and Abbott Diabetes Care. Children’s Mercy Kansas City has received grants or contracts for M.A.C. from the National Institutes of Health, The Leona M. and Harry B. Helmsley Charitable Trust, JDRF, the Emily Rosebud Foundation, Eli Lilly, the Jaeb Center for Health Research, Tolerion, and Garmin. J.L.S. reports serving, or having served, on advisory panels for Bigfoot Biomedical, Cecelia Health, Insulet Corporation, Medtronic Diabetes, StartUp Health Diabetes Moonshot, and Vertex and having served as a consultant to Abbott Diabetes, Bigfoot Biomedical, Insulet, Medtronic Diabetes, and Zealand. Yale School of Medicine has received research support for J.L.S. from Abbott Diabetes, Jaeb Center for Health Research, JDRF, Insulet, Medtronic, NIH, and Provention Bio, Inc. P.C. reports no conflict of interests.
Funding Information
Research reported in this publication was supported by The Leona M. and Harry. B. Helmsley Charitable Trust. Dexcom provided continuous glucose monitors for the T1DEXIP study at a discounted rate.
Supplementary Material
Supplementary Data
Supplementary Table S1
Supplementary Table S2
Supplementary Table S3
Supplementary Table S4
Supplementary Figure S1
Supplementary Figure S2
Supplementary Figure S3
Supplementary Figure S4
Supplementary Figure S5
Supplementary Figure S6
Supplementary Figure S7
Supplementary Figure S8
Supplementary Figure S9
Supplementary Figure S10
Supplementary Figure S11
Supplementary Figure S12
References
Supplementary Material
Please find the following supplemental material available below.
For Open Access articles published under a Creative Commons License, all supplemental material carries the same license as the article it is associated with.
For non-Open Access articles published, all supplemental material carries a non-exclusive license, and permission requests for re-use of supplemental material or any part of supplemental material shall be sent directly to the copyright owner as specified in the copyright notice associated with the article.
