




Abstract
Objective:
To assess the performance of continuous glucose monitoring (CGM)-measured glycemic metrics in predicting development of gestational diabetes mellitus (GDM) and select perinatal complications.
Research Methods:
In a prospective observational study, CGM data were collected from 760 pregnant females throughout gestation after study enrollment. GDM was diagnosed using the oral glucose tolerance test (OGTT) at 24–34 weeks of gestation. Predictive models were built using logistic and elastic net regression. Predictive performance was assessed by the area under the receiver-operating characteristic (AUROC) curve.
Results:
The AUROCs of using second trimester percent time >140 mg/dL (TA140) and week 13–14 TA140 in predicting GDM were 0.81 and 0.74, respectively. The AUROCs for predicting large-for-gestational-age (LGA) births and hypertensive disorders of pregnancy (HDP) using second trimester TA140 were both 0.58. When matching the specificity of OGTT, a model using TA140 in weeks 13–14 achieved similar sensitivity to OGTT in predicting HDP (13% vs. 10%, respectively) and LGA (6% for both methods). Elastic net also demonstrated similar AUROC and diagnostic performance with no meaningful improvement by using multiple predictors.
Conclusion:
CGM-measured hyperglycemic metrics such as TA140 predicted GDM with high AUROCs as early as 13–14 weeks of gestation. These metrics were also similar statistically to the OGTT at 24–34 weeks in predicting perinatal complications, although sensitivity was low for both. CGM could potentially be used as an early screening tool for elevated hyperglycemia during gestation, which could be used in addition to or instead of the OGTT.
Introduction
Hyperglycemia during pregnancy is associated with increased risk of perinatal complications such as large-for-gestational-age (LGA) birth weight, neonatal hypoglycemia, cord blood C-peptide level above the 90th percentile, preeclampsia, and primary cesarean delivery. 1 The current standard of practice for screening for elevated hyperglycemia is for pregnant females to take an oral glucose tolerance test (OGTT) at ∼24–28 weeks of gestation to determine if the participant has gestational diabetes mellitus (GDM) or dysglycemia during pregnancy. However, one limitation with OGTT is that it provides only a snapshot of a participant’s glucose levels during the few hours after ingestion of the glucose solution and does not offer insight into possible elevated glucose levels outside of the testing duration.
The development of accurate continuous glucose monitoring (CGM) systems has opened the possibility of all-day glycemic monitoring early in pregnancy with the possibility of being able to diagnosis GDM much earlier than is currently done with an OGTT at 24–28 weeks. Whether CGM-measured glucose levels can predict perinatal complications better than the OGTT, or possibly earlier during the gestational period, is yet to be explored in detail. We conducted an observational trial in pregnant females aimed to assess the performance of CGM metrics in predicting GDM and select perinatal complications.
Methods
Study design
The Glucose Levels Across Maternity (GLAM) study was an observational, noninterventional study designed to collect CGM data during pregnancy and relate CGM-measured glucose levels with GDM and preselected perinatal complications. 2 The protocol and informed consent forms were approved by a central institutional review board. A sample size of 770 participants was calculated for the primary analyses to detect differences in the sensitivities of CGM-based diagnostic tests versus OGTT in predicting perinatal complications, including LGA infants; hypertensive disorders of pregnancy (HDP), which included gestational hypertension, preeclampsia, superimposed preeclampsia, and worsening chronic hypertension; primary cesarean section delivery (C-section); and preterm birth.
Between June 2020 and December 2021, 937 eligible adults enrolled into the study from two academic-based clinical sites: the University of Pennsylvania and the International Diabetes Center at Park Nicollet. Major eligibility criteria included individuals aged 18 years and older with singleton pregnancies under routine prenatal care at or before 16 weeks and 6 days of gestational age as determined by ultrasound, hemoglobin A1c (HbA1c) less than 6.5%, no pregravid diabetes diagnosis, no signs of abnormalities in fetal or placental development, and no use of oral systemic steroids or medication intended to lower blood glucose. Electronic informed consent was obtained from each participant. Participants wore a blinded Dexcom G6 Pro sensor and transmitter throughout pregnancy as often as they chose. As per usual care, an OGTT (either a two-step 100 g or a one/two-step 75 g OGTT) was performed between 24 and 34 weeks. As the CGM sensors were blinded to both participant and clinician, GDM diagnosis and treatment were based solely on the OGTT screening procedures. At conclusion of pregnancy, data were recorded for perinatal complications by individual chart review. LGA was defined by INTERGROWTH-21st newborn standard. 3 HDP was defined by the American College of Obstetricians and Gynecologists. 4 Primary cesarean delivery was verified by individual chart review.
Statistical methods
Participants were included in the analysis if they had an OGTT for GDM assessment, a perinatal complication assessment at delivery, and at least 14 days of CGM data during the entire gestational period with at least 10 days of CGM data in the second trimester. CGM-measured glycemic metrics were calculated using all available CGM data during each trimester and by 2-week gestational period. For GDM analyses, only CGM data before the OGTT date were included. CGM metrics were calculated for periods with at least 10 days of CGM data.
CGM metrics of participants with versus without GDM and with versus without perinatal complications were compared. Metrics were summarized as means and standard deviations (SDs) or summary statistics appropriate to the distribution. CGM-measured glycemic metrics for participants with versus without GDM and with versus without perinatal complications were compared using two-sample t-tests. For skewed CGM-measured outcomes, a Mann–Whitney U test was used instead. All P values were two-sided, and multiple comparisons were adjusted for by using the Benjamini–Hochberg adaptive false discovery rate correction procedure. 5
For predictive model building, the following six metrics were prespecified to be the CGM-measured predictors: mean glucose, glucose SD, percent time >120 mg/dL, area under the curve (AUC) 120 mg/dL, percent time >140 mg/dL, and AUC 140 mg/dL. The modeling methods used to predict GDM and perinatal complications included logistic regression, elastic net regression, and random forests. All models used the CGM metrics calculated in the second trimester (14 weeks and 0 days of gestation to 27 weeks and 6 days of gestation), but additional elastic net regression and random forest models were fitted using the six metrics calculated in the first trimester (i.e., before 14 weeks and 0 days of gestation), the second trimester, and allowing an interaction between the first and the second trimester CGM metrics. To make the predictive performance of models using both first and second trimester CGM data comparable with models using only second trimester data, missing CGM metric data in the first trimester were handled using single imputation. Predictive performance was evaluated using the area under the receiver-operating characteristic (AUROC) curve, with higher values representing greater prediction accuracy. For reference, an AUROC of 0.5 indicates that the predictive performance of the model in predicting the outcome is no better than assigning everyone the same probability of developing the outcome, whereas an AUROC of 1.0 indicates that the model perfectly predicts the outcome. For assessing the predictive performance of a single variable, the AUROC was calculated by determining the sensitivity and specificity at each distinct cut point. For the elastic net and random forest models, predictions were estimated using 5-fold cross-validation to prevent overly optimistic results by overfitting. The predictive performance of mean glucose at 5 AM, body mass index (BMI) at study enrollment, screening HbA1c, percent time >120 mg/dL in 2-week periods, and percent time >140 mg/dL in 2-week periods were explored as additional predictors in post hoc analyses.
For the prediction of GDM, cut point selection was determined by Youden’s criteria and separately by conditioning a minimum 95% specificity for detecting GDM. For the prediction of prespecified perinatal complications, cut point selection was determined by matching the specificity of the OGTT diagnosis. Cut points to predict perinatal complications were also selected using Youden’s criteria.
The sensitivity of CGM-based predictive models was compared with that of the OGTT in predicting each perinatal complication using a McNemar test. The number of CGM models formally compared against OGTT were purposefully limited to reduce multiple comparison issues and prespecified to only compare the elastic net regression models. McNemar tests of differences in sensitivity in predicting LGA and HDP between the second trimester percent time >140 mg/dL diagnostic test and OGTT were performed as a post hoc analysis. Multiple comparisons in post hoc analyses were adjusted for by using the Benjamini–Hochberg false discovery rate correction procedure. 6
Analyses were performed with SAS software, version 9.4 (SAS Institute), and R software, version 4.2.2. 7
Results
Study participants
Between June 2020 and December 2021, 937 eligible adults enrolled into the study, of whom 760 had sufficient CGM data, an OGTT, and pregnancy outcomes recorded and were included in the analyses. Mean ± SD age at enrollment was 33 ± 4 years (range, 18–54 years), 77% were White, and 6% were of Hispanic or Latino ethnicity. The mean HbA1c at enrollment was 5.2 ± 0.3%, mean BMI was 26.7 ± 6.1 kg/m2, and 34% of the participants were primigravida. Additional baseline characteristics are listed in Table 1. Participants’ median CGM wear throughout gestation was 119 days of CGM data (interquartile range [IQR]: 79–146 days).
Participant Characteristics
GDM, gestational diabetes mellitus; IQR, interquartile range; SD, standard deviation.
Predictive models of GDM
Of the 760 participants analyzed, there were 55 (7%) diagnosed with GDM. Of those with GDM, 3 (5%) were diagnosed using the 1-step 75 g test, 23 (42%) were diagnosed using the 2-step 75 g test, and 29 (53%) were diagnosed using the 2-step 100 g test. Nine (16%) of the participants with GDM tested positive before 24 gestational weeks.
Participants with GDM had greater mean glucose (109 ± 13 mg/dL for GDM vs. 100 ± 8 mg/dL for no GDM, P < 0.001), percent time >120 mg/dL (median 23% vs. 12%, P < 0.001), percent time >140 mg/dL (median 7.1% vs. 2.7%, P < 0.001), and glucose SD (23 ± 5 mg/dL vs. 19 ± 3 mg/dL, P < 0.001) during their gestational period before the OGTT. Additional CGM-measured glycemic metrics for participants with versus without GDM are summarized in Supplementary Table S1. These glycemic differences between the GDM and no GDM group were consistent throughout the entire pregnancy, even as early as 13–14 weeks of gestation (Supplementary Table S2).
CGM-measured hyperglycemic metrics achieved high precision in predicting GDM (Table 2). Among the CGM-measured metrics investigated, percent time >140 mg/dL during the second trimester before OGTT was the strongest predictor of GDM (AUROC = 0.81; Fig. 1). 2 Other models that achieved similarly high precision were AUC 140 mg/dL, AUC 120 mg/dL, glucose SD, % time 63–120 mg/dL, % time 63–140 mg/dL, and percent time >120 mg/dL, with an AUROC ranging from 0.77 to 0.81. Mean glucose (AUROC = 0.73), BMI (AUROC = 0.64), and HbA1c (AUROC = 0.59) were weaker predictors of GDM.

ROC curve of logistic model of second trimester % time >140 mg/dL as a predictor of GDM. GDM, gestational diabetes mellitus; ROC, receiver-operating characteristic.
Predictive Performance of Screening or Diagnosing for GDM Using CGM Metrics (n = 760)
The null model giving each pregnancy the same probability of GDM (7% = 55/760) gives an AUROC of 0.5. AUROC values closer to 1 indicate higher accuracy.
Threshold based on Youden’s criteria.
Based only on participants without missing data.
Only inclusive of participants with at least five second trimester reported meals before OGTT date.
Stratified 5-fold cross-validation was used to select penalty parameters and calculate mean AUC. Single imputation was used to handle missing data in the first trimester.
Stratified 5-fold cross-validation was used to calculate mean AUC. Single imputation was used to handle missing data in the first trimester.
AUC, area under the curve; AUROC, area under the receiver-operating characteristic; CGM, continuous glucose monitoring; NPV, negative predictive value; PPV, positive predictive value.
High accuracy was also achieved with models with multiple predictors, such as logistic regression using second trimester mean glucose and glucose SD, elastic net regression using the six prespecified CGM metrics in the second trimester, and elastic net regression using the six prespecified CGM metrics in the first and second trimesters with interactions between the first and second trimesters (AUROC between 0.81 and 0.82; Table 2). However, the predictive performance for these more sophisticated models was not superior to using simply percent time >140 mg/dL to predict GDM. Surprisingly, the random forest models achieved only an AUROC between 0.71 and 0.76.
The predictive performances of CGM-measured percent time >140 and >120 mg/dL were further explored by 2-week periods to assess how early in gestation a single CGM sensor wear period could accurately predict GDM. CGM data from 13 to 28 weeks of gestation were included. For percent time >140 mg/dL, the predictive performance remained high across all 2-week periods, with the best predictive performance at 15–16 weeks of gestation and 21–22 weeks of gestation (both AUROC = 0.77; Fig. 2). The predictive performance for percent time >120 mg/dL was also similarly high across all 2-week periods but numerically slightly lower than using percent time >140 mg/dL.
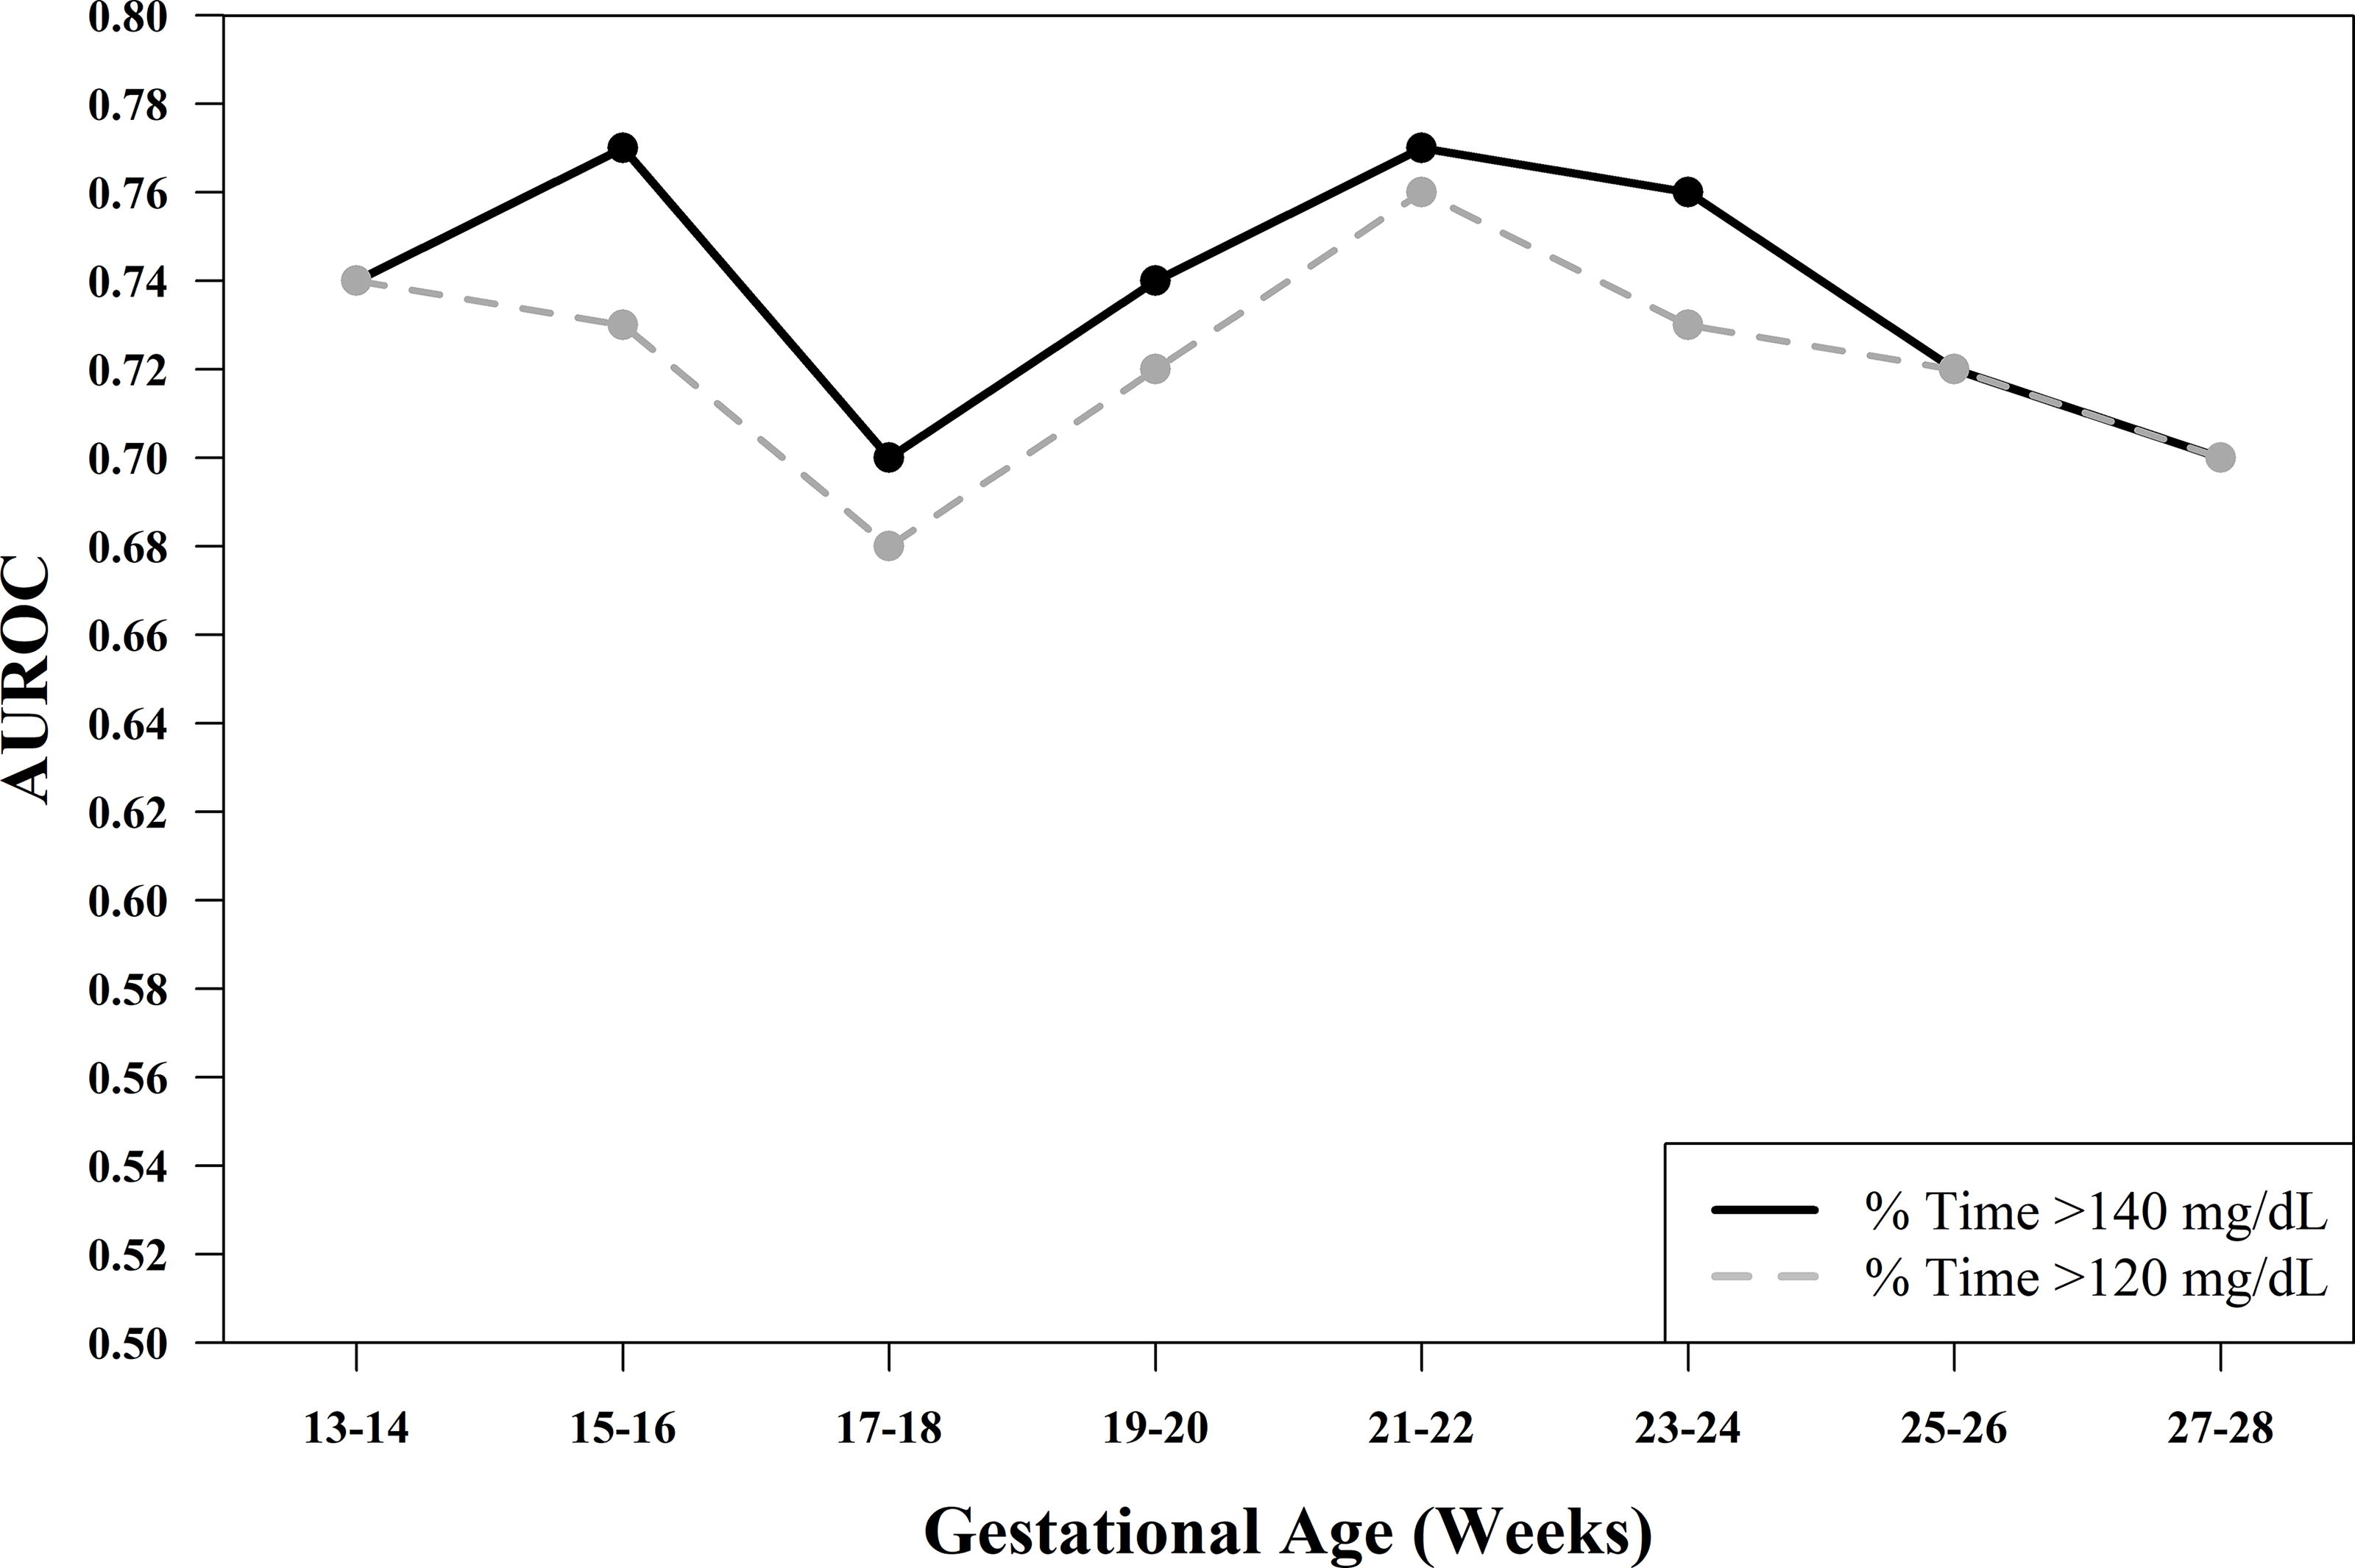
Line plot of the area under the receiver operating characteristic curve (AUROC) of % time >140 mg/dL and % time >120 mg/dL by 2-week gestational period.
The sensitivity, specificity, positive predictive value (PPV), and negative predictive value (NPV) of specific CGM-based glycemic models were calculated to evaluate their performance in predicting GDM. If the goal was to achieve a high specificity (i.e., fewer false positives), then categorizing participants as being at high risk of GDM when percent time >140 mg/dL is >12.9% during weeks 13–14 would achieve a specificity of 95% and a sensitivity of 27%. This CGM-based predictive model would have identified 8% of all participants as having high risk of GDM; 29% of those identified were eventually diagnosed with GDM (PPV), and only 5% of those not identified were eventually diagnosed with GDM (1-NPV; Supplementary Table S3).
Predictive models of perinatal complications
The prevalence of LGA infant was 16%. Participants with LGA infants had significantly more percent time >120 mg/dL (median 16% for LGA vs. 12% for no LGA, P = 0.006) and percent time >140 mg/dL (median 3.9% vs. 2.8%, P = 0.006; Supplementary Table S1) when compared with participants without LGA infants. All CGM metrics achieved a low AUROC for predicting LGA (range from 0.54 to 0.58; Table 3). The percent time >120 mg/dL, AUC 120 mg/dL, and percent time >140 mg/dL were the best-performing metrics at predicting LGA (AUROC = 0.58), but other metrics were also similarly accurate (AUROC ranged from 0.53 to 0.58). However, the CGM-based models’ predictive performance in LGA was similar to the predictive performance of OGTT. The OGTT specificity of predicting LGA was 93%, and obtaining the same specificity required classifying participants as having a higher risk of LGA if time >140 mg/dL was >10.1% during the second trimester. This CGM-based rule achieved a sensitivity of only 10% with percent time >140 mg/dL compared with sensitivity of 8% with OGTT (P = 0.62). There was little improvement in accuracy for models with multiple predictors. The elastic net with six prespecified CGM metrics from the second trimester achieved an AUROC of 0.57, and there was no improvement in sensitivity with elastic net when compared against OGTT sensitivity (P = 0.41; Table 3).
Predictive Performance of CGM Metrics to Predict LGA (n = 757)
P = 0.41 from a McNemar test of sensitivity in predicting LGA comparing elastic net regression using first trimester CGM metrics (Model N) to OGTT diagnosis of GDM (Model A). P = 0.78 for McNemar test of sensitivity in predicting LGA comparing elastic net regression using first and second trimester CGM metrics (Model P) to OGTT diagnosis of GDM (Model A). P = 0.62 for McNemar test of sensitivity in predicting LGA comparing second trimester % time >140 mg/dL (Model F) to OGTT diagnosis of GDM (Model A). The null model giving each pregnancy the same probability of LGA (16% = 123/757) gives an AUROC of 0.5. AUROC values closer to 1 indicate higher accuracy.
Based only on participants without missing data.
Stratified 5-fold cross-validation was used to select penalty parameters and calculate mean AUC. Single imputation was used to handle missing data in the first trimester.
Stratified 5-fold cross-validation was used to calculate mean AUC. Single imputation was used to handle missing data in the first trimester.
LGA, large for gestational age; OGTT, oral glucose tolerance test.
The prevalence of HDP was 27%. Participants with HDP had higher percent time >120 mg/dL (median 16% for HDP vs. 12% for no HDP, P < 0.001), percent time >140 mg/dL (median 3.5% vs. 2.8%, P < 0.001), and mean glucose (103 ± 8 vs. 99 ± 8 mg/dL) when compared with participants without HDP (Supplementary Table S1). All CGM metrics had a low AUROC for predicting HDP (range from 0.55 to 0.61, Table 4). The predictive performance of percent time >140 mg/dL was compared against predictive performance of OGTT. The OGTT specificity of HDP was 94%, and obtaining the same specificity required classifying participants as having higher risk of HDP if percent time >140 mg/dL was >9.6% during the second trimester. This CGM-based rule achieved a sensitivity of 15% compared with 9% with OGTT (P = 0.11). Once again, there was little improvement in accuracy for models with multiple CGM-metric predictors, and elastic net with six prespecified CGM metrics achieved a similar AUROC to percent time >140 mg/dL. The sensitivity of this elastic net model in predicting HDP was 12% compared with OGTT’s sensitivity of 9% (P = 0.29). For non-CGM metrics, BMI at study enrollment achieved the highest AUROC of 0.66, whereas HbA1c achieved only an AUROC of 0.55 (Table 4).
Predictive Performance of CGM Metrics to Predict HDP (n = 760)
P = 0.29 from a McNemar test of sensitivity in predicting HDP comparing elastic net regression using second trimester CGM metrics (Model N) to OGTT diagnosis of GDM (Model A). P = 0.29 for McNemar test of sensitivity in predicting HDP comparing elastic net regression using first and second trimester CGM metrics (Model P) to OGTT diagnosis of GDM (Model A). P = 0.11 for McNemar test of sensitivity in predicting HDP comparing second trimester % time >140 mg/dL (Model F) to OGTT diagnosis of GDM (Model A). The null model giving each pregnancy the same probability of HDP (27% = 204/760) gives an AUROC of 0.5. AUROC values closer to 1 indicate higher accuracy.
Based only on participants without missing data.
Stratified 5-fold cross-validation was used to select penalty parameters and calculate mean AUC. Single imputation was used to handle missing data in the first trimester.
Stratified 5-fold cross-validation was used to calculate mean AUC. Single imputation was used to handle missing data in the first trimester.
HDP, hypertensive disorders of pregnancy.
The prevalence of primary C-section and preterm births was 20% and 5%, respectively. There was no significant difference in glycemic control between participants with versus without primary C-sections and also with versus without preterm births (Supplementary Table S1).
To assess the performance of using a single CGM metric to predict LGA or HDP early in pregnancy through the use of roughly one CGM sensor, both week 13–14 percent time >140 mg/dL and week 13–14 percent time >120 mg/dL were explored as potential CGM-based risk assessors (Fig. 3). Classifying participants as having higher risk of LGA when week 13–14 percent time >140 mg/dL was greater than 12.8% or separately when week 13–14 percent time >120 mg/dL was greater than 36% yielded the same specificity as GDM (diagnosed via OGTT) at weeks 24–28. Similar CGM-metric thresholds were determined to match the specificity of OGTT for predicting HDP. These CGM-metric diagnostic tests yielded similar sensitivities compared with OGTT in detecting LGA (6% for percent time >140 mg/dL vs. 5% for percent time >120 mg/dL vs. 6% for OGTT) and HDP (13% vs. 12% vs. 10%, respectively).

Bar chart of sensitivity of OGTT and week 13–14 % time >120 and >140 mg/dL models in predicting LGA and HDP. n = 656 for LGA and 659 for HDP. For % time >120 and >140 mg/dL, sensitivities were calculated based on the best threshold that matched or exceeded OGTT specificity for each outcome (93% and 94% specificity for LGA and HDP, respectively). HDP, hypertensive disorders of pregnancy; LGA, large for gestational age; OGTT, oral glucose tolerance test.
Discussion
CGM metrics were highly predictive of GDM diagnosis based on OGTT. The most accurate single CGM metric predictor was percent time >140 mg/dL in the second trimester, which achieved an AUROC of 0.81. Importantly, percent time >140 mg/dL in weeks 15–16 of gestation was also able to predict a GDM diagnosis based on OGTT done at 24–34 weeks with an AUROC of 0.77.
The observed early differences in glucose control between those with versus without GDM imply that CGM could be used as a screening tool to treat elevated hyperglycemia earlier in the pregnancy. A simple screening test could classify participants with percent time >140 mg/dL >12.9% during weeks 13–14 as having a higher risk of GDM. This screening test would give positive results for 8% of participants and, of those, 29% would eventually be diagnosed with GDM (∼4 times greater risk); a negative result would occur for 92% of participants and, of those, 95% would eventually test negative on the OGTT.
Earlier detection of GDM could yield better maternal and neonatal outcomes. In the Treatment of Booking Gestational Diabetes Mellitus study, the use of an early 2-h 75-g OGTT before 20 weeks of gestation led to an adjusted absolute risk reduction of 5.6% in the prevalence of a composite neonatal outcome (birth before 37 weeks of gestation, birth weight ≥4500 g, birth trauma, neonatal respiratory distress, phototherapy, stillbirth or neonatal death, or shoulder dystocia) between those who were treated early for GDM versus those who followed the standard treatment schedule. 8
In our cohort, 7% of participants were diagnosed with GDM via OGTT generally at 24–28 weeks of gestation, and the prevalence of GDM was still low even for participants with relatively high CGM glucose levels during the second trimester. This indicates that only a portion of those with elevated glucose levels over a 24-h period will demonstrate increased carbohydrate intolerance during the OGTT.
The use of CGM to detect elevated glycemic levels in pregnant females without diabetes has previously been explored in small studies. 9 A previous smaller study with a shorter 7-day CGM wear duration also reported that those with GDM had higher CGM-measured glucose levels than those without GDM, and the authors also noted the same discordance between elevated glucose levels over a 24-h period versus elevated glucose levels only during OGTT, even suggesting that the OGTT may be insufficient for detecting elevated glucose levels during pregnancy. 10
The OGTT criteria were established based on blood glucose thresholds that indicate an increased risk of an individual’s subsequent risk of developing type 2 diabetes later in life. 11 The Hyperglycemia and Adverse Pregnancy Outcome (HAPO) study showed a positive continuous association with glucose levels during OGTT and select neonatal outcomes, 1 and this was also evaluated in the CGM-based glycemic metric predictive models. Of the perinatal complications explored, CGM-measured glucose metrics performed the best in predicting HDP and had marginal value in predicting LGA. Of the participants included in the analysis of gestational week 13–14 percent time >120 mg/dL and percent time >140 mg/dL, the odds of developing LGA and HDP when the participant developed GDM based on the OGTT compared with participants who did not develop GDM were 0.92 and 1.75, respectively. The odds of developing LGA and HDP in participants with >12.9% time >140 mg/dL during gestational weeks 13–14 compared with participants with ≤12.9% time >140 mg/dL during weeks 13–14 were 1.00 and 3.70, respectively. In comparison, the HAPO study also found strong associations between elevated glucose levels after ingestion of the 75 g OGTT glucose solution versus birth weight >90th percentile and HDP. In the GLAM study, the lack of association between week 13–14 percent time >140 mg/dL and LGA could be due to the treatment of participants diagnosed with GDM after the OGTT, preventing development of perinatal complications such as LGA, which would make the predictive accuracy of week 13–14 percent time >140 mg/dL appear more conservative in this analysis. The models explored in this analysis also suggest that models for perinatal complications with multiple predictors do not perform substantially better than models with a single predictor, the latter of which is easier to use in practice.
The performance of CGM metrics to predict the selected perinatal complications appears to be similar to that of OGTT. The observed accuracy of CGM metrics in predicting perinatal complications was similar or slightly higher than OGTT, possibly because of chance, but suggests CGM metrics are similar to OGTT and could be used to screen for elevated perinatal risk because of higher glucose levels in participants who cannot tolerate the OGTT well. 12
The strengths of this study include the collection and use of a large, varied dataset to both assess glycemic differences between participants with versus without GDM or perinatal complications and train predictive models of these outcomes. Participants wore the CGM throughout the entire pregnancy. The main limitation of this analysis is that a large proportion of the cohort did not have CGM data available in the first trimester (e.g., gestational weeks 13–14). Single imputation was used to impute missing CGM data during this period, and imputed results were similar to results using the subset of the cohort that did have first trimester data. Another limitation related to the predictive performance of CGM in predicting GDM is that both sites included in the study used different GDM diagnosis criteria, which indicates that using the same CGM-based model to predict GDM may result in different predictive performances by GDM diagnosis criteria. However, this does not impact the analysis of which CGM metric performed the best in predicting GDM, nor does it impact the value of CGM in predicting select perinatal complications.
Through the use of CGM, we observed that pregnant females with GDM had higher glucose levels than those without GDM. CGM metrics predicted GDM with high AUROCs several weeks before the OGTT, which suggests that CGM metrics could be used as an early screening test for GDM. We also found that participants with LGA and/or HDP also had higher glucose levels than those without these conditions throughout gestation. CGM metrics as early as 13–14 weeks in gestation had a similar predictive performance to OGTT performed at 24–28 weeks in predicting LGA and HDP; therefore, there is a potential for CGM to be used as a diagnostic tool for elevated hyperglycemia even earlier in the pregnancy, which potentially could result in a larger reduction in the incidence of perinatal complications than current GDM screening and treatment practices. Further studies are needed to assess this.
Footnotes
Acknowledgments
The authors would like to acknowledge support of the study center staff and other individuals who participated in the conduct of the trial; these are listed in the online Supplementary Material.
Authors’ Contributions
Z.L. wrote and edited the article. R. Beck, C.D., A.C., E.N., R. Bergenstal, M.J., S.D., M.B., K.K., J.S., and P.C. reviewed the article, contributed to the discussion, and edited the article.
Author Disclosure Statement
Z.L. reports no conflicts of interest. R. Beck reports no personal financial disclosures but reports that his institution has received funding on his behalf as follows: grant funding and study supplies from Dexcom. C.D. reports advisory work for Dexcom for GDM patient-facing materials and system implementation. A.C. reports no personal financial disclosures but reports that his institution has received funding on his behalf as follows: research support from Medtronic, Tandem, Insulet, Abbott, Dexcom, Eli Lilly, Novo Nordisk, Sanofi, and United Health Group and consultancy fees from MannKind and Novo Nordisk. E.N. reports no conflicts of interest. R. Bergenstal has received research support, has acted as a consultant, and has been on the scientific advisory board for Abbott Diabetes Care, Ascensia, Bigfoot Biomedical, Inc., CeQur, Dexcom, Eli Lilly, Embecta, Hygieia, Insulet, Medtronic, Novo Nordisk, Onduo, Roche Diabetes Care, Tandem Diabetes Care, Sanofi, United Healthcare, Vertex Pharmaceuticals, and Zealand Pharma. RMB’s employer, nonprofit HealthPartners Institute, contracts for his services, and he receives no personal income for any of these activities. M.J., S.D., M.B., K.K., J.S., and P.C. report no conflicts of interest.
Funding Information
Study funding was provided by The Leona M. and Harry B. Helmsley and
Supplementary Material
Supplementary Table S1
Supplementary Table S2
Supplementary Table S3
References
Supplementary Material
Please find the following supplemental material available below.
For Open Access articles published under a Creative Commons License, all supplemental material carries the same license as the article it is associated with.
For non-Open Access articles published, all supplemental material carries a non-exclusive license, and permission requests for re-use of supplemental material or any part of supplemental material shall be sent directly to the copyright owner as specified in the copyright notice associated with the article.
